
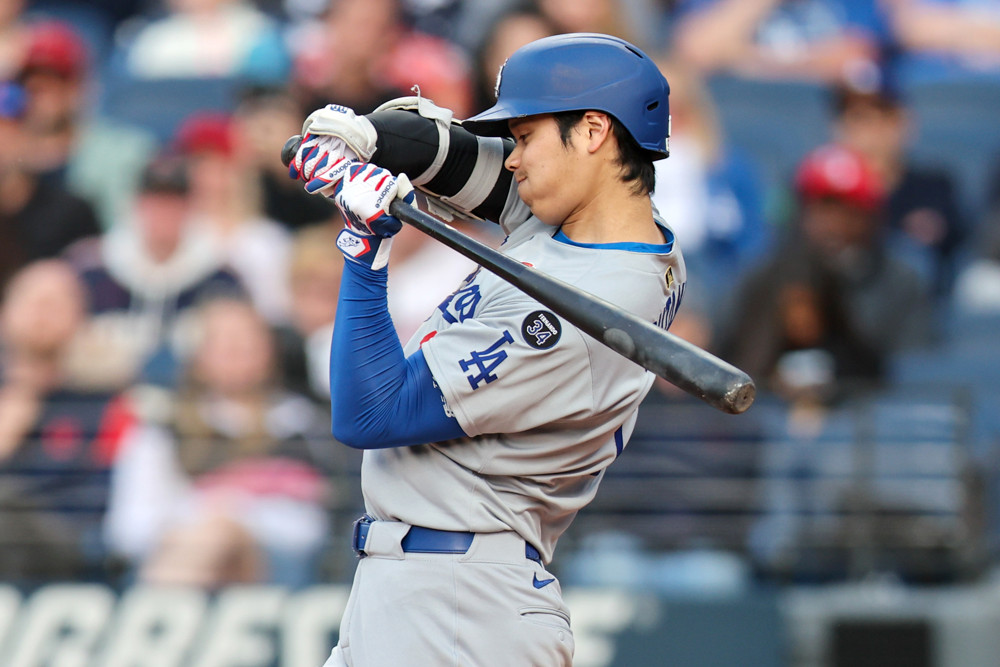
I often heard the phrases “Yes Yes Yes” and “Yes Yes No” while growing up playing baseball. Several coaches and former players would use these sayings to describe their mindset and overall approach at the plate. To me, there is no movement that better encapsulates the “Yes Yes No” saying than the checked swing. The checked swing allows everyone to look inside the mind of the hitter and see the exact moment they decide to say “No” in their head.
After reading the article “Checking In on Checked Swings” that current Blue Jays baseball research analyst Alex Eisert wrote in 2022 using the data we collect at Sports Info Solutions, I was intrigued and wondered whether anyone had looked at them from the hitters’ perspective. Often an afterthought in the analysis of hitters and their approach, could checked swings provide insight into offensive production?
Definitions
Before I started researching, I calculated five checked swing metrics:
- Checked Swing Percentage (ChSw%)
- Total Checked Swings / Total Pitches
- Checked Swings on pitches out of the strike zone (oChSw%)
- Checked Swings out of zone / Total Pitches
- Successful Checked Swings on pitches out of the strike zone (bChSw%)
- Checked Swings out of zone ruled balls / Total Pitches
- Failed Checked Swings on pitches out of the strike zone (sChSw%)
- Checked Swings out of zone ruled strikes / Total Pitches
- Conversion Rate
- Checked Swings out of zone ruled balls / Checked Swings out of zone
The data is taken from the 2023-2025 seasons and uses a minimum 300 at-bat threshold. It is worth noting that bChSw% and sChSw% do not add up perfectly to oChSw% due to the occasional umpire error on a called strike outside the strike zone.
Checked Swing Leaders
Out of the players included in the data, here are the top five hitters in checked swing percentage and conversion rate. I also added the checked swing percentage to the top five hitters in conversion rate to show how often they check their swing.
| Player | ChSw% |
| Daniel Schneemann | 7.6% |
| Matt Shaw | 6.9% |
| Victor Scott II | 6.9% |
| Jake Meyers | 6.5% |
| J.D. Martinez | 6.3% |
| Player | Conversion Rate | ChSw% |
| Jean Segura | 90% | 1.8% |
| Addison Barger | 85% | 2.6% |
| Daylen Lile | 79% | 3.1% |
| Whit Merrifield | 79% | 2.0% |
| Elvis Andrus | 78% | 5.0% |
Are Checked Swings Random?
Are checked swings a repeatable individual trait, or a random byproduct of circumstance like opposing pitcher, pitch type, and count? If a hitter checked their swing a lot in 2023, could we expect them to do the same in 2024? To test this, I ran year-to-year stability regressions for 2023-2024 and 2024-2025. Similar to Alex’s article, I used checked swing percentage (ChSw%), failed checked swings (sChSw%), and Conversion Rate. Alex used checked swings on balls, looking at them from a pitcher’s perspective. I switched this to checked swings on strikes because, from a hitter’s perspective, a strike is the unsuccessful outcome.
Year-to-year R-squared results:
| Metric | 2023 ~ 2024 R^2 | 2024 ~ 2025 R^2 |
| ChSw% | 0.61 | 0.65 |
| sChSw% | 0.46 | 0.41 |
| Conversion Rate | 0.18 | 0.21 |
Compared to the pitcher side, each R-squared value is larger, suggesting hitters are more consistent in their checked-swing tendencies than pitchers. Similar to what Alex found, the conversion rate is the least stable. Whether the hitter is successful or not in checking their swing is much more volatile than the attempt to check the swing. It also appears that overall checked swing rate is more consistent than behavior on balls inside or outside the zone in particular.
What Drives Checked Swing Behavior?
I wanted to see how a player’s overall plate discipline relates to their tendency to check a swing. How often hitters swing at pitches inside and outside the zone ( Z-Swing%, O-Swing%) as well as how often they make contact on pitches inside and outside the zone (Z-Contact%, O-Contact%, ) were used to predict each of the following check swing metrics in a multiple regression analysis. Rather than listing the individual coefficients, I’m just listing whether the relationship was significant, and if so, in what direction.
Regression coefficients: Check Swing %
| R-squared | 0.13 |
| O-Swing% | Negative, significant |
| Z-Swing% | Positive, significant |
| O-Contact% | Negative, significant |
| Z-Contact% | Not significant |
Regression coefficients: Out-of-Zone Check Swing %
| R-squared | 0.15 |
| O-Swing% | Not significant |
| Z-Swing% | Positive, significant |
| O-Contact% | Negative, significant |
| Z-Contact% | Not significant |
Regression coefficients: Successful Check Swing %
| R-squared | 0.10 |
| O-Swing% | Negative, significant |
| Z-Swing% | Positive, significant |
| O-Contact% | Negative, significant |
| Z-Contact% | Not significant |
Regression coefficients: Failed Check Swing %
| R-squared | 0.18 |
| O-Swing% | Not significant |
| Z-Swing% | Not significant |
| O-Contact% | Negative, significant |
| Z-Contact% | Not significant |
Looking at the tables above, O-Swing% and Z-Swing% are significant predictors across ChSw%, oChSw%, and bChSw%, but they drop out entirely for sChSw% (failed attempts). This pattern reveals that a checked swing is two different behaviors: the decision to attempt one and the ability to hold up successfully.
Swing decisions (O-Swing% and Z-Swing%) predict whether a hitter will attempt to check their swing, but they are not significant predictors of failed attempts, suggesting the decision to attempt a checked swing and the ability to execute it are driven by different underlying factors. The R^2 values are modest and range from .10 to .18, meaning that these variables explain only 10-18% of the variance in checked swing behavior. The majority of what drives checked swing behavior remains unexplained.
Offensive Value
In addition to asking what drives checked swings, I wanted to know if checked swing tendencies could tell us anything about a hitter’s offensive value. I used the same four plate discipline metrics (O-Swing%, Z-Swing%, O-Contact%, and Z-Contact%) to predict both strikeout percentage and wOBA, then each checked swing metric was individually factored in to see if it added any predictive value.
K%
The baseline R^2 value for strikeout percentage was 0.8857, meaning the standard plate discipline metrics account for nearly all of the variation in how often a hitter strikes out. Adding bChSw% (checked swings on pitches outside the zone ruled balls) improved the R^2 to 0.8874 and was statistically significant, but the overall improvement was very small.
wOBA
The baseline R^2 value for wOBA was 0.114. The four plate discipline metrics explain offensive value much less than they do strikeout percentage, leaving more room for checked swing metrics to add value. Here is a table showing the impact of adding each checked swing metric individually:
| Metric | R^2 | p-value |
| Baseline | 0.114 | |
| ChSw% | 0.1469 | 0.000259 |
| oChSw% | 0.1471 | 0.000247 |
| bChSw% | 0.1356 | 0.00315 |
| sChSw% | 0.1352 | 0.0035 |
| Conversion Rate | 0.1154 | 0.465 (not significant) |
Aside from Conversion Rate, each checked swing metric improved the R^2 value by a meaningful amount and was statistically significant. Each statistically significant checked swing metric had a negative coefficient, which suggests that hitters who check their swing more are associated with lower offensive value, independent of a hitter’s swing decisions and contact skills.
Conclusion
Checked swings are a real, repeatable tendency split into two separate, distinct behaviors: the decision to attempt a checked swing and the ability to successfully hold up. Checked swing behavior is associated with lower offensive value, independent of a hitter’s swing decisions and contact ability.
Hitters who check their swing more frequently tend to produce less offensive value, though this relationship is likely reflective of a hitter’s profile rather than a direct causal link. Checked swing rates represent an additional measure of plate discipline not fully captured by traditional metrics.
Checked swings were not broken down by pitch type, count, opposing pitcher, or game situation; these or other variables could meaningfully change the relationship found here. But the stage has been set for further research into the potential value of checked swings from both a hitter’s and a pitcher’s perspective.