Sports Info Solutions
Month: December 2019
-
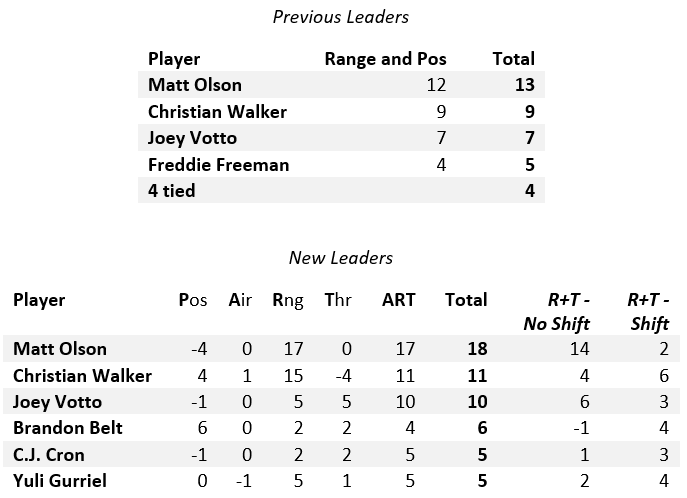
Updated 2019 Infield DRS Leaders Using the PART System
By
Adjustments to our method of evaluation produced some very interesting results.
-
Stat of the Week: Walker, Rolen, Abreu & Hall of Fame Worthiness
By
By Mark Simon This year’s BBWAA Hall of Fame ballot is headlined by Yankees shortstop Derek Jeter and understandably so, given his excellence in both the regular season and postseason, and his longevity. Jeter is a lock for election, perhaps even joining Mariano Rivera in receiving unanimous support. In the 2019 Bill James Handbook, Bill…
-
Top Prop Odds in Bears vs. Cowboys
By
By Steve Schwartz Dallas and Chicago face off Thursday night with identical 6-6 records. However, while the Cowboys lead their division, the Bears are three games behind the Packers and realistically a long shot for any NFC playoff spot down two games to division rival Minnesota. The following props are evaluated using SISBets.com (registered users get 10…
-
Why Elgton Jenkins should be considered for Offensive Rookie of the Year
By
Jenkins has been instrumental in Green Bay’s success this season.
-
Some midseason updates to the Total Points calculation
By
By Alex Vigderman Over the course of the year, we occasionally find certain plays or players that highlight something that isn’t quite right in the Total Points System. Also, because there are so many data points to comb through, we sometimes wait a bit to include something because we aren’t sure what to do with…