Baseball isn’t supposed to be as easy as it was for Aaron Judge and Nick Kurtz in 2025. Judge had an OPS of 1.144. Kurtz finished at 1.002. They won the AL MVP and Rookie of the Year, respectively.
For players to put up those kinds of numbers, they need to be great hitters, but they need some things to go their way too.
By our measures, they did.
Sports Info Solutions tracks its own version of a player’s expected stats (similar to what you can find on Baseball Savant). Rather than basing a player’s hit probability (and subsequently single, double, triple, and home run probability) on a batted ball’s exit velocity and launch angle, SIS’ version estimates probabilities based on where balls are hit, how hard they are hit, how long they spend in the air, and the speed of the batter, as well as the ballpark in which the ball was hit. Important to note: defensive positioning is NOT taken into account.
This allows us to compare a player’s actual stats to his expected stats.
Kurtz had an expected OPS of .877, which is terrific. But it’s not as otherworldly as 1.002. The 125-point gap between his actual OPS and expected OPS is the biggest such differential in MLB.
Judge’s gap was 96 points. His expected OPS was still otherworldly at 1.048.
There can be a few reasons why a player exceeds his expected OPS. Defenses had -13 Runs Saved on balls hit by Judge (-6 for Kurtz) which certainly helped him out when he wasn’t hitting balls out of the ballpark. Kurtz also had 22 of his 36 home runs at home in hitter-friendly Sutter Health Park, which helped his final stat line.
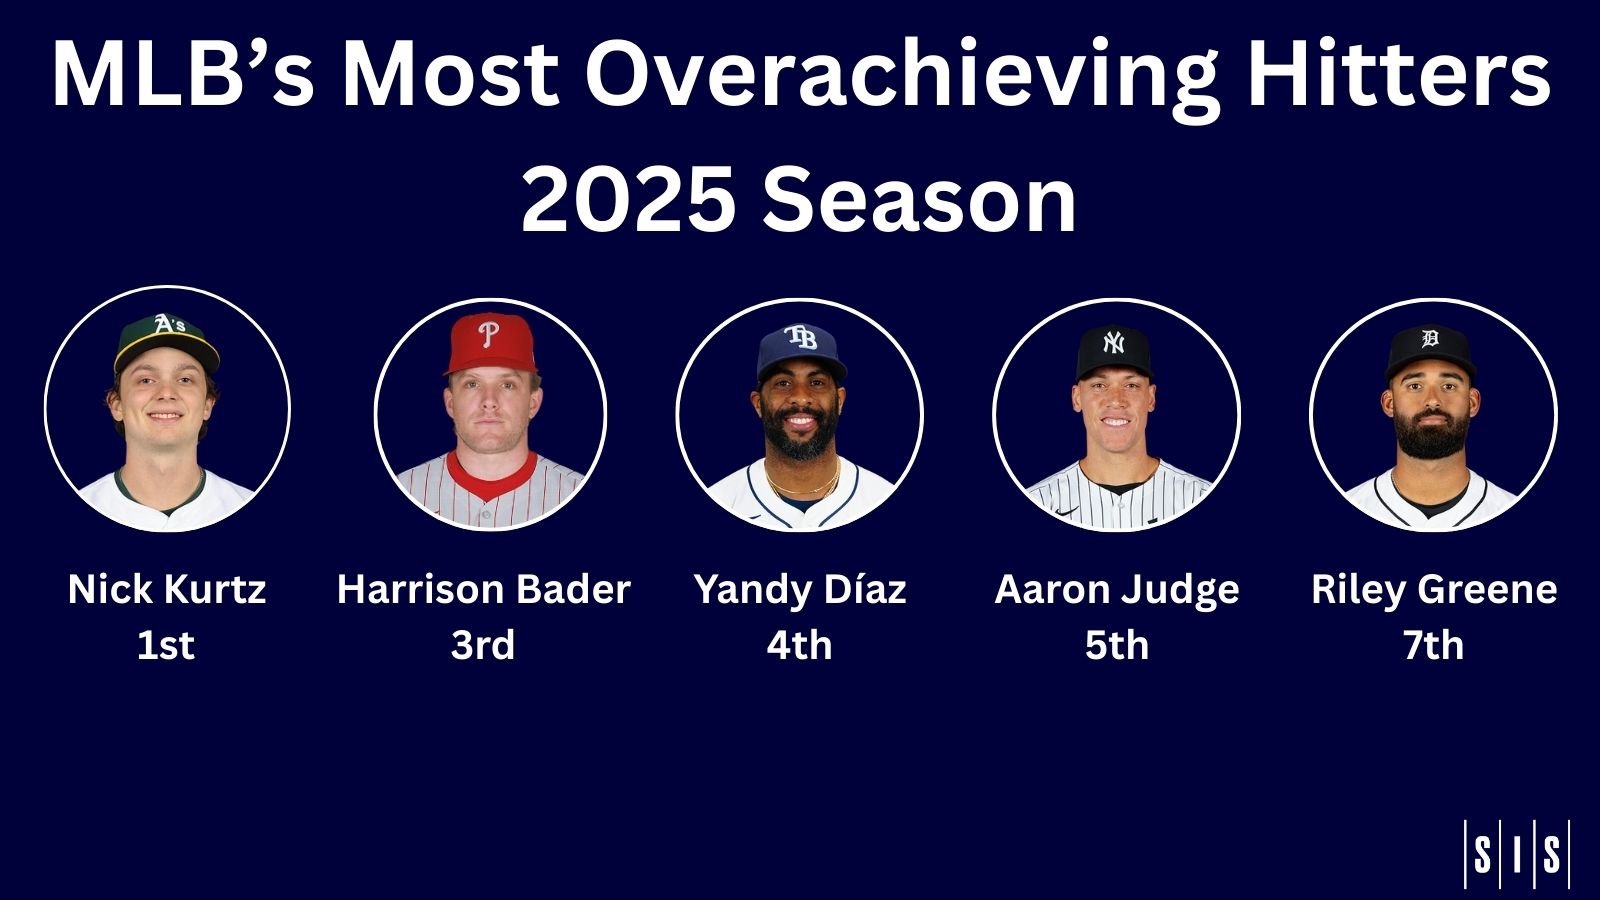
Here’s a list of the 10 players whose OPS was most above their expected OPS, among those with a minimum of 300 plate appearances.
Biggest Differential, OPS and Expected OPS, 2025 Season
Minimum 300 Plate Appearances
|
Player |
2025 OPS |
Expected OPS |
Differential |
|
Nick Kurtz |
1.002 |
.877 |
-.125 |
|
Miguel Andujar |
.822 |
.699 |
-.123 |
|
Harrison Bader |
.796 |
.678 |
-.118 |
|
Yandy Díaz |
.848 |
.739 |
-.109 |
|
Aaron Judge |
1.144 |
1.048 |
-.096 |
|
Jake Mangum |
.698 |
.604 |
-.094 |
|
Riley Greene |
.806 |
.717 |
-.089 |
|
Jonathan Aranda |
.883 |
.794 |
-.089 |
|
Jordan Westburg |
.770 |
.684 |
-.086 |
|
Isaac Paredes |
.809 |
.725 |
-.084 |
Kurtz and Judge were still superstars by their expected OPS numbers. But that’s not the case for the others on this list. There are a handful of players who – if they had hit at their expected numbers rather than their actual ones – would have had a season perceived differently than their season was.
Miguel Andujar has a little bit of a smaller sample than others (321 at-bats) got hot at the end of the season with the Reds and finished the season with an .822 OPS. The perception of his season would have been completely different had he hit his expected OPS of .699.
Andujar had 23 hits on balls with an expected hit probability below 30%. Those balls should have netted him 5 hits. Instead, they resulted in 23.
Harrison Bader is another good example. Bader finished with an OPS close to .800 but an expected OPS of .678. The .678 was more in line with his 2022, 2023, and 2024 actual OPS.
Bader got particularly hot after being traded from the Twins to the Phillies. He hit .305 in 50 games with the Phillies but had 9 hits more than his expected total (54 instead of 45), which bumped his batting average with them up by 51 points. A bunch of infield hits (examples here, here, and here) were key to that.
Another example of a different nature is Rays DH and first baseman Yandy Díaz, who had 21 hits more than his expected total (no one had more than him and Bader). The actual versus expected OPS differential for Díaz was 109 points, primarily because Díaz hit 25 home runs but had an expected total of only 17.
Of those 25 home runs 18 came in Steinbrenner Field. Díaz took full advantage of right field there with several of his home runs clearing the wall by only a little bit (examples here, here, and here).
Looking back to last year’s list of overachievers, 8 of the 10 had an actual OPS decline from 2024 to 2025 of at least 118 points. Notable names whose performance dipped significantly in 2025 included Connor Wong, Tyler O’Neill, Jose Iglesias, and Carlos Correa.
|
Player |
2024 OPS |
2025 OPS |
|
Connor Wong |
.758 |
.500 |
|
Tyler O’Neill |
.847 |
.684 |
|
Jose Iglesias |
.830 |
.592 |
|
Carlos Correa |
.905 |
.734 |
Bryce Harper and Bobby Witt Jr., superstars similar to Kurtz and Judge, were also in that Top 10 list of 2024 overachievers. Their 2025 numbers didn’t match their 2024 ones but they were still superstars even with the drop in OPS.
Caveats apply when considering any future ramifications here. Just because the players on this list could have been worse in 2025 doesn’t necessarily mean that they will be worse in 2026. There are no guarantees in baseball. The wonder of who will overachieve and who will underachieve is one of the things that keeps us watching.