You had to figure that when we released our list of the pitchers that overperformed their expected numbers the most in 2025 that Trevor Rogers would be on it.
In 18 starts, the Orioles lefty pitched to a 1.81 ERA and allowed 70 hits in 109 2/3 innings. He did that while striking out less than a batter per inning and with a hard-hit rate that ranked in the 3rd percentile (48%). And his home runs per 9 innings rate was about half his previous career rate.
Rogers’ expected OPS allowed was .503, the third-lowest by any pitcher in the last 10 seasons (minimum 100 innings). His expected OPS allowed was .634.
The 131-point differential between his expected (.634) and allowed (.503) was by far the largest in MLB in 2025 (minimum 400 batters faced, a pool of 135 pitchers).
A brief point of explanation:
Sports Info Solutions tracks its own version of a player’s expected stats (similar to what you can find on Baseball Savant). Rather than basing a player’s hit probability (and therefore single, double, triple, and home run probability) on a batted ball’s exit velocity and launch angle, SIS’ version estimates probabilities based on where balls are hit, how hard they are hit, and how long they spend in the air.
This allows us to compare a player’s actual stats to his expected stats to see if they fared better or worse than perhaps they could have.
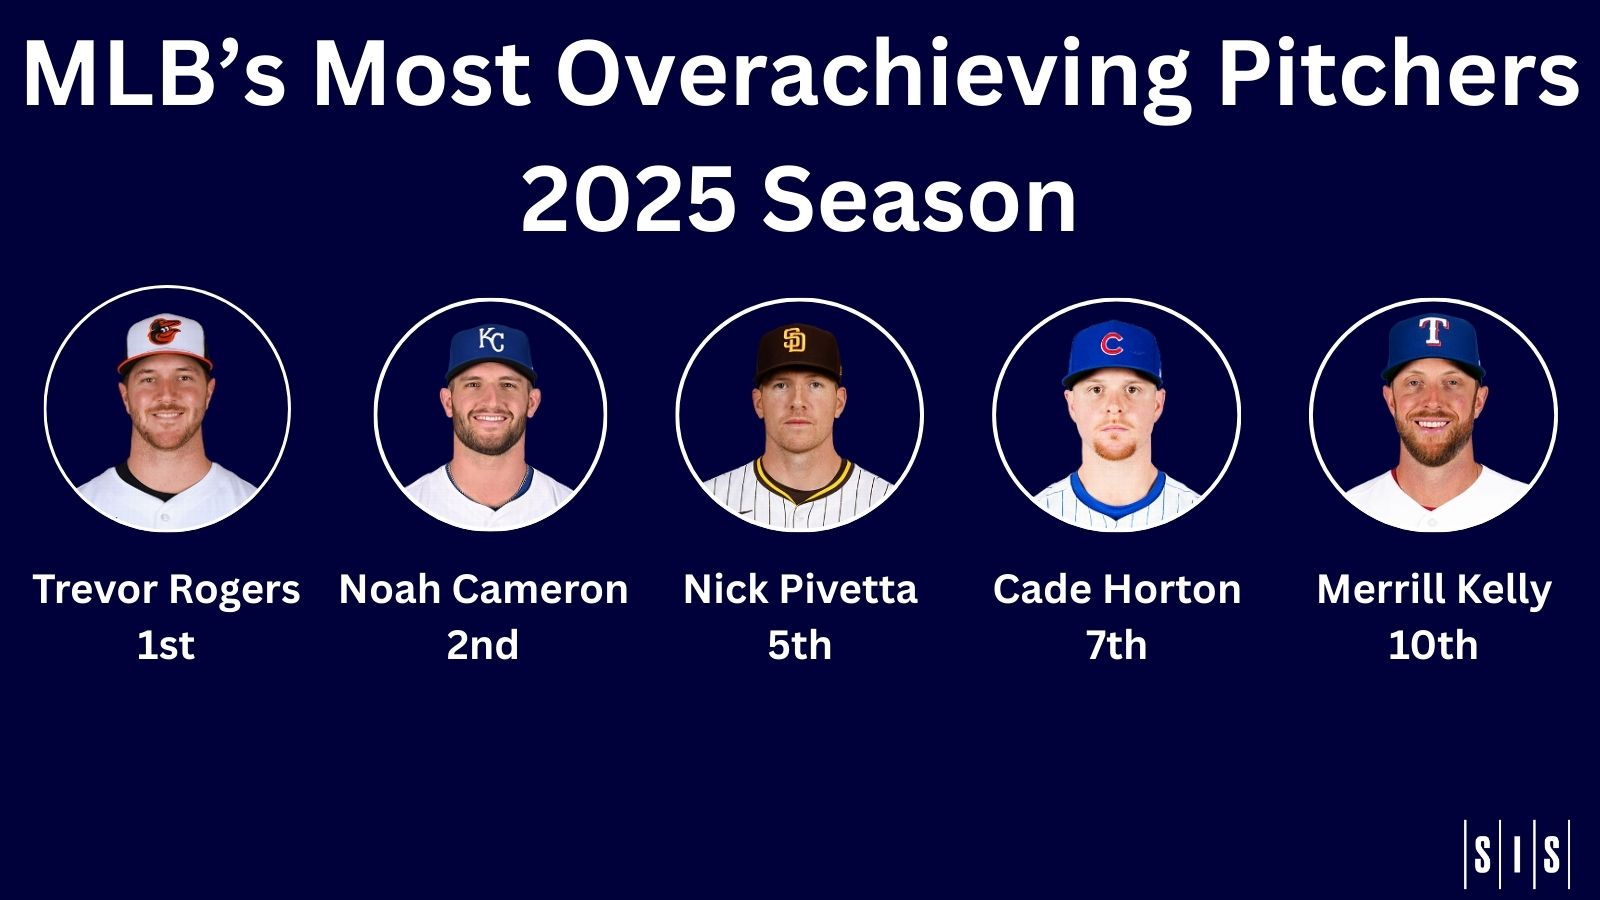
Here’s the list of pitchers with the greatest differential between their expected OPS and their actual OPS. Think of them as a group whose actual 2025 numbers could have been worse under different circumstances.
Biggest Differential – Expected OPS and Actual OPS
2025 Season (Minimum 400 Batters Faced)
|
Pitcher |
Expected OPS Allowed |
OPS Allowed |
Differential |
|
Trevor Rogers |
.634 |
.503 |
.131 |
|
Noah Cameron |
.729 |
.641 |
.087 |
|
Spencer Schwellenbach |
.702 |
.618 |
.084 |
|
Janson Junk |
.767 |
.686 |
.081 |
|
Nick Pivetta |
.663 |
.583 |
.080 |
|
Jose Quintana |
.776 |
.698 |
.078 |
|
Cade Horton |
.692 |
.615 |
.077 |
|
Mitchell Parker |
.873 |
.797 |
.076 |
|
Grant Holmes |
.789 |
.715 |
.074 |
|
Merrill Kelly |
.734 |
.661 |
.073 |
To be clear, a .634 expected OPS is still excellent. It’s just not as great as his actual numbers. Rogers had the lowest actual OPS allowed among these 135 pitchers. He had the 17th-lowest expected OPS. His expected runs allowed of 39 (using Bill James’ Runs Created) would have given him an ERA likely in the low 3s instead of his season-ending 1.81.
With the second pitcher on this list, Royals rookie Noah Cameron, his ERA-FIP differential (2.99 vs 4.18) also gives us a sense that he overperformed in 2025. His actual OPS was 87 points lower than his expected OPS and for where Cameron was, that’s a big difference.
A .641 OPS allowed ranked 25th overall, meaning he was in the top 20% of our pool of pitchers.
A .729 expected OPS allowed ranks 78th, which puts him outside the top half of that group, which makes sense given what his FIP was. He goes from being considered a pretty good pitcher to a below-average one.
Other pitchers in this top 10, such as Spencer Schwellenbach and Cade Horton, experience dips too, though not as extreme as Cameron’s. Schwellenbach goes from 19th-lowest OPS to 48th-lowest expected OPS allowed. Horton goes from 16th to 37th.
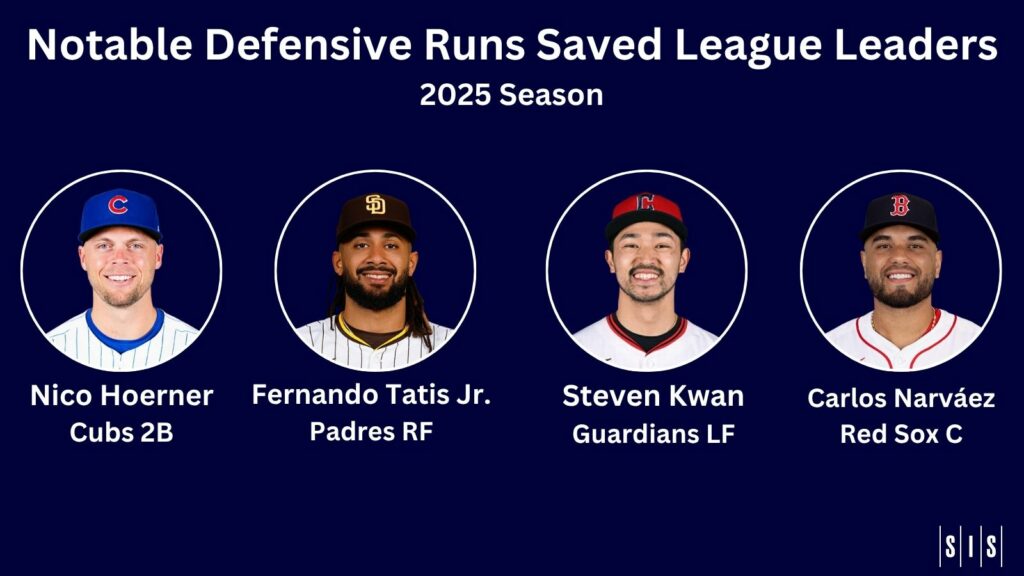
Free agent Merrill Kelly actually made our Top 10 list for the second straight season. He’s had an OPS at least 50 points lower than his expected OPS four times in the last six seasons (excluding 2020). Kelly has typically gotten very good defensive support behind him. The Diamondbacks and Rangers have 32 Runs Saved behind him in the last four seasons, 6th-most in MLB.
We can trace the success of many of the pitchers on the list above to the work that defenses did behind them. The Braves had 12 runs saved behind Schwellenbach (5 of those attributable to Schwellenbach, himself) and 11 Runs Saved for Grant Holmes. The Royals had 10 Runs Saved for Cameron. The Brewers had 10 for Jose Quintana.
This article was meant to focus on starting pitchers, but if we lower the qualifier to 250 batters faced to include relievers, the three relievers with the largest differentials were Pirates closer Dennis Santana (expected OPS 122 points higher than actual OPS), Phillies reliever Tanner Banks (103), recent Braves signee Robert Suarez (100), and free agent Shawn Armstrong (100). Suarez had gotten great defensive support from the Padres throughout his career, including 5 Runs Saved (a high total for a reliever) in 2025.
On last year’s list, 7 of the 9 pitchers listed among our biggest overachievers had their ERA increase from 2024 to 2025, 6 by more than a full run (one didn’t pitch, Derek Law). Kelly and Kevin Gausman were the only ones whose ERAs improved. Among those with big ERA increases were David Peterson, Tyler Holton, and Bowden Francis.
That’s not to say what will happen in 2026, but it gives you an indication of some pitchers to keep an eye on heading into next year.