Sports Info Solutions
Author: Chris Lee
-
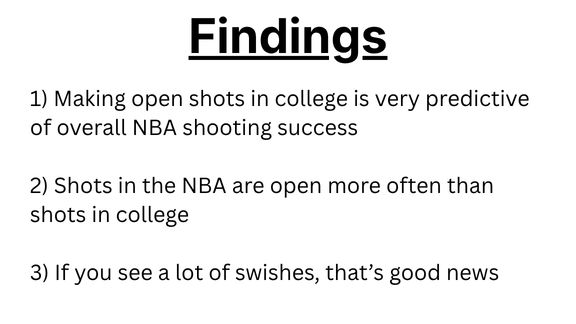
Study: Evaluating Predictiveness of SIS Shots Data
By
We put our highly detailed data set to use evaluating shooting in college and the NBA.
-
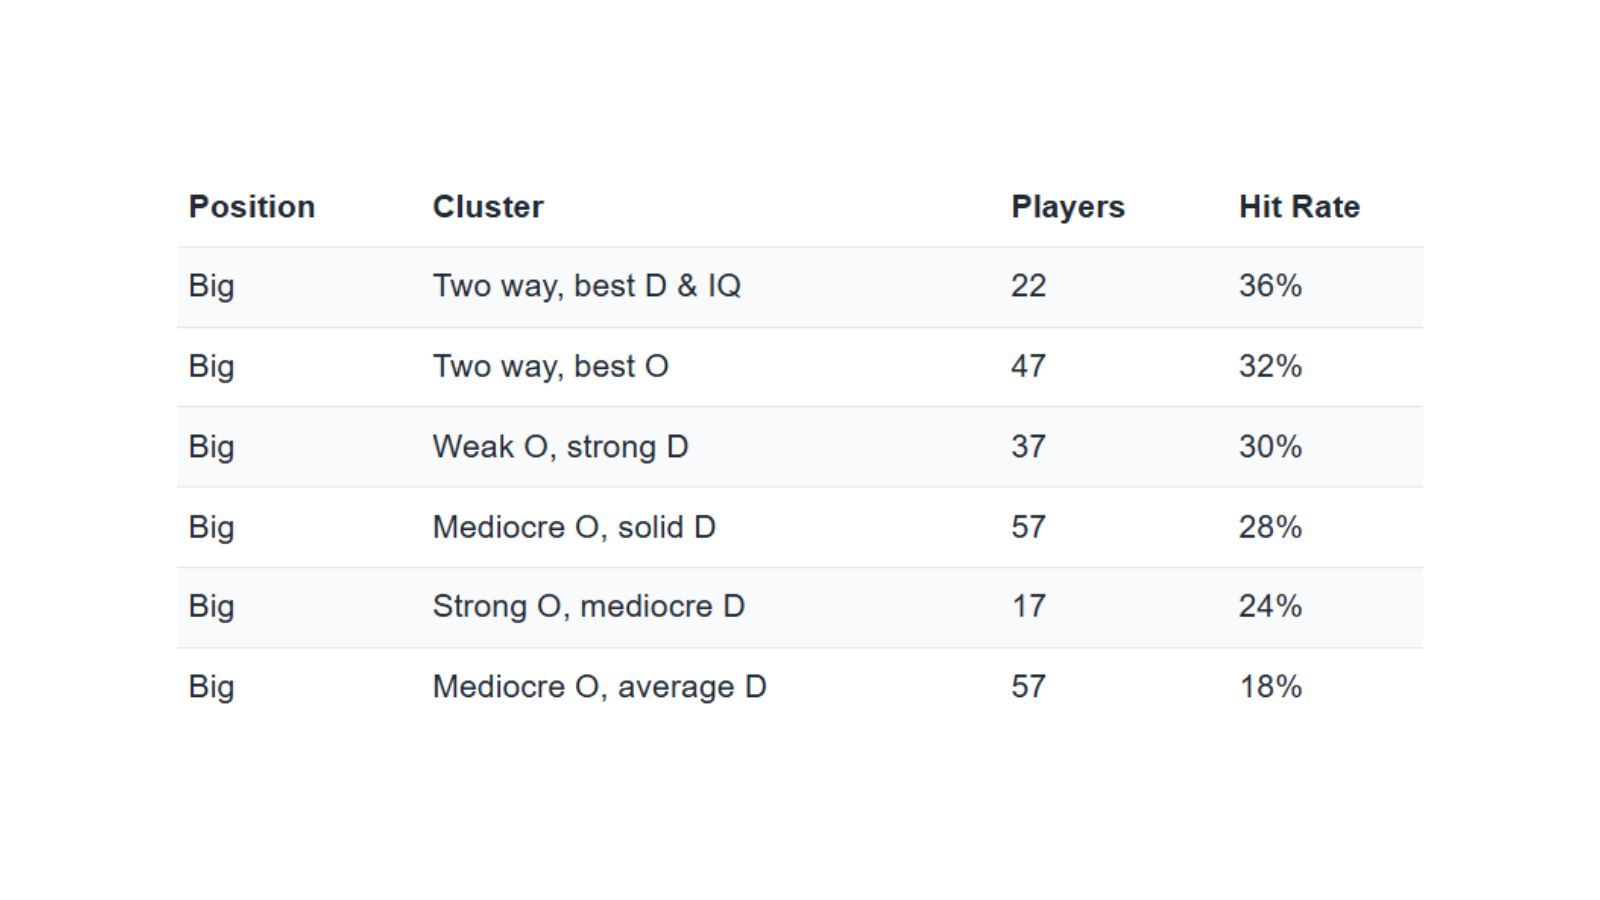
Study: Clustering Pre-Draft Profiles to Predict NBA Success
By
A look at which types of players have the highest hit rate for NBA success.
-
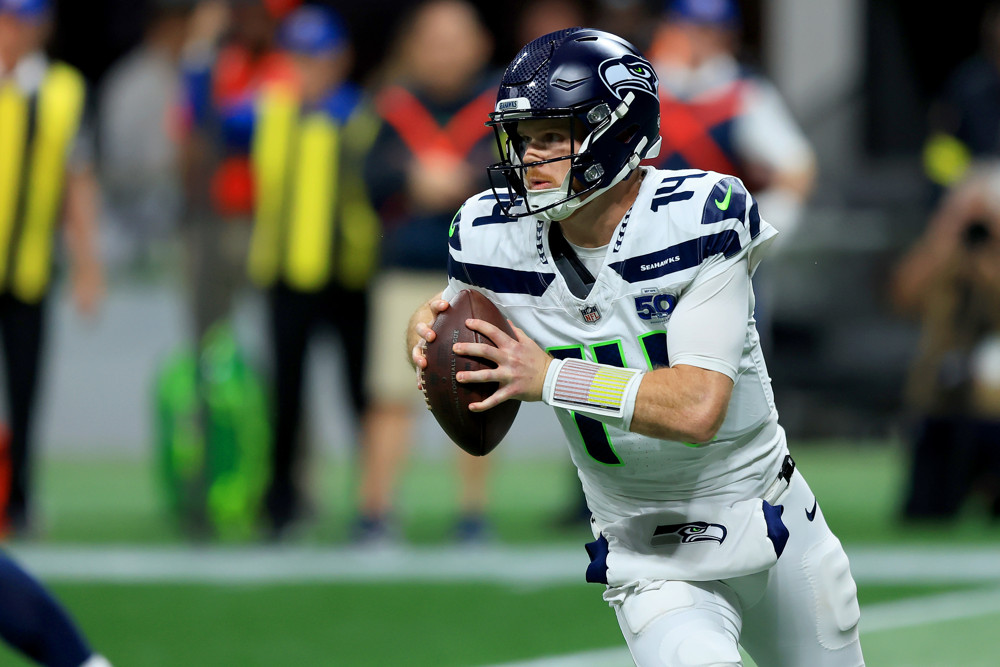
Optimistic and Pessimistic Takeaways for the Seahawks and Rams After Week 16
By
The Seahawks came away with the win in a pivotal division game, but the Rams might have fewer questions to answer heading into the playoffs.
-
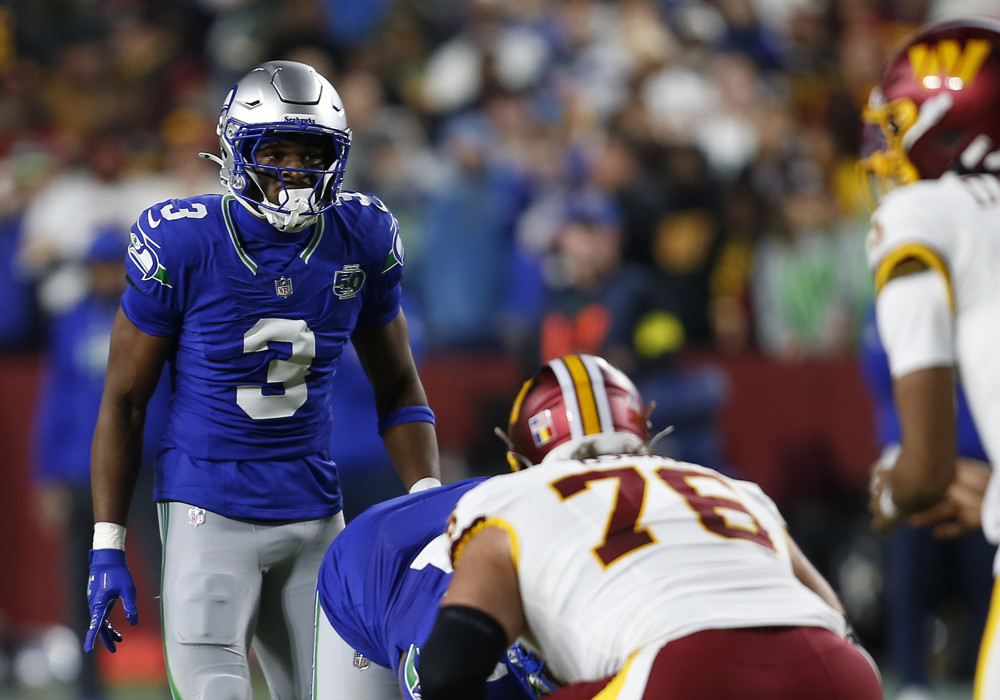
The Seahawks Are Down, But Their Defense Has Shown They’re Not Out
By
What the game against the Rams tells us about the Seahawks from a big picture perspective
-
Introducing Our Multi-Year Injury Risk Model
By
It projects which players are likely to miss the most time and also evaluates which factors are most important in projecting whether a player gets injured
-
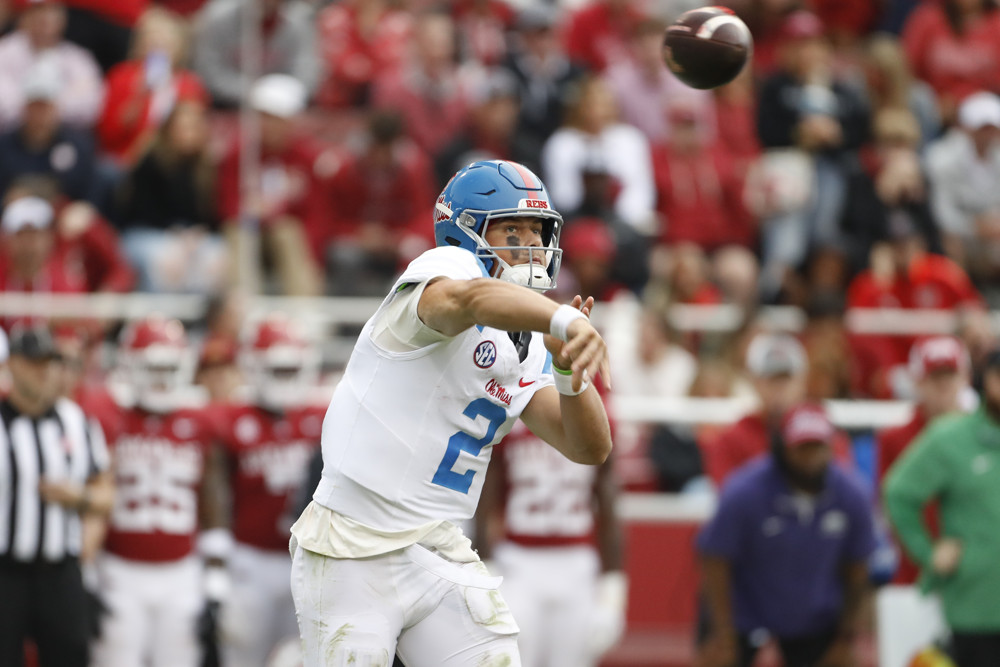
Evaluating How A Quarterback’s College Accuracy Projects To The NFL
By
Accuracy on intermediate throws had the strongest correlation with a quarterback’s overall performance when compared to deep or short passes. We share the details.