Sports Info Solutions
Author: alecjdopp
-
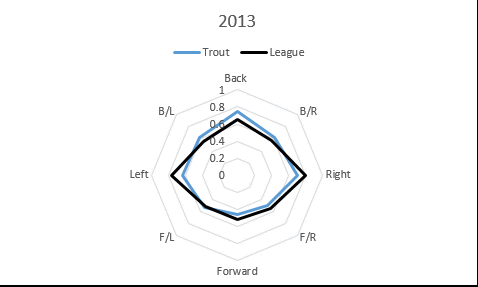
How has Mike Trout’s Glove Declined?
By
“Five-tool player” is a term that gets thrown around in baseball circles a bit more than it probably should these days, but one player we can unequivocally agree who fits that mold is the man patrolling center for the Angels most nights: Mike Trout. The 24-year-old comfortably leads baseball with 42.5 Wins Above Replacement according to FanGraphs (fWAR) since 2012.…
-

Quantifying 2016’s Most Dominant Pitches
By
What makes a dominant pitch dominant? Sometimes all we need is the eye test. That upper-90s heater elevated above the letters for a whiff? Yep, that is dominant. That mid-80s slider thrown down and away to a right-handed batter for a hapless swing and equally hapless chopper? No doubt, that’s nasty. Perhaps that late-breaking cutter, fading changeup, hammer…
-

Starting Pitcher Command Report: April 2016
By
Major League Baseball officially flipped its calendar from April to May this past weekend, which means we’ve arrived at a juncture of the season—roughly 15 percent through 2015’s total plate appearances, if you want to get overly specific—where player performance, trends and adjustments can be dissected with a certain amount of legitimacy and conviction. So…