Sports Info Solutions
Author: Alex Vigderman
-
Stat of the Week: 10 Seasons Of Strike Zone Runs Saved Part II
By
Last week we looked back at 10 seasons of data for our pitch-framing stat, Strike Zone Runs Saved, which puts a run value on the result of taken pitches, and we looked at which catchers have fared best and worst in those measurements. One of the neat things about Strike Zone Runs Saved (SZRS) is…
-
Analyzing Ashton Jeanty’s Eye-Popping & Head-Scratching Stats
By
“I’m here to offer just a little dab, a splash, of cold water based on how others with his rushing profile have performed at the next level.”
-
Stat of the Week: The Last 10 Years of Strike Zone Runs Saved
By
How far has pitch framing come and who have the best catchers been?
-
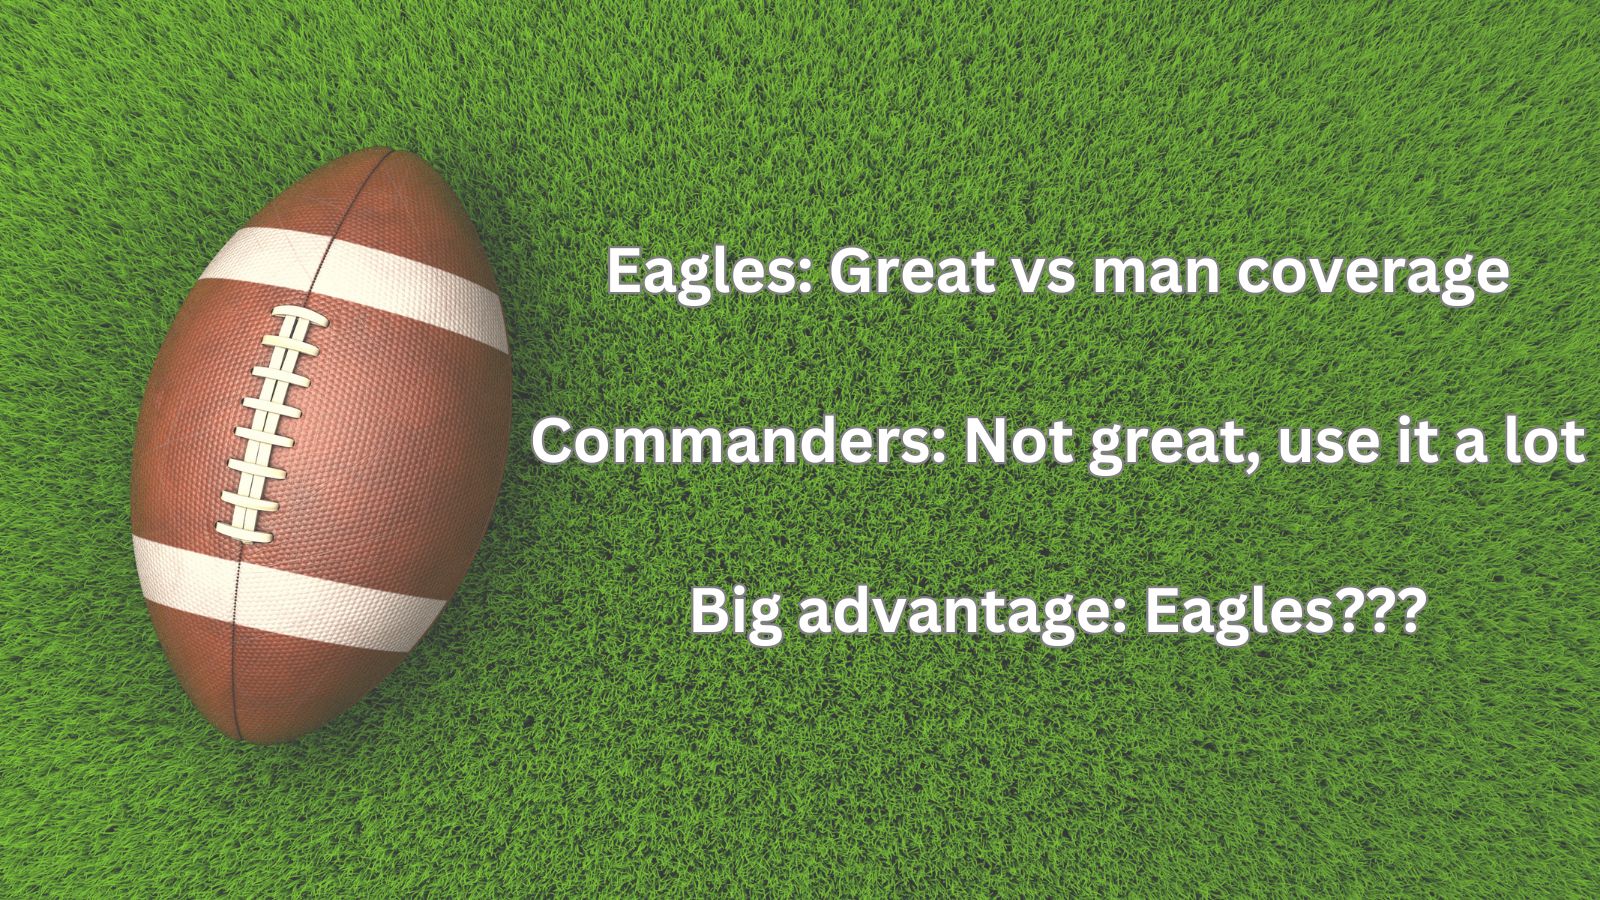
What Two Statistical Mismatches Tell Us About Football Analysis
By
The Eagles offense has some big advantages over the Commanders defense. But in the greater picture, do mismatches like this mean anything?
-
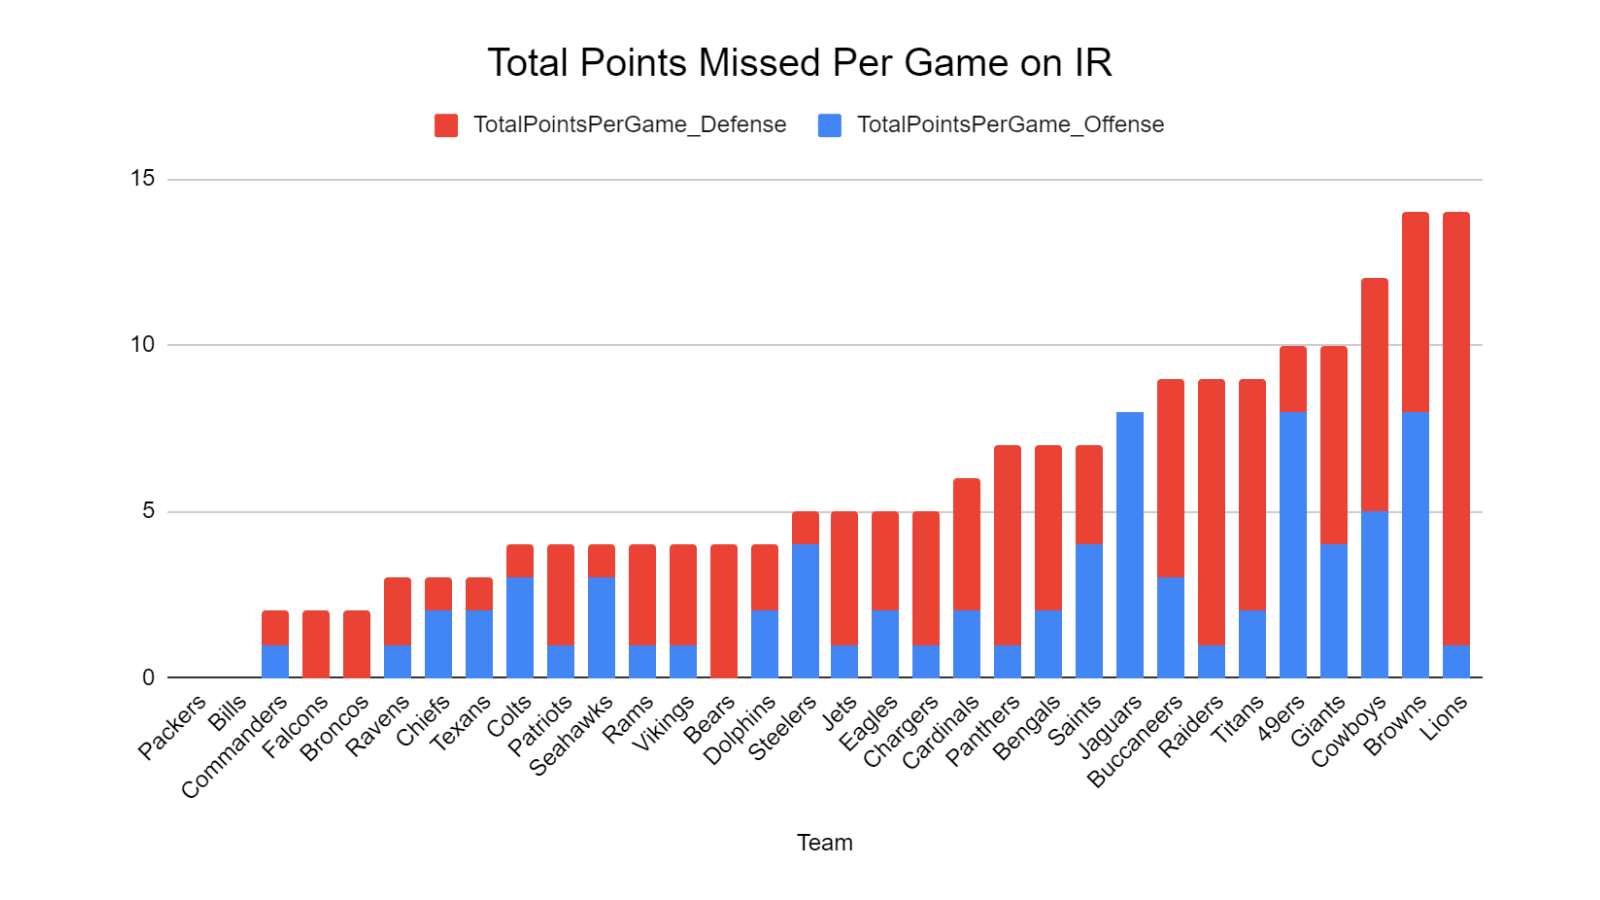
Which NFL Teams Have Been Most and Least Impacted By Injuries?
By
Of the teams LEAST impacted by injuries, 9 of the top 10 in our ranking are in playoff contention, but what about those most impacted?
-
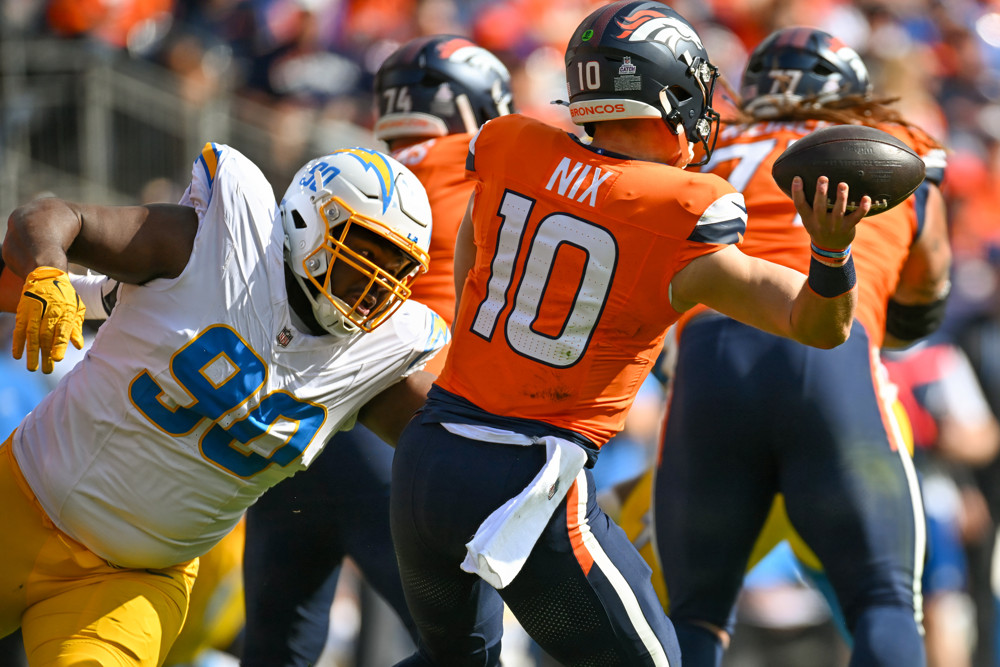
Should Bo Nix be in the Rookie of the Year conversation?
By
The surface-level stats don’t make you think he should. But consider the team context in which he’s operating.
-
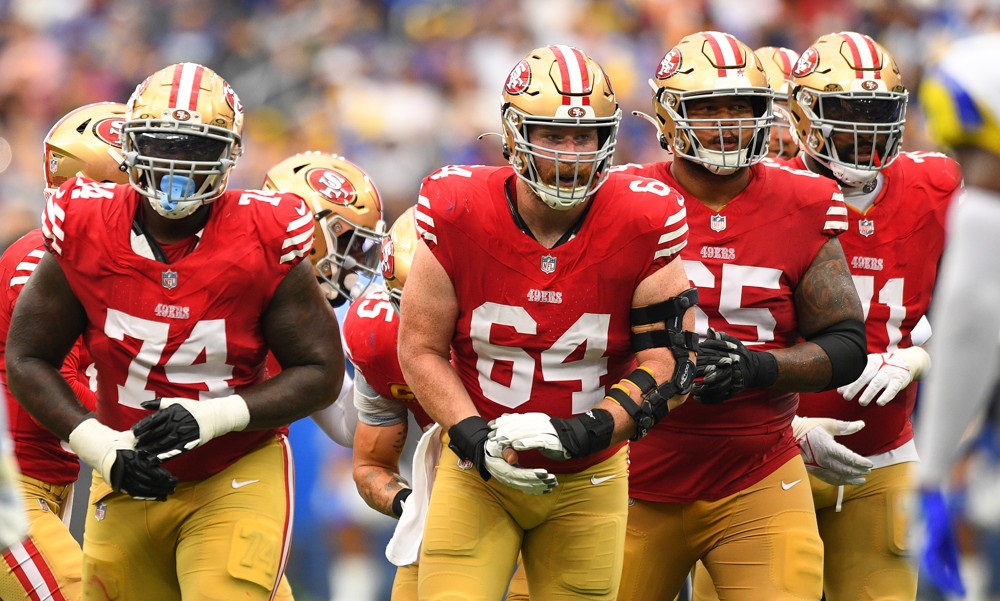
Study: Does Offensive Line Continuity Drive Better Performance?
By
Does time together drives better performance, or is it more that you just have good players and want to keep them on the field as much as you can?
-
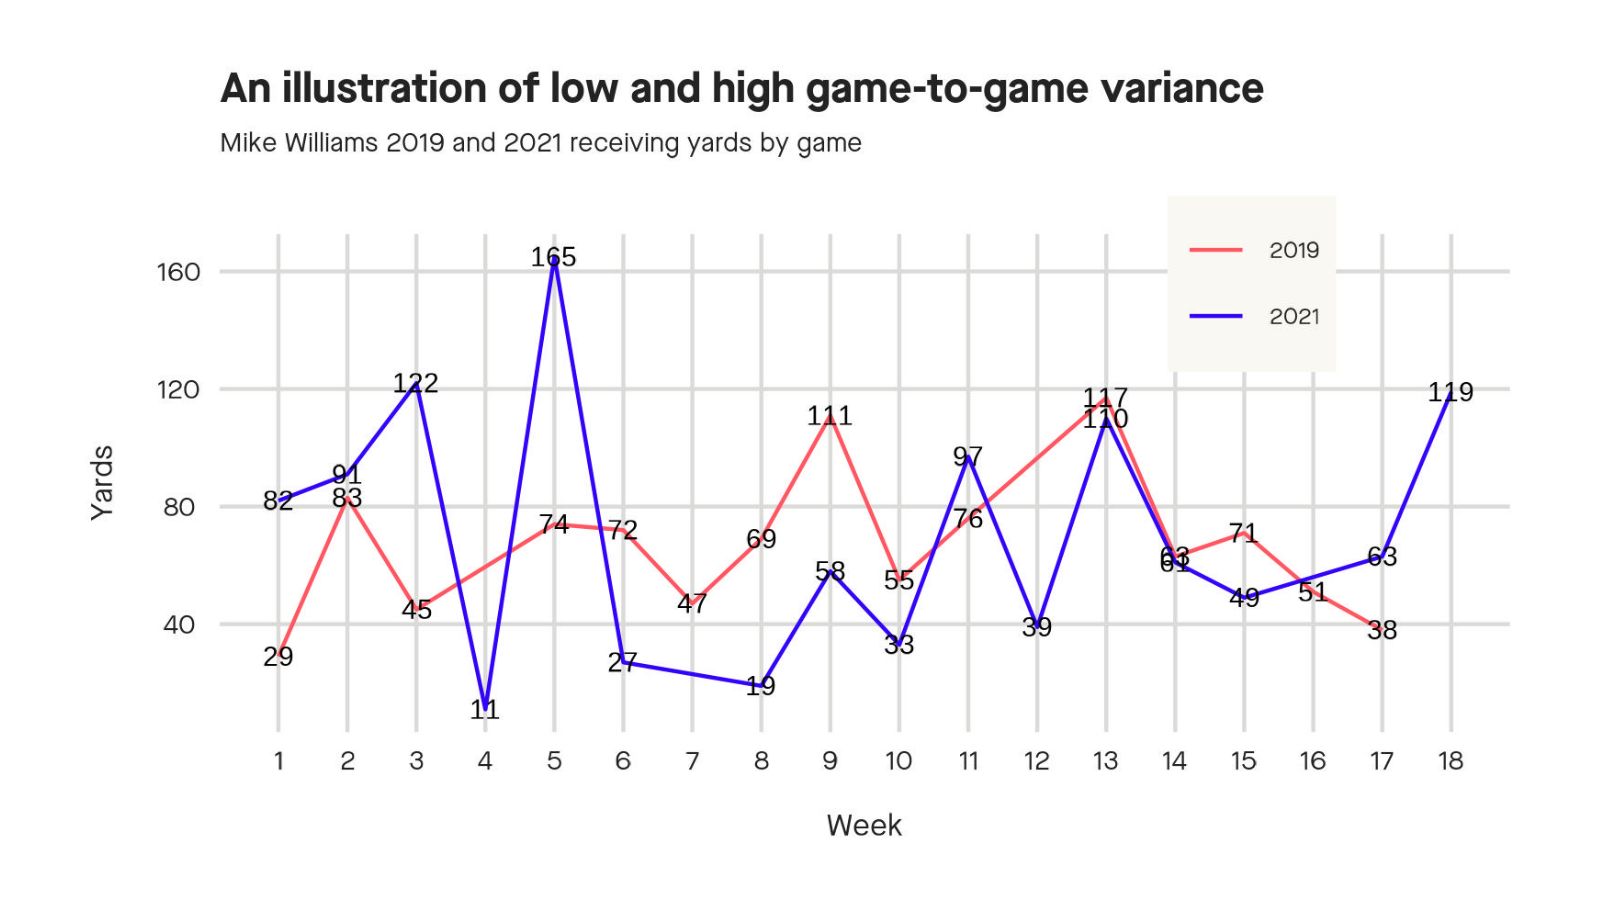
Study: Is Consistency Desirable in Football?
By
We wanted to take a look at whether there was a tangible on-field benefit to consistency. Are consistent players better than inconsistent ones?
-
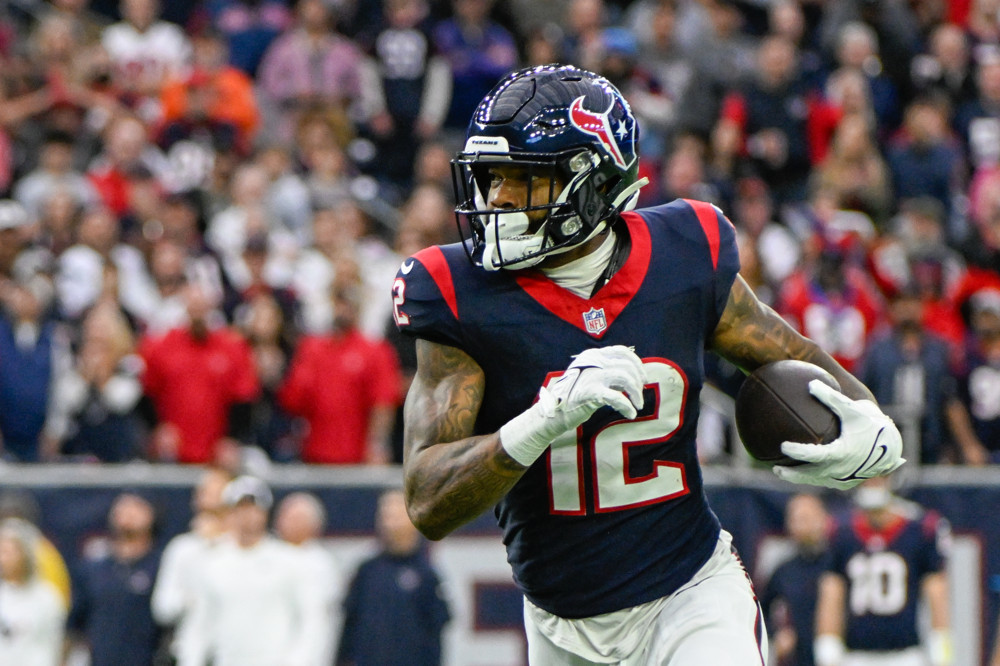
Using Accuracy and Openness to Provide Context for Receiver Play
By
Introducing our version of Receiving Yards Plus-Minus, something at which Nico Collins excelled last season.
-
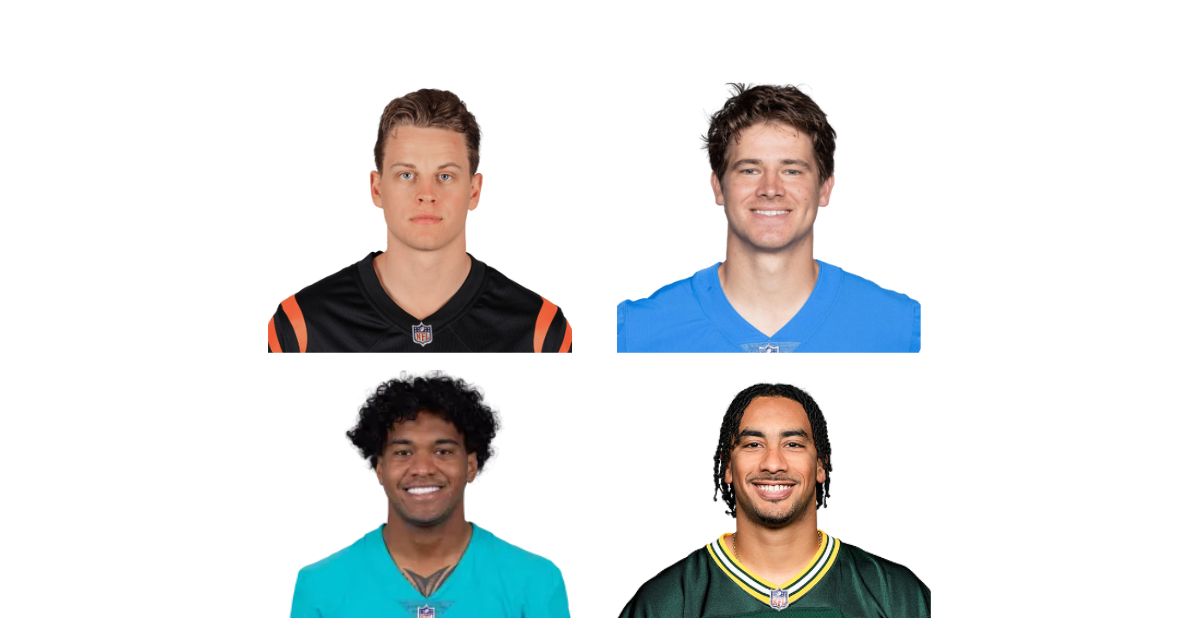
Which Quarterback Does Total Points Prefer Among the 2020 NFL Draft Class?
By
Joe Burrow, Tua Tagovailoa, Justin Herbert, and Jordan Love have each been given championship-caliber money, but who is providing the most value?