Author: Alex Vigderman

  • Updated 2019 Infield DRS Leaders Using the PART System

    Updated 2019 Infield DRS Leaders Using the PART System

    By Alex Vigderman

    It’s a big day for us at Sports Info Solutions. As of today, we have a new-and-improved version of our flagship statistic, Defensive Runs Saved, available to the public via FieldingBible.com.

    Previously, infielder DRS (specifically the Range and Positioning portion of DRS) used just the information about the ball in play to determine its likelihood of being turned into an out. That meant that we didn’t have the granularity to tell whether a play was made because the fielder went above and beyond or he was just positioned well.

    In essence, the calculation of Range and Positioning Runs Saved boils down to this single question: how well did the fielder do in completing the play given how often similar batted balls are turned into outs?

    A few years ago SIS started tracking infielder starting positions on balls in play, which we’ve collected back to 2013. That allows us to evaluate each infield play (groundball or short line drive) at multiple points in time, so instead of just answering the one question above, we can now answer three questions about a play:

    • Positioning: How much does the expected out rate change once we know how each fielder was positioned?
    • Range: How much does the expected out rate change between when the ball was hit and when the fielder gets to the ball (or fails to), given that we know where everyone started?
    • Throwing: How well did the fielder do in completing the play given where he fielded the ball, how hard the ball was hit, and the speed of the runner?

    Bundle those components with the evaluation of infield air balls and you get the PART System, which serves as the replacement for the Range and Positioning System for infielders.

    We’re really excited to bring all of this work out into the open.  After all, we’ve been collecting the required data for several years! We are releasing it via FieldingBible.com for now, and will work to get the numbers updated on other websites over the offseason.

    For now, here’s a rundown of how we rated infielders previously and how we rate them now. Remember when you’re looking at these changes, there are two big things the new system accounts for that DRS as you know it didn’t handle so well.

    1. We can now split up infielder performance in terms of Positioning, Air balls, Range, and Throwing. Because positioning tends to be a team decision, that positioning value is actually getting removed from a player’s total. Therefore, a player’s total in this new component of DRS really is his ART Runs Saved.
    2. Because it was difficult to evaluate players on shift plays before, we removed them from DRS. Now that we can measure performance independent of positioning, we can add those plays back in, giving a much more complete picture of a player’s value.

    Without further ado, here are the updated leaders at each infield position in 2019.  We’re excluding pitchers and catchers here because any impact that would come from the two changes above would negligibly affect those positions.

    First Base Defensive Runs Saved Leaders, 2019

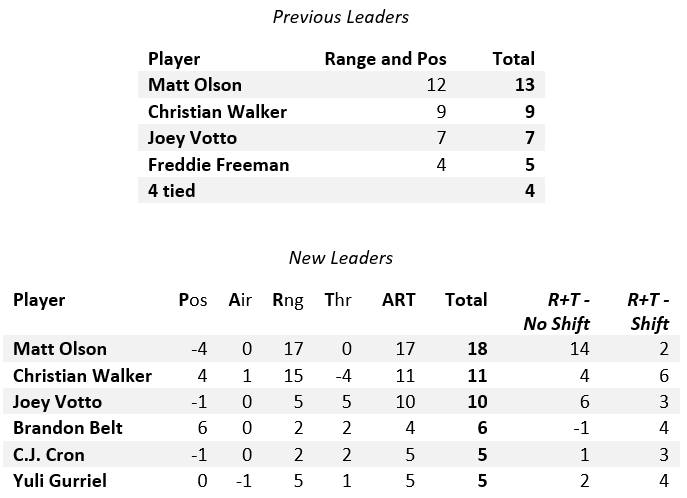
    We don’t get a very different picture of the top players at first base as a result of these changes, but we do get a little bit of a picture of different players’ usage and competencies. Matt Olson and Christian Walker separate from each other partially because of the quality of their positioning, with Olson getting some negative positioning removed and Walker losing the benefit of strong positioning (more on the DBacks’ positioning in a bit).

    Another important but subtle thing to note here is that “Throwing” is a bit of a misnomer, especially for first basemen. Technically it’s a measure of how well you turn balls in play into outs once you’ve fielded them. For first basemen, that often involves running to tag first base or flipping to the pitcher as opposed to what we usually think of as throwing. Joey Votto was quite good in this respect in 2019, while Walker was not.

    Second Base Defensive Runs Saved Leaders, 2019

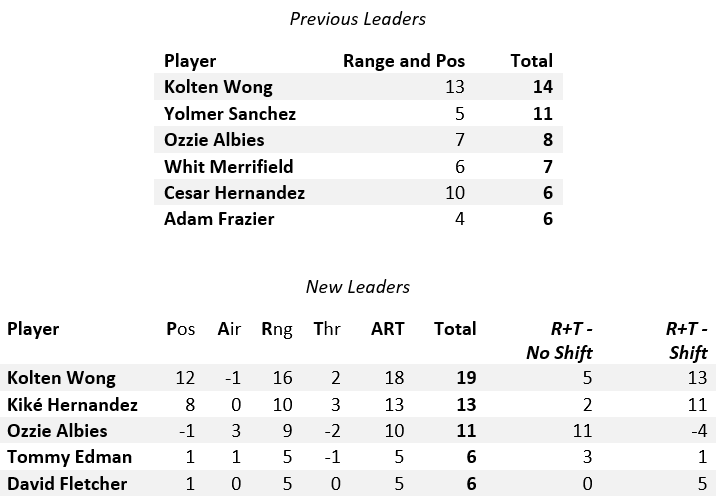
    At second base, the inclusion of shift plays was the biggest factor in who came out on top, as both Kolten Wong and Kiké Hernandez combined strong performance with excellent positioning. This is no surprise given that the Cardinals and Dodgers each netted 30 or more Shift Runs Saved in 2019.

    Falling off the leaderboard was Yolmer Sanchez. His 17 Positioning Runs Saved buoyed his total in the previous system, but the new system rates him as slightly below average in 2019.

    Third Base Defensive Runs Saved Leaders, 2019


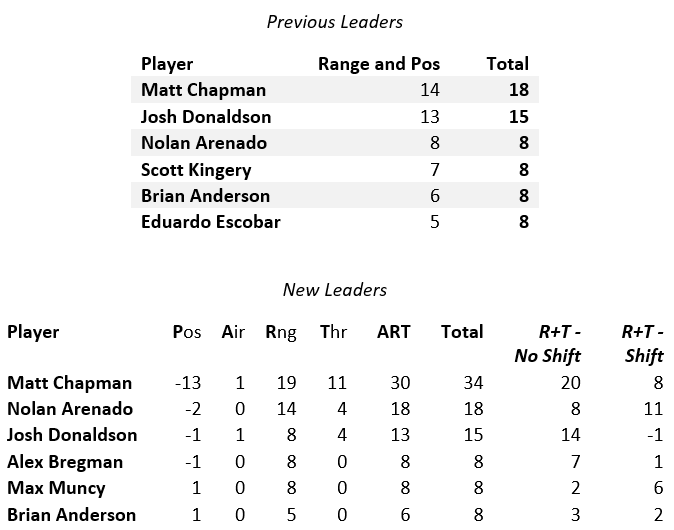
    Andrew Kyne has already written about the changes to Matt Chapman’s numbers. He cements himself as the best defender relative to his peers, nearly doubling another mainstay at the hot corner, Nolan Arenado. You can see evidence that Chapman’s arm actually gives the A’s license to position him poorly, because he’s able to make up for it on the back end.

    Shortstop Defensive Runs Saved Leaders, 2019

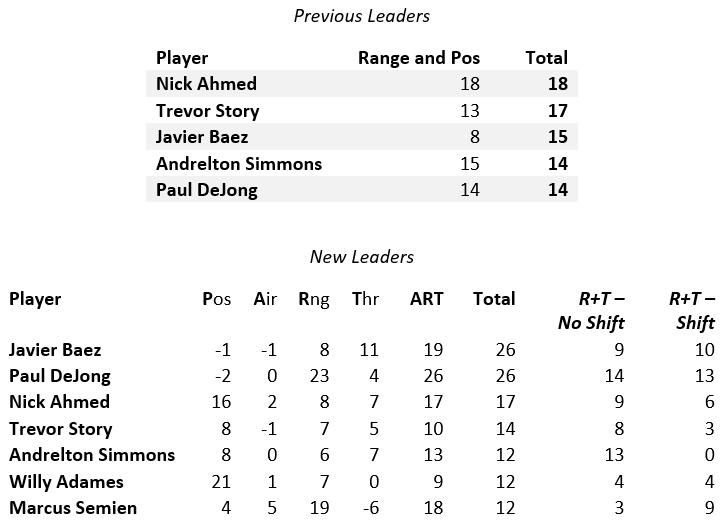
    The numbers for Javier Baez and Nick Ahmed are really illuminating thanks to the new system’s breakdown. Baez leaps up by 10 runs from the previous system thanks to his excellent performance on shift plays, even with the Cubs ranking second-lowest in shift usage per BIS. His 11 Throwing Runs Saved tied Matt Chapman for the most among infielders, a fact we would not have been able to uncover with the previous system.

    Ahmed benefited from Arizona’s outstanding positioning, saving an additional 16 runs. That great positioning gave him quite the boost relative to his peers in the previous DRS system, so he drops back a bit in the overall rankings. He also didn’t perform as well while shifted, so adding those plays back in didn’t help him like it did Baez and shortstop leader Paul DeJong.

    This data is now available for all Major League players on FieldingBible.com, and it will also be featured in The Fielding Bible – Volume V (coming in the spring of 2020) and in The Bill James Handbook 2020 (out now).

  • Some midseason updates to the Total Points calculation

    By Alex Vigderman

    Over the course of the year, we occasionally find certain plays or players that highlight something that isn’t quite right in the Total Points System. Also, because there are so many data points to comb through, we sometimes wait a bit to include something because we aren’t sure what to do with it yet. As a result of that, we have some updates to the Total Points calculations, which are now available on both the Pro and public versions of the SIS DataHub.

    Here’s a rundown of the key changes:

    • The back-end basis for Total Points, Points Above Average, is now forced to center at zero for each point type (passing, rushing, pass coverage, etc.). This isn’t a large change because these numbers were already close to zero, but does make the term Points Above Average more appropriate
    • On passing plays, the calculation used to split Air Yards, Yards After Catch, and Yards After Contact between the passer and receiver. The Air category has been split into an initial Throw value which estimates the value of the throw based on the route and depth, and a Catch value that focuses more on the accuracy of the pass and the catching ability of the receiver. Defensive backs split responsibility for the Throw portion, but the primary defender is the only one responsible for the Catch portion.
    • Playoffs are now excluded when calculating the average performance for different statistics (e.g. yards after the catch, blown block rate)
    • Centers are now being evaluated for aborted snaps (or lack thereof), which also gives quarterbacks a little less blame when that happens
    • Some running backs were getting an outsized debit when they failed to convert inside the five yard line because they failed to get enough yards after contact. The calculation was changed to use a different threshold for yards after contact on goal line runs, punishing those players much less.
    • Both offensive and defensive players now have the ability to get credit for recovering a fumble. For offensive players, that’s the inverse of the value that is lost by the fumbling player. For defensive players, it’s the same as the value lost by the fumbling player.
    • Offensive players are now being credited for advancing a recovered fumble based on the yards gained
    • Pass rushers are now being credited for accumulating pressure stats (hurries, hits, knockdowns, sacks) relative to the average for players lined up at their position.
    • On plays where one pass rusher hurries the quarterback and a different player gets the sack, the hurrier is now splitting credit for the sack
  • Cody Bellinger is Having a Plate Discipline Renaissance

    Cody Bellinger is Having a Plate Discipline Renaissance

    BY ALEX VIGDERMAN

    Sunday’s game between the Dodgers and Brewers featured a nice little moment between the two players dominating the National League with the bat, Christian Yelich and Cody Bellinger. Yelich, who would go on to win NL Player of the Week honors for his eight homers the rest of the week, was robbed of a ninth by Bellinger himself. I guess he’s really taking the early MVP race seriously.

    After that performance (in a game which also included Bellinger hitting an un-robbed home run), the Dodgers right fielder sits with five Defensive Runs Saved (one of those at first base) and a .424/.500/.882 slash line. One could have expected him to have an excellent defensive season in right given that he patrolled center field for nearly 500 innings at an above-average rate in 2018. But after a remarkable rookie campaign in ’17 and a merely above-average year to follow it up, it wasn’t clear what to expect from him at the dish.

    Let’s review the ups and downs through the lens of Defense Independent Batting Statistics (DIBS). Sports Info Solutions uses several pieces of information about each batted ball—from distance and hang time to handedness and whether there was a shift on—to determine the expected rate of singles, doubles, triples, and home runs for each batted ball. Add all those up and you get an expected batting line that corrects for things like bad luck and good defense.

    In this plot, we’ll show Bellinger’s expected Batting Average on Balls in Play (BABIP) and expected Isolated Power (ISO, or slugging percentage minus batting average). These two metrics focus only on balls in play, helping to show his overall hitting ability as well as his power specifically.

    Besides a surge in power last June, Bellinger’s xISO was higher in every month in 2017 than it was in any month in 2018. In fact, there was a downward trend in his power profile even within 2017. As 2018 wore on, though, Bellinger was able to maintain a positive trend in his xBABIP, suggesting that he was still hitting the ball hard, just not in a way that generates a lot of power. It’s worth pointing out here that, even at those low points around a .200 expected Isolated Power, we’re still looking at an above-average power profile. Just not otherworldly.

    Through the first few weeks of the 2019 season, Bellinger has been demolishing the ball, to the tune of nearly a .400 xBABIP and .500 xISO. Because we’re still only a few weeks into the season and Bellinger’s only hit so many balls in play, we can feel comfortable that those rates won’t last long. But there are reasons to believe he could be back to his 2017 form, and perhaps better.

    In particular, his batting eye has improved substantially. Plate discipline stats are really useful this early in the season because they’re on a per-pitch level instead of a per-plate-appearance level, and that’s where Bellinger’s made an obvious leap.

    After chasing 28 percent of balls outside the strike zone the previous two years, he’s chased only 22 percent this year. He’s swung and missed at just 5 percent of pitches this year (21 out of 418) after whiffing on 13 percent in his first two seasons.

    Teams have tended to stay on the outer edge of the plate against Bellinger, trying to avoid him yanking one out to right field and instead trying to get him to weakly ground into the shift. Eventually they have to come inside, though, and Bellinger has really made the most of those opportunities. On those pitches, he’s been incredibly selective, particularly in spitting on pitches too far inside.

    Cody Bellinger Plate Discipline, Inner Third and Inside, 2018-19

    What has he gotten out of that improved selectivity? How about a 2.134 OPS on 29 plate appearances ending with a pitch on the inner third and in, compared to .681 in 2018. That’s also more than 900 points higher than his performance against pitches on either the outside or middle.

    Not only has he addressed what was a hole in his game last year, he’s taken advantage of pitches he should crush. In 2018, he whiffed on 18 percent of his swings and had a .914 OPS against pitches in the zone and belt-high. This year, he’s only whiffed once in 35 swings and has a 2.429 OPS against those same pitches.

    Sure, Christian Yelich has an MVP trophy in his case already and is on an incredible home run pace. But if early returns are any indication, the guy who robbed him of a home run on Sunday might rob him of something else come October.

  • March’s Most Interesting Team Was… the Marlins?

    March’s Most Interesting Team Was… the Marlins?

    BY ALEX VIGDERMAN

    The NL East might have been the buzziest division in baseball over the offseason, with every team making big trades and/or signings. You know all that because you’ve been paying attention. You’re reading this blog after all.

    The Marlins’ primary buzz surrounded their pursuit of offloading J.T. Realmuto, so once that was done all the NL East attention went back to the four teams jockeying for position at the top.

    What if I told you that the Marlins are on pace to use infield shifts on balls in play more than any team in history? How about over 1,000 more times than the next-closest team?

    Well, first you’d say stop playing the on-pace game. But next you’d probably say, “Really? The Marlins?”

    (As should come with any April baseball article, all small sample caveats apply to the following paragraphs.)

    The Marlins had 78 shifts on balls in play in their series against the Rockies. That’s a pace of 3,159 for the season.

    Remember that the prorated numbers are particularly silly this early. But to use that many shifts is a pretty crazy start to the season. The shiftiest teams on record recorded totals in the 1,800’s.

    In fact, this year’s Marlins team shifted on 73 of its first hundred balls in play, which outpaces any team on record (the 2017 Angels had 65).

    Perhaps just as interesting, Miami has really committed to full shifts (the traditional three-to-one-side version). Since the start of 2018, the league as a whole has favored full shifts to partial shifts (two on each side but with a noticeable shift in positioning), but only slightly.

    This runs counter to what BIS has recommended many times in the past, which is that partial shifts are not nearly as effective. Over the last four-plus seasons (quite a large sample), groundballs and short line drives hit into full shifts have a .222 batting average, compared to .274 with partial shifts.

    Bucking the league trend, 61 of the Marlins’ 73 shifts mentioned above were full shifts. That’s 12 more than any team has ever used in their first hundred balls in play.

    So what gives? It’s not like the Marlins’ opponent this past weekend, the Rockies, is chock full of shift candidates. Current Rockies hitters combined to be shifted on just 23 percent of their balls in play last season, eighth-fewest in MLB.

    It turns out this has been a bit of an M.O. for the Marlins the last few seasons. In each of 2017, 2018, and (as of now) 2019, they have increased their shift rate substantially to start the season. Compared to their shift rates in both the previous season as a whole and just the last month of the previous season, they’ve added 10 percentage points or more each April the last three years. They’re the only team to do that.

    Marlins Shift Percentage on Balls In Play
    (March/April vs. Previous Seasons)

    Per Sports Info Solutions

    As you might notice from this table, though, even with substantial upticks in shifting to start each season, they’ve ended up with much lower rates by the end of the season. In 2018, for example, they shifted on 33 percent of their balls in play through April, but ended up at 29 percent (meaning they were below that from May on).

    Should we expect anything like this going forward? Of course not. Given that annual trend, it’s probably fair to assume that the Marlins aren’t going to blow away shift records and single-handedly bring the league to ban the shift or anything like that.

    That’s especially true if their performance with shifts doesn’t improve. Thus far they have zero Shift Runs Saved, which measures shift effectiveness compared to an average defense. Considering the volume with which they’ve shifted, that’s not great.

    The big trouble with their performance in the shift is that the players are botching plays where the shift might otherwise have been successful. The Marlins have committed nine Defensive Misplays or Errors with the shift on, six more than any other team (acknowledging that they also have more shifts than anyone).

    The Phillies had a similar situation last year when their shifts were being criticized (Andrew Kyne wrote about it last spring). The shift can only help so much when the fielders don’t complete the plays presented to them. Philadelphia saw substantial improvement in their performance over the second half of 2018, so it’s fair to assume that the Marlins will get more out of their shifts going forward as well.

    Obviously this is a wait-and-see situation. But given how outlandishly aggressive Miami has been in shifting so far, it will be very interesting to see how they follow up against the Mets this week.

  • On Nick Foles’ now-annual resurgence

    By ALEX VIGDERMAN

    Another year, another late-season Carson Wentz injury forcing Nick Foles back into the spotlight. The Eagles squeaked into the last spot in the NFC playoffs thanks to Foles regaining his form from the end of last season. It’s a fascinating turn of events after he looked like he had turned into a pumpkin earlier in the season.  This week’s matchup with the Bears doesn’t do him any favors, but let’s see where Foles has made his bones over the last month and see how that matches up with Chicago.

    In the first two weeks of the 2018 season, Foles had a 71.2 Independent Quarterback Rating (SIS’s adjusted Passer Rating that isolates the impact of factors within the quarterback’s control). In his last three games, his IQR has been 109.2.  He leads the league with 86 percent catchable throws in that time frame.

    Part of the narrative has been that head coach Doug Pederson has given Foles quicker reads, simplifying the game for him. There’s definite truth to that. Foles has taken a three-step drop or shorter as frequently as anyone in the last few weeks, whereas in the first two weeks he was taking short drops at a below-average rate. And that doesn’t even include the Run-Pass Options (RPOs) that have been such a big part of Philly’s game plan with Foles at the helm.

    The thing is, it’s not like he performs better on those short drops. In 2018, his IQR on zero-to-three-step drops is 98, compared to 100 on rollouts or drops of five or more steps.  So where has he excelled since returning as the starter?

    Downfield Throws are Looking Up

    While Foles has not made a lot of throws downfield in his late-season surge, he’s made them count.

    His excellence on throws at least fifteen yards downfield shouldn’t surprise anyone who has followed his career. In 2013 his monster season (27 TD, 2 INT) was full of deep tosses to Riley Cooper and Desean Jackson. This year, he’s thrown 15 passes at least 15 yards downfield in each of his stints as a starter. Look at the difference in performance from early to late season.

    Nick Foles Performance on Throws at Least 15 Yards Downfield, 2018

    Weeks Att Catchable Comp Yards TD INT IQR
    1-2 15 10 3 82 0 1 10.3
    15-17 15 13 11 370 1 0 131.9

    For context, his completion percentage on those throws was worst in the league through Week 2 and best in the league in weeks 15-17 (minimum 15 attempts both times).  Results on deep throws tend to fluctuate a lot over time, so it’s as likely as not that this is just extreme variance one way followed by extreme variance the other way.

    Unfortunately for the Eagles, their Wild Card opponents, the Bears, are as good as anyone against downfield throws.  Of course, they’re the best defense in the league this year, so they’re as good as anyone at almost everything.  They trail only the Bills in Passer Rating allowed on downfield passes across the entire season (59), with an absurd rating of 22 on those throws from Week 9 forward.

    “The Man” Versus Man

    Early in the season, the Eagles were missing Alshon Jeffery and lost Darren Sproles almost immediately to injury.  In his own way, each of them is an asset against man coverage because of Jeffery’s size and physicality and Sproles’ agility.

    Since Foles returned to the starting job in Week 15, while Zach Ertz has continued to be peppered with targets regardless of the situation, Jeffery, Sproles, and Nelson Agholor have feasted in particular against man coverage.  When seeing man, Foles has thrown for 309 yards and 5 touchdowns on 19 throws to those three alone (good for over 16 yards per target).  Everyone else has seen 29 targets but yielded only 187 yards and two touchdowns (a mere 6.4 yards per target).  Overall, he has the best IQR in the NFL over the last three weeks against man.

    You might have seen this coming, but the Bears are bad news here as well.  They are also second in the NFL in Passer Rating allowed in man coverage (at 76), and have also improved in this arena over the second half of the season (47 since Week 12).

    Foles has been a revelation for the third time in his career.  It’s impossible to count him out at this point given his track record, but the Eagles’ Wild Card opponent presents a particularly strong challenge based on what Foles has done well so far this year.

  • Stat of the Week: Minor League Defensive Runs Saved End-of-Season Roundup

    When a promising position player gets called up from the minors, you almost never hear about his defensive prospects unless they are extreme in one direction or the other. At Baseball Info Solutions, we use Minor League Defensive Runs Saved (DRS) as a tool to expand fans’ knowledge of the defensive side of the game.

    We track minor league DRS the same way we do in the majors, even comparing minor leaguers to the same baseline as their big league counterparts. With the 2018 minor league year completed, let’s look at the best of the best in Double-A and Triple-A. You’ll see the leaders at each position with their runs saved total at that position. To allow for comparison between players who are more likely to be future prospects, the leaders are split between ages 23 and younger and ages 24 and older.

    2018 Minor League DRS Leaders by Position, Ages 23 and Younger


    Pos

    Player, Organization

    Age

    Level

    DRS
    P Dedgar Jimenez, Bos 22 AA/AAA 5
    P Ranger Suarez, Phi 22 AA/AAA 5
    C Jake Rogers, Det 23 AA 18
    1B Bobby Bradley, Cle 22 AA/AAA 10
    2B Luis Urias, SD 21 AAA 13
    3B Mandy Alvarez, NYY 23 AA 9
    SS Andrew Velazquez, TB 23 AA/AAA 8
    LF Justin Williams, TB/StL 22 AAA 5
    CF Myles Straw, Hou 23 AAA 10
    RF Justin Williams, TB/StL 22 AAA 11

    Jake Rogers looks like a dominant performer on this list with 18 runs saved at catcher, but there are a couple guys competing with him when you consider their value across multiple positions. Luis Urias was the only minor leaguer to save at least three runs at three different positions this year (13 at 2B, 3 at 3B, 5 at SS). Justin Williams appears twice on the list, and is one of only three minor leaguers to save at least five runs at two different positions this year. Recent Astros callup Myles Straw has one carrying tool: his arm. He saved 9 of his 10 runs in center field with his arm alone.

    2018 Minor League DRS Leaders by Position, Ages 24 and Older


    Pos

    Player, Organization

    Age

    Level

    DRS
    P Mitch Talbot, Cle 34 AAA 10
    C Austin Allen, SD 24 AA 14
    C Rocky Gale, LAD 30 AAA 14
    1B Taylor Jones, Hou 24 AA/AAA 6
    2B Heiker Meneses, Phi 27 AA/AAA 8
    3B Josh Fuentes, Col 25 AAA 19
    SS Ildemaro Vargas, Ari 26 AAA 9
    SS Bengie Gonzalez, Was 28 AAA 9
    LF Andrew Guillotte, Tor 25 AA/AAA 9
    CF Jacob Hannemann, CHC 27 AAA 8
    RF Blake Drake, StL 24 AA 8

    This group is more of the Quad-A type that might get a cup of coffee or two in the majors but at this point in their careers are unlikely to make a true splash. The exception might be Josh Fuentes, who led the minors in Total Runs, which takes into account his hitting, fielding, and baserunning. But with his cousin Nolan Arenado (seriously) manning third base in Colorado, that splash may have to be at another position or with another organization. Rocky Gale and Andrew Guillotte had great defensive seasons thanks to excellence in one particular skill—Gale saved 13 runs with his pitch-framing, and Guillotte saved five in left field with his throwing arm. And I would be remiss not to mention Mitch Talbot, who led pitchers in DRS and held a 2.52 ERA in Triple-A after playing in independent ball and internationally from 2014-17.

    Other Notable
    Performances

    A couple of touted outfield prospects—Willie Calhoun of the Rangers and Raimel Tapia of the Rockies—sit towards the bottom of the minor league DRS list, with -29 and -30 respectively. Also in that neighborhood is Tim Tebow, whose broken hamate bone cut his season short after costing Binghamton 21 runs in the field.

    Of the top five prospects according to MLB Pipeline (Vladimir Guerrero Jr., Fernando Tatis Jr., Eloy Jimenez, Nick Senzel, and Victor Robles), Nick Senzel of the Reds easily stands out as the best of the bunch defensively, saving four runs in only 42 games between second and third base. Jimenez falls lowest among that group, costing 13 runs in the outfield in less than two-thirds of a season.


  • Hardest-Hitting Minor Leaguers According to Synthetic Statcast

    Statcast is a really exciting product to have at our fingertips when analyzing players. It has given the public a whole new vocabulary with which we can talk about baseball. How many times did you hear the terms “spin rate,” “exit velocity,” or “launch angle” before a couple years ago? Now these terms are everywhere.

    The trouble with Statcast is that analysis is limited to recent major league seasons, so we don’t have the ability to build context around these numbers like we do for on-base percentage or swinging strike rate, for example.

    Enter Synthetic Statcast. This is a product Baseball Info Solutions (BIS) unveiled at the SABR Analytics Conference this past March (audio hereslides here) that estimates exit velocity, launch angle, and spray (i.e. horizontal) angle from the hit location and timing of batted balls. This data gets really interesting when we start applying it to time periods and leagues where Statcast doesn’t exist, because we can now talk about these new statistics in those contexts as well.

    Using Synthetic Statcast exit velocities, here are the Average Exit Velocity and Hard Hit Rate leaderboards for Double-A and Triple-A this season. In this case, Hard Hit Rate is the percentage of at-bats in which the player hit a ball at least 95 miles per hour.

    High Minors Average Exit Velocity Leaders, 2018 (min 100 AB)

    Player Level Org Avg Exit Velo
    Dylan Cozens AAA PHI 91
    Chris Carter AAA LAA 90
    Jacob Wilson AA/AAA WAS 89
    Ryan O’Hearn AAA KC 89
    Victor Roache AA STL 89
    Mike Ford AAA NYY 89

    High Minors Hard Hit Rate Leaders, 2018 (min 100 AB)

    Player Level Org Hard Hit Rate
    Mike Ford AAA NYY 31%
    Jacob Wilson AA/AAA WAS 28%
    Peter Alonso AA NYM 27%
    Dustin Fowler AAA OAK 26%
    Victor Roache AA STL 26%

    There are a few hotter prospect names on or just short of making these lists. MLB.com top ten prospect Fernando Tatis Jr. is seventh on the exit velocity leaderboard. He has a strong power profile but has struck out more than 30 percent of the time since graduating to Double-A. Recent A’s callup Dustin Fowler had his major league debut foiled by injury last season, but slugging over .500 in 100 games at Triple-A has earned him more than just a cup of coffee in the majors. Peter Alonso is one of the Mets’ top prospects, slugging over .500 and striking out less than 20 percent of the time at every level so far. And Blue Jays farmhand Vladimir Guerrero Jr., perhaps the best hitting prospect in the league after Ronald Acuna’s call-up, is 14th with a 24 percent Hard Hit Rate.

    It’s not very surprising to see Dylan Cozens and Chris Carter as exit velocity leaders. They are both high-strikeout sluggers who crush the ball when they do hit it. Notice that they aren’t at the top of the Hard Hit Rate leaderboard because they don’t make a lot of contact. Jacob Wilson, Mike Ford, and Victor Roache are notable because they appear on both lists, but Ford hasn’t harnessed that power yet and the other two have limited upside because of their age.

  • With Byron Buxton out again, let’s find his most statistically similar player

    BY ALEX VIGDERMAN
    While on a rehab assignment for another injury this past weekend, Byron Buxton fouled a ball off his toe and suffered a hairline fracture, sidelining him again in what is quickly shaping up to be a lost season.

    We all love keeping track of the trials and tribulations of Buxton as a tantalizing former uber-prospect, but with him on the shelf a little longer, I still want to feel that same thwarted lust for a five-tool superstar. Fortunately, I just realized that Michael A. Taylor and Buxton are basically the same player with a few years difference in age.

    Both have been up-and-down between Triple-A and the majors over the course of their relatively short careers thanks to their plate discipline limitations. Buxton was a top overall prospect without much competition in center field, so he saw playing time earlier in his career, while Taylor has needed injuries and the departure of Jayson Werth to find more opportunities.

    Here are Buxton’s and Taylor’s stat lines since the start of last season.

    Stat Buxton Taylor
    PA 554 537
    AVG .249 .261
    OBP .308 .315
    SLG .400 .466
    BB% 7.2 7.3
    K% 29.1 31.3

    Maybe Taylor strikes out a little more but has a little more consistent pop. But on the whole these are fairly similar low-contact moderate-power hitters.

    Of course, Buxton brings elite tools to the table outside of his bat. Since the start of 2017, Buxton has been the best in the major leagues as a defensive center fielder (24 runs saved) and as a baserunner (good for a +63 Net Gain, described in the Bill James Handbook).

    Taylor doesn’t have that elite level of performance over a larger sample, but he’s doing his darnedest this year to get to Buxton’s level. Through the first month of the season, he leads the major leagues in Net Gain on the bases (+15) and is second in DRS among center fielders (6, one run behind Delino DeShields). Buxton won a Gold Glove last season. Taylor’s teammates have talked him up as being a capable candidate.

    Like Buxton, Taylor got off to a slow start this season, but he’s been healthy and had the opportunity to make up for it. He’s hitting .289/.396/.600 in his last 14 games

    We’re still in Small Sample Size Mode in 2018, so caveats abound, but it will be exciting to see if Taylor keeps this up and, even at age 27, brings a little bit of new blood to the ultra-toolsy center fielder discussion.

  • Limiting damage, improved walk rate keying Phillies’ success

    By ALEX VIGDERMAN

    At least through the first third of the year, 2018 is shaping up to be the Year of Philadelphia. The Eagles finally won the Super Bowl, the Villanova Wildcats (admittedly merely a Philly suburb) won their second National Championship in three years, and the 76ers seem to finally be rewarding their fans’ Trust in the Process. The Flyers don’t fit with this narrative so we will not mention them.

    The Phillies made a few moves in the offseason and made an exciting managerial hire that signaled they were ready to take a leap after winning between 63 and 73 games each of the previous five seasons. And they proceeded to fall right on their spreadsheet-loving faces the first week of the year, starting 1-4 and making numerous pitcher-management and defensive-positioning blunders along the way.

    Well, since then the team has gone 13-3 and now sits just a half game out of the division lead. In fact, since April 5 they’ve scored the most runs in the National League and allowed the fewest.

    So they must be mashing, right? Well, sort of. They’re middle of the pack in both batting average and slugging percentage, but where the team is really making its bones is with plate discipline.

    They are walking an MLB-high 12 percent of the time so far this year, a four percentage-point jump from 2017 (when they ranked 22nd).

    You can thank a full complement of Rhys Hoskins and the addition of Carlos Santana for that. Phillies first basemen walked 56 times last season. Santana has topped that by at least 30 in each of the last seven seasons. The Phillies totaled 160 walks from their outfielders last season. They’re already at 40.

    If they were to maintain their walk percentage pace, it would be the largest year-to-year jump in walk rate since the 1940’s by nearly a full percentage point.

    Of course, the pitching is where the team has really performed excellently, even with much of the same cast of characters. Their starter ERA of 3.01 ranks fourth in the majors and tops in the NL, and after the whole kerfuffle about pulling Aaron Nola too early in the season opener, they rank in the top ten so far in the percentage of innings coming from starters.

    It seems possible they’ll be able to keep up this performance, as well, as the pitching staff as a whole has the lowest Hard Hit Rate in the major leagues at 17 percent.

    MLB Hard Hit Rate Allowed Leaders, 2018

    Rank Team Hard Hit %
    1 Phillies 17%
    2 Astros 18%
    3 Nationals 20%
    4 Mets 21%
    5 Cubs 21%

    That pitching success is coming in spite of a lackluster defensive showing, both from the fielders themselves and from the more aggressive defensive positioning adjustments the new coaching staff has implemented.

    The Phillies are last in the majors with -14 Defensive Runs Saved, including -4 Shift Runs Saved, which also ranks last in MLB. The team as a whole is new to shifting, of course, as they are projected to more than double their shift usage from any previous season.

    Some improvement is likely to come in that department as the fielders get more comfortable with the new approach to positioning, but this was a team whose defense cost itself 50 runs last season, so let’s not get carried away with those expectations.

    Heading into the last week of April this is one of the more surprisingly good starts of any team in baseball, and a vastly-improved approach at the plate and underperforming defense thus far suggest that they might be able to keep this up a bit longer.

    Follow us on Twitter at @Sportsinfo_SIS

  • The Best Position Player in Chicago

    It’s been a rough year for Chicago baseball fans. With disappointing seasons from the likes of Starlin Castro and Paul Konerko, plus the trades of Alfonso Soriano, Alex Rios, Jake Peavy, and Matt Garza, there have few bright spots on either side of town. In a few short weeks, Chicagoans will look back and realize that Welington Castillo might be the best player on either roster outside of All-Star victor Chris Sale.

    Welington Castillo was languishing in Iowa until August of 2012, waiting for the Geovany Soto trade to finally get his chance. He hasn’t been an offensive superstar by any means. His .265 batting average is valuable largely because he’s developed into a patient hitter with an above-average .343 on-base percentage.  While he hasn’t shown it in the majors, his minor league numbers suggest that the 26-year-old has some power in the tank. But his bat isn’t what makes him valuable to the Cubs.

    Castillo has excelled in every aspect of his defensive responsibilities this year. First of all, his ability to block pitches in the dirt is unmatched. In the eloquent words of Cubs’ skipper Dale Sveum, “There ain’t nobody better blocking the ball than he is.” The numbers back it up: Castillo has blocked 551 pitches in the dirt this year against just 28 wild pitches, a 95 percent block rate. By comparison, Indians’ catcher/first baseman Carlos Santana has allowed 42 wild pitches this year against only 255 catcher blocks (86 percent). To put it another way, Santana would have to block another 572 consecutive pitches in the dirt without allowing a single wild pitch to match Castillo’s block rate. While it’s not difficult to compare favorably to Santana defensively, BIS estimates that Castillo has saved the Cubs 10 runs on Good Fielding Plays and Defensive Misplays (carried largely by his pitch blocking). Santana, on the other hand, has cost the Indians 7.

    Additionally, there’s his control of opposing baserunners. With Castillo on the field, runners have successfully stolen 53 bases, been caught by the pitcher 5 times, and been caught by Castillo himself 19 times. Omitting pitcher caught stealing, that’s a 26 percent caught stealing rate compared to the league average of 23 percent. On top of that, Castillo has picked off four additional runners, which is more than any other catcher except Chris Iannetta. Baseball Info Solutions estimates that his control of the running game has saved the Cubs another five runs compared to an average catcher.

    All in all, Defensive Runs Saved has Welington Castillo as 18 runs better than an average catcher this season, the best mark in MLB by a full eight runs. It remains to be seen if Castillo’s play will be recognized this offseason when the hardware is passed out. While Gold Glove voters have been notoriously slow to vote for newcomers, the Fielding Bible Awards panel may be quicker to give Castillo his due. As their rebuilding efforts continue, hopefully the Cubs’ management will similarly appreciate the value their backstop provides.

    -Ben Jedlovec, Vice President–Product Development & Sales, Baseball Info Solutions