Sports Info Solutions
Author: Bryce Rossler
-
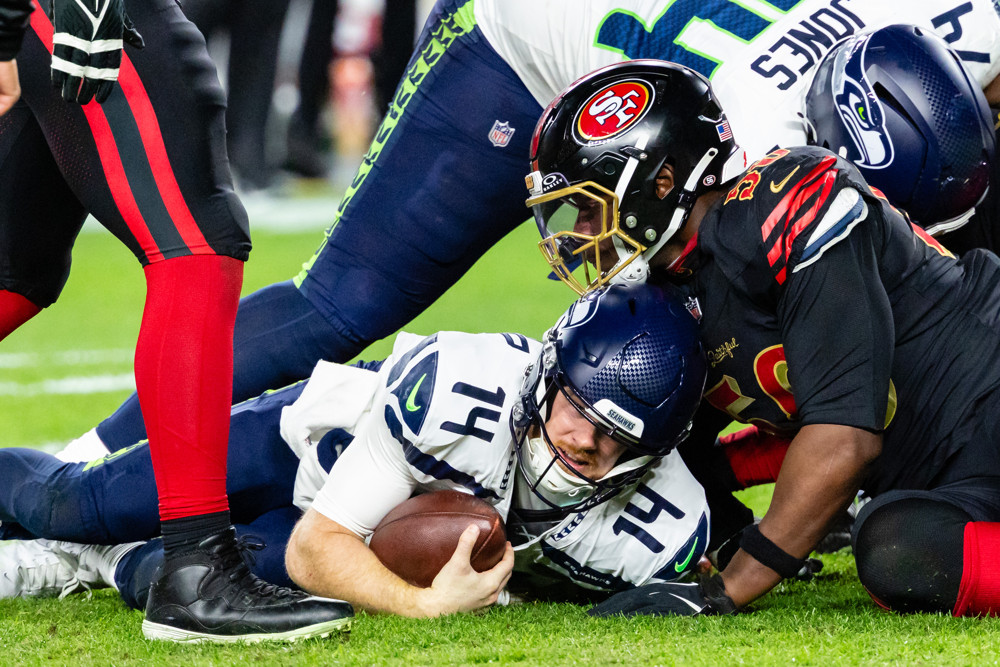
Are The Seahawks Sam Darnold-Proof?
By
Even when their quarterback implodes the Seahawks are still a very tough team to beat
-
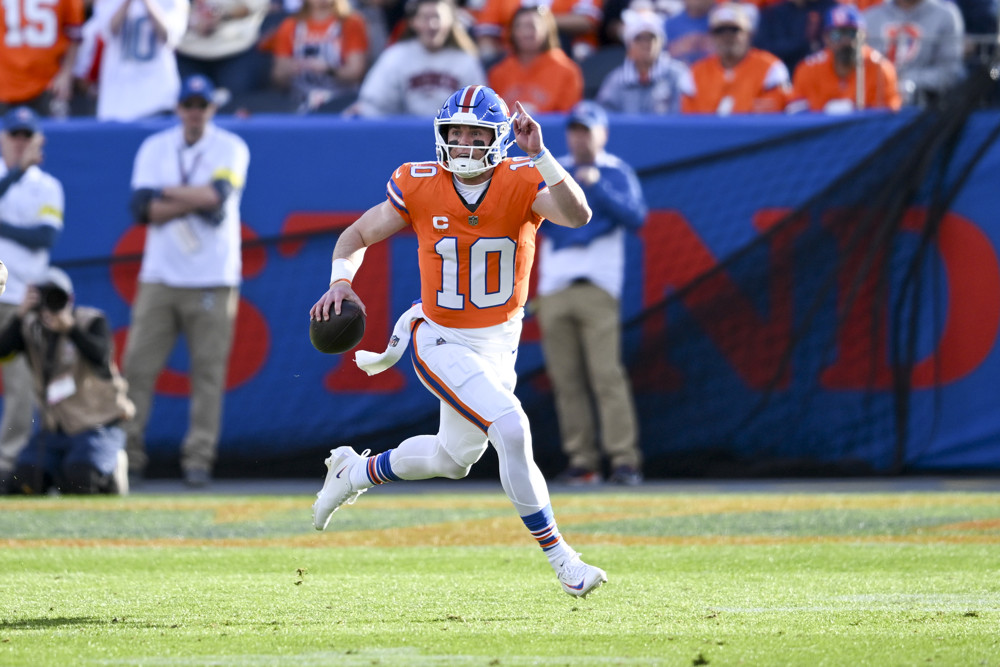
Why Does Our Player Value Stat Rank Bo Nix No. 1?
By
Nix doesn’t rate well across most statistical measures. So what’s going on here?
-
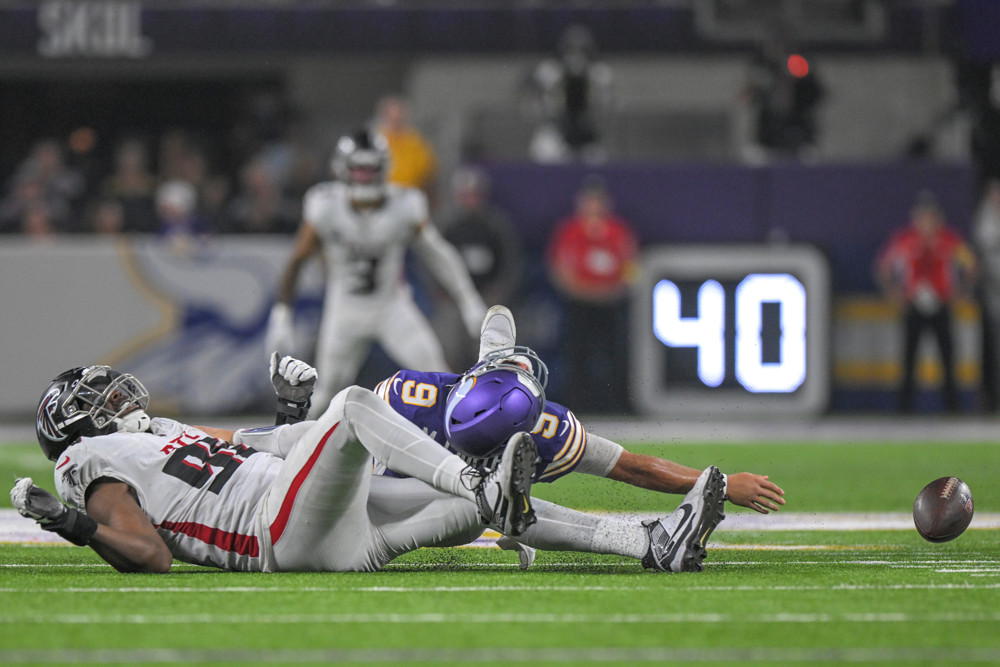
Find Us A Good Stat on J.J. McCarthy … Believe Me, We’ve Tried
By
“The film says he’s been bad, the stats say he’s been bad, and that there’s currently nothing encouraging to point to …”
-
Nevermore? The 1-3 Ravens’ Playoff Path
By
The Ravens’ margin for error going forward is slim, especially in light of the injuries they’ve sustained. However, most 1-3 teams have not been as talented as Baltimore
-
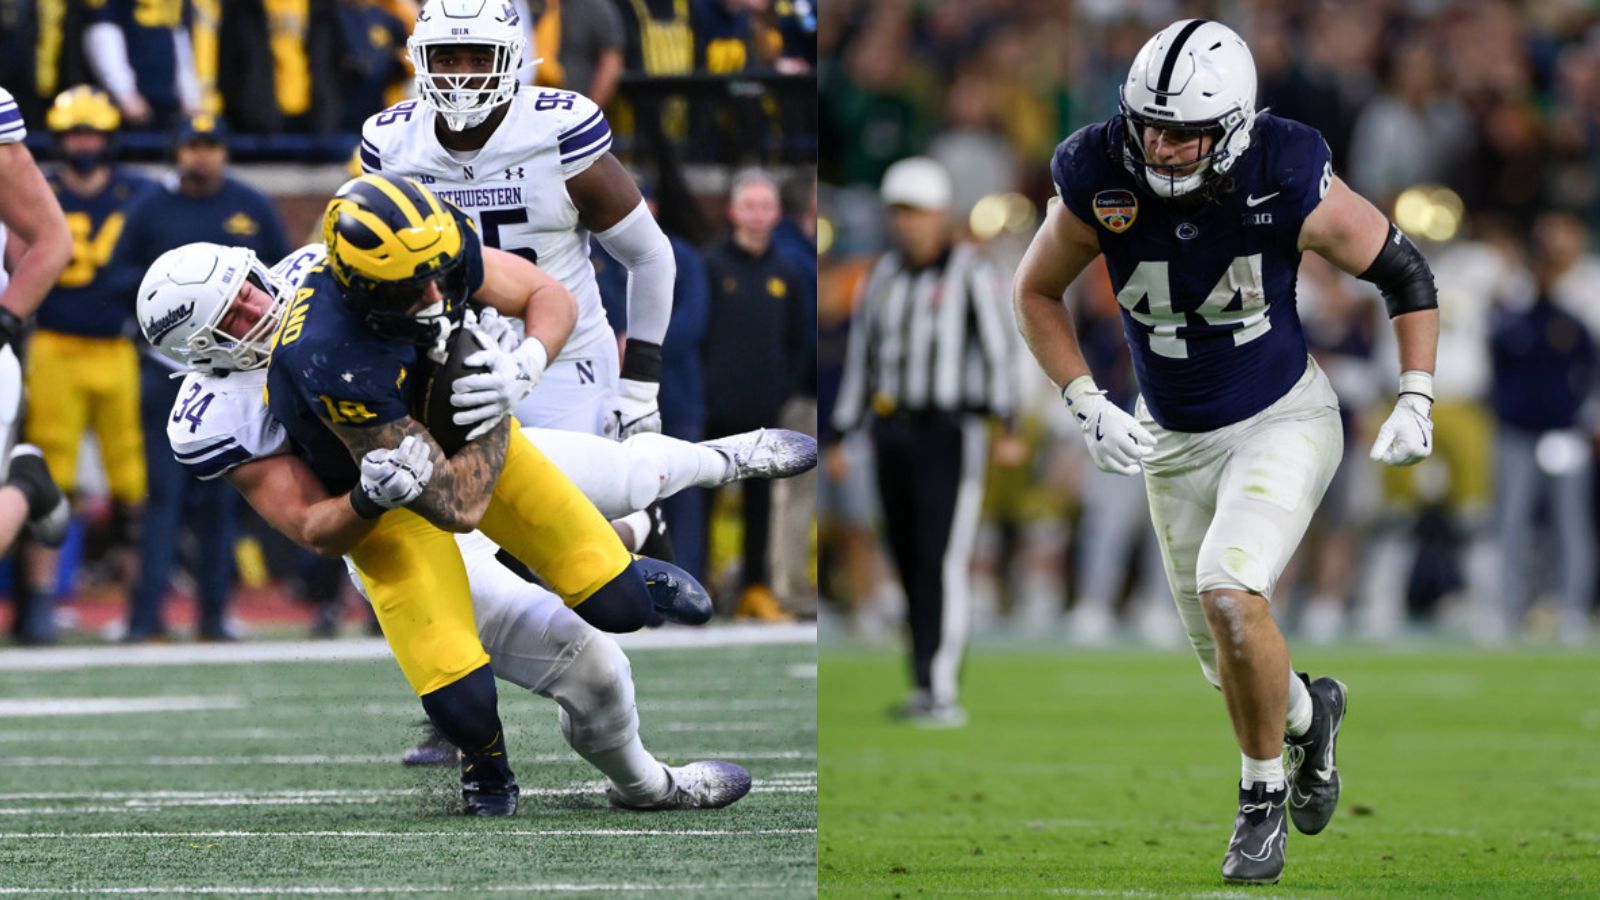
How Do Tyler Warren and Colston Loveland Compare As Draft Prospects
By
Colston Loveland and Tyler Warren are two premier tight ends with desirable traits but some limitations. We dive in and break them down statistically.
-
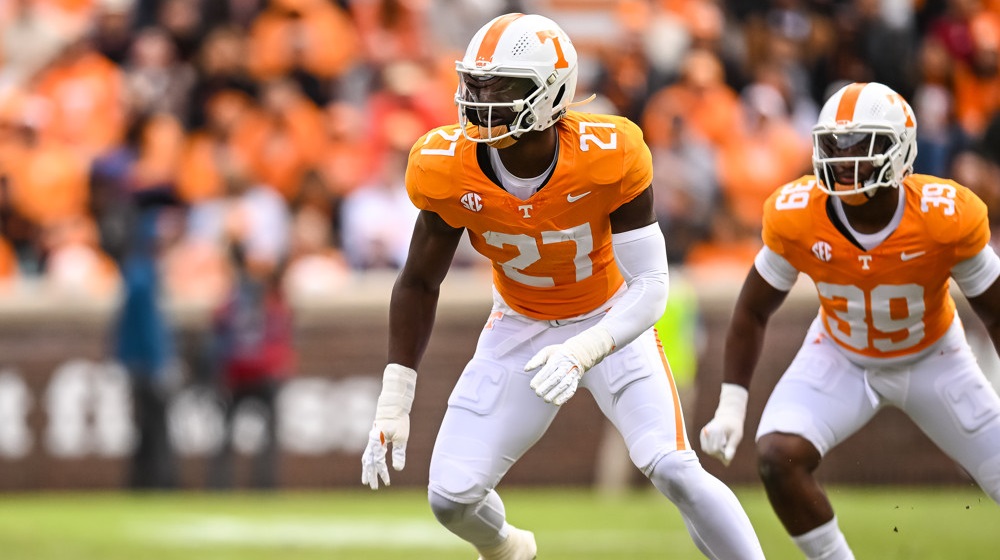
What Do Analytics Show For Edge Rushers In NFL Draft?
By
There may not be any blue-chip megastars in this group, but the numbers show there’s a lot of talent to be had.
-
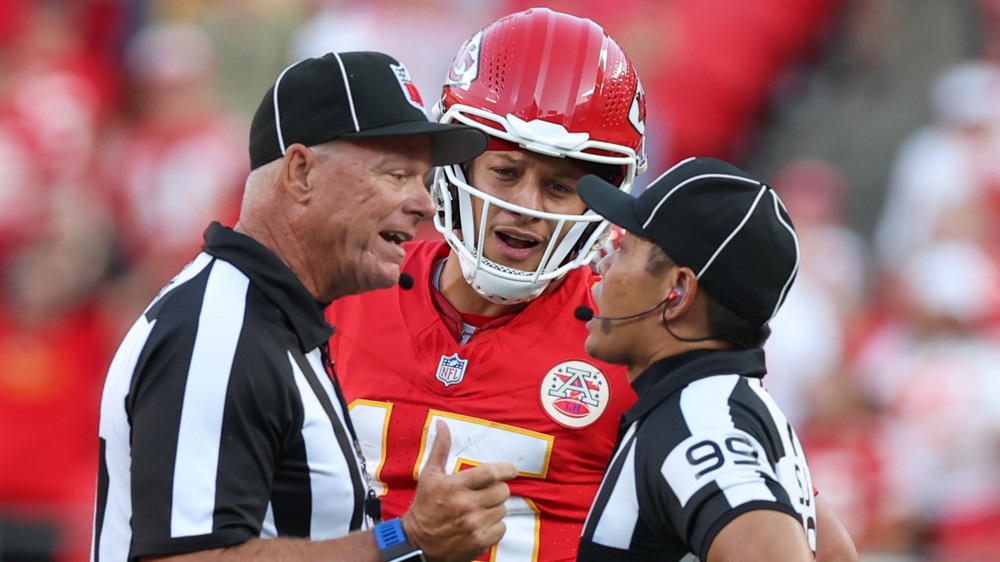
What Does The Data Show About Patrick Mahomes and Favorable Officiating?
By
We can tell you many things, including whether or not the Kansas City offense benefits disproportionately from officiating
-

Chalk Talk!: NFL Playoff Team Offensive Schemes
By
An intense look at how each playoff team approaches moving the ball and scoring on offense
-
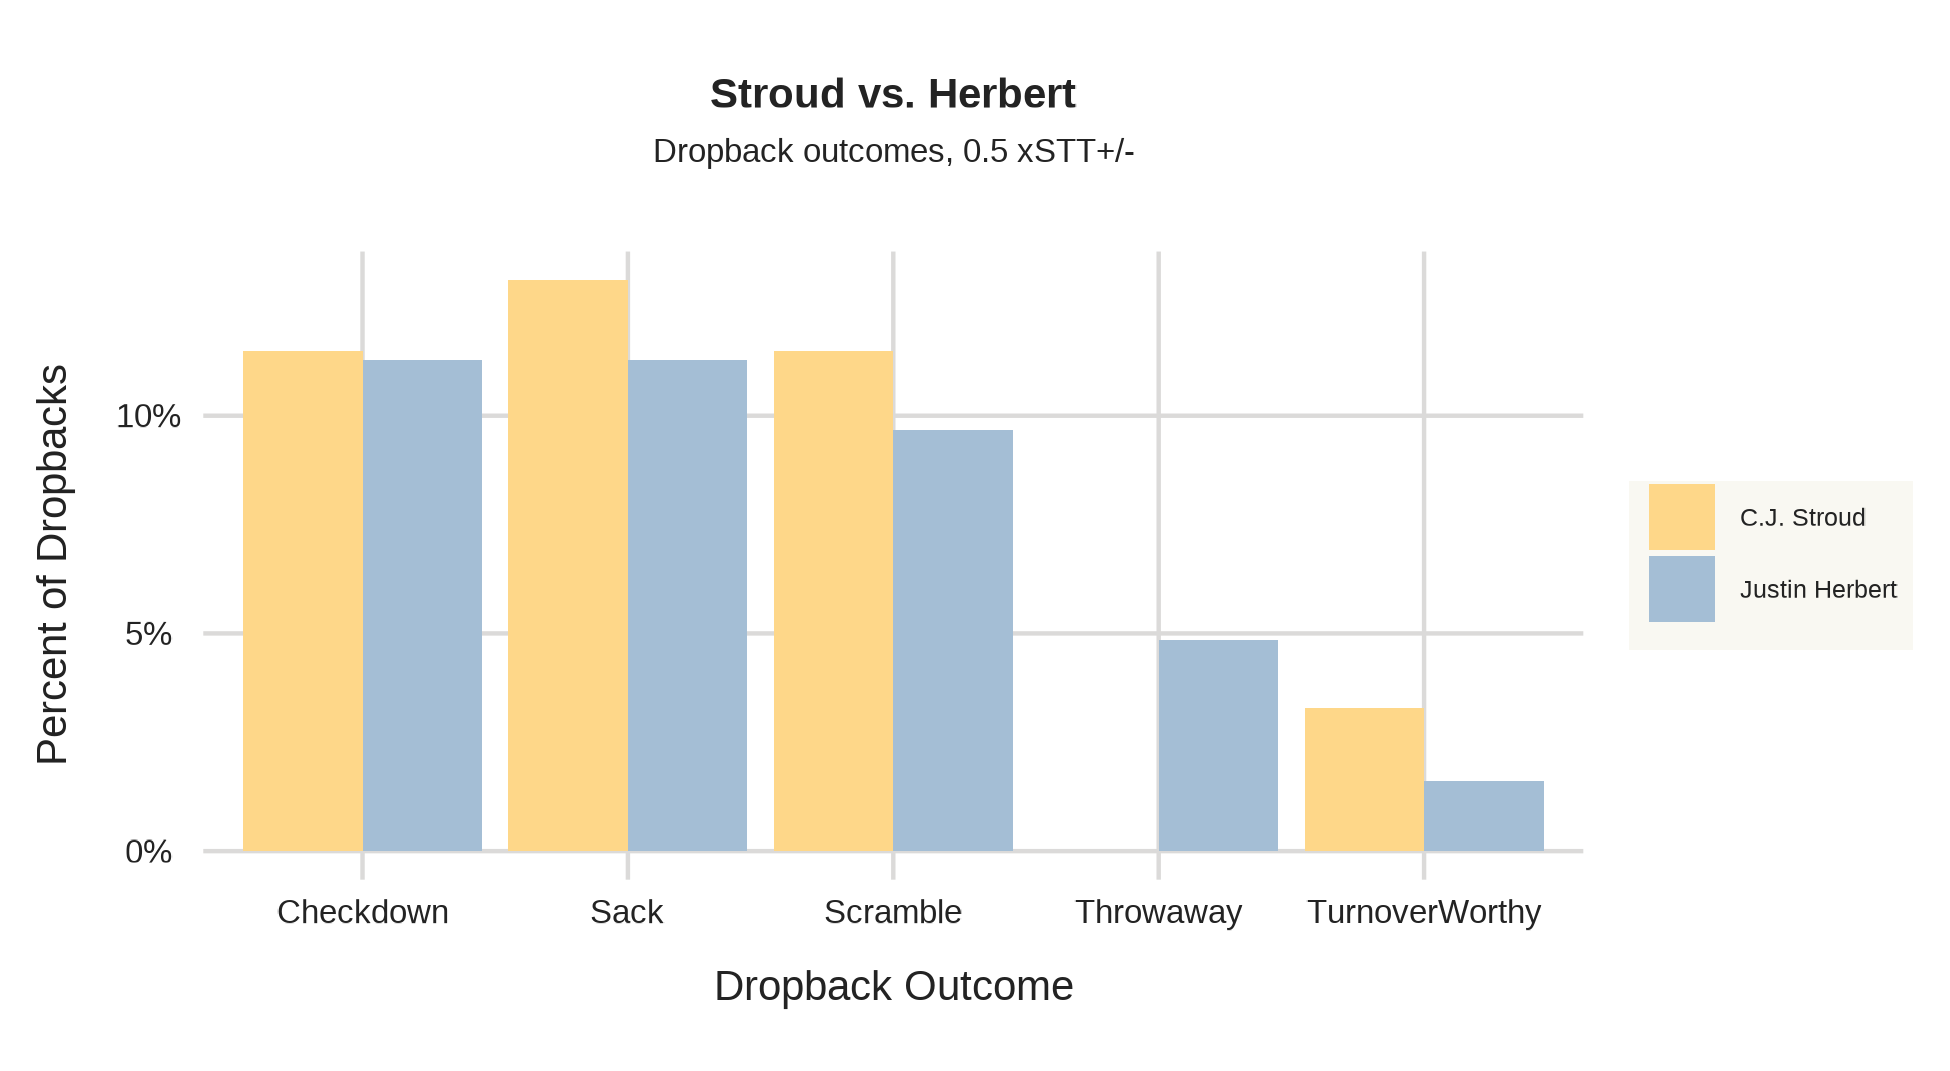
Chaos Manifest: Measuring How QBs Behave as Passing Plays Break Down
By
Introducing Expected Snap to Throw +/- (xSTT+/-) as a way of looking at dropback outcomes.
-
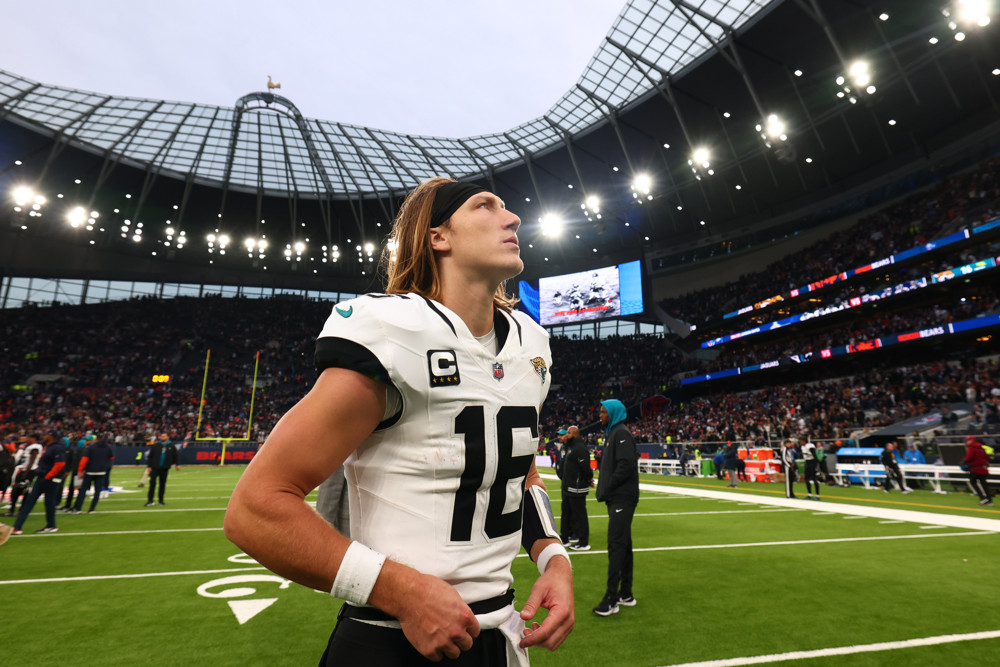
What should we make of Trevor Lawrence?
By
The protagonist in our story, while perhaps not as far along in his development as one would like, is beset by those who aren’t helping get the best out of him.