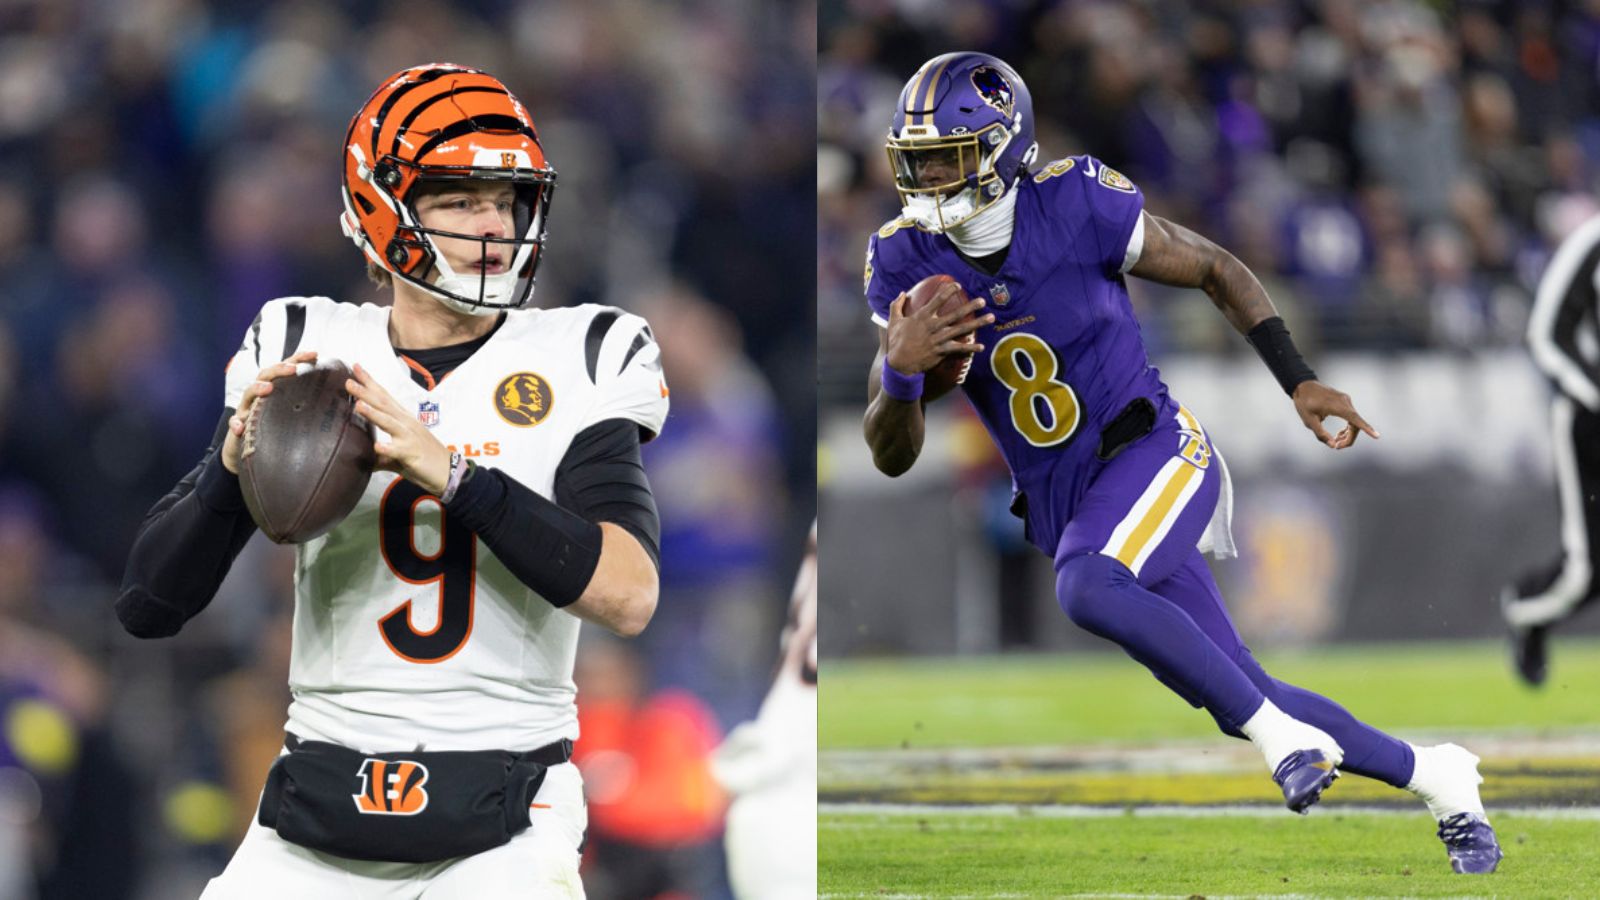
Category: 2025 NFL

  • Patrick Mahomes Is Still The King Of Clutch (Despite the Bills Loss)

    Patrick Mahomes Is Still The King Of Clutch (Despite the Bills Loss)

    Photo: Rich Graessle/PPI/Icon Sportswire

    The Chiefs once again lost to the Bills in the regular season, something that they’ve grown accustomed to despite having no issue dismissing Buffalo from the playoffs in recent years. Even as they were sitting a score or two behind for much of the game, the specter of Mahomes Magic loomed, but it didn’t quite manifest in this contest.

    In a world where Bo Nix seems to post a big fourth quarter (after a questionable first three) every week, I thought it’d be helpful to talk about quarterback clutch performance and put Patrick Mahomes into some perspective with others in the league.

    First off, how might we operationalize clutch? I thought of it two ways, in both cases using our player value metric Total Points to draw the comparison. 

    The simple one is performance late in games, comparing fourth quarter production to first-three-quarters production. 

    The more complex one is comparing high-leverage situations to low-leverage ones, building in an understanding that a fourth quarter touchdown when you’re down by 28 points isn’t very clutch. For this we borrow methodology from the baseball world, where we can label a situation’s “leverage index” by comparing how much a team’s win probability can swing in a given situation compared to the average. 

    Leverage can get really high in some situations (like 10x a typical play), but values above 2 are pretty rare in football, so samples get small. So for this purpose I am considering high leverage to be 1.5x and low leverage to be 0.5x an average situation.

    To put that in slightly more concrete terms, here are three 1st-and-10 situations around midfield that have different leverage indices by our calculations.

    Average leverage: 1st quarter, 4 minutes left, 7 point lead

    High leverage (1.5x average): 4th quarter, 4 minutes left, tie game

    Low leverage (0.5x average): 2nd quarter, 4 minutes left, 13 point lead

    I took each quarterback’s relative success in fourth quarters and high-leverage situations (compared to the rest of their plays) and simply averaged them together to come up with a “clutch composite”, if you will. And if we look at current quarterbacks with at least 1,500 evaluated plays in their career so far (roughly two-plus full seasons), it’s not surprising who we find at the top.

    Most clutch current quarterbacks, minimum 1,500 career dropbacks / carries

    Plays TP/play difference*
    Patrick Mahomes 5,890 0.10
    Tyrod Taylor 1,844 0.09
    Kyler Murray 3,633 0.08
    Carson Wentz 4,053 0.07
    Jalen Hurts 3,326 0.06

    * The average of the gap between fourth-quarter and other-quarter performance and high-leverage and all-other-leverage performance

    Would you look at that: Mahomes sits above the rest of his peers in terms of how well he rises to the situation. And he’s done so across a much greater sample size. Josh Allen has had similar overall production, but it’s been more balanced between the low-leverage and high-leverage spots.

    And lest we think that early-career Mahomes is coloring the picture, his most clutch seasons by this measure are the three most recent.

    An aside on other players

    In looking at this research, I figured I’d poke around to see other interesting trends. 

    Bo Nix has had a lot of “no no no yes” games this year, but his performance from a Total Points perspective hasn’t been appreciably better in big-time situations. The Broncos have averaged fourth-quarter scoring that’s almost a touchdown better than the first three quarters, but Nix hasn’t shown that kind of productivity jump on his own.

    Justin Fields has been one the least clutch quarterbacks this year. He’s basically become less clutch every year he’s been in the league. In general, it’s fair to assume that a player’s clutch performance has an outsized impact on the vibes surrounding his season, and that feels particularly relevant when a player gets benched. 

    Drake Maye and Sam Darnold are obvious counterexamples to that last point, as players who have had really strong seasons so far. Maye has been excellent in low-to-medium leverage and quite poor in high leverage. Darnold has been elite in the first three quarters but the worst quarterback in the league in the fourth quarter.

    Of the players who have been the most clutch by this composite measure this year, Michael Penix Jr. is the only one who has been worse in high-leverage spots (and therefore very good in fourth quarters). He’s run up the score or turned it on in garbage time but has not risen to the big moments.

  • A Midseason Review of the Micah Parsons Trade

    A Midseason Review of the Micah Parsons Trade

    Photo: Matthew Pearce/Icon Sportswire

    Now that the dust has settled, we can start to examine the impact of the Micah Parsons trade that happened this offseason. Both teams are experiencing significant changes with their defense this season and not only in terms of results like pressure rate and success rate, but also with how they are structured and operate as a unit. Green Bay’s decision to acquire Parsons addressed its pass rush need, while Dallas believes that Kenny Clark will help improve its run defense.  

    With the Cowboys, Micah Parsons was asked to line up all over the defensive formation but was especially effective as a stand up rusher. In 2024, The Cowboys had pressure rates of 12.9% for stand up rushers on the left and 15% for stand up rushers on the right. This year, those numbers are 13.6% and 11.5%, respectively. 

    Sacks aren’t coming as easy for the Cowboys either. Micah was often asked to mug over the A gap, and rushers from that technique sacked the quarterback 3% of the time with a staggering 21.5% pressure rate for the Cowboys. This year, mugging linebackers don’t have any sacks for the Cowboys and they are only generating pressure on 12.5% of passing plays. 

    Parsons’ versatility was a big part of how the Cowboys were able to generate pressure in 2024, and they are changing how they present themselves to offenses to try and make up for it this year. The Cowboys are lining up with stand-up edge rushers more frequently in order to try and conceal where the rush may be coming from. 

    As the Cowboys try to hunt for a comparable replacement strategy off the edge, the player they got in return, Kenny Clark, does not seem to be living up to expectations in Dallas. He has not been the difference-making run stuffer that Dallas had dreamed of, as the Cowboys defense is giving up 0.9 EPA/30 Rushes with him on the field and 0.6 EPA/30 Rushes when he’s off the field. In other words, he is not improving their run defense like the Cowboys had hoped. The last five games they’ve allowed an average of nearly 170 rushing yards allowed.

    Additionally, the Cowboys are significantly worse against the pass when Clark plays as well, giving up 9.0 EPA/30 Passes when he is on the field and -0.6 EPA/30 Passes when he’s off the field, yet the Cowboys are still playing him on 68% of passing downs. 

    Conversely, and as expected, Micah Parsons is transforming the Packers passing defense. He is a major factor against the pass, as the average EPA/Play on passing downs is nearly a full 0.1 per play better when he is on the field. The Packers’ defense also performs better as a unit against the run while he is in, allowing -3.6 EPA/60 Plays when he is on the field and -2.4 EPA/60 Plays when he isn’t.

    In tangible terms, he is more than doubling Kenny Clark’s pressure percentage as a pass rusher with a 23% pressure rate compared to Clark’s 9%.

    It remains to be seen who will ultimately prosper the most from this trade as the Cowboys are owed multiple first-round picks. But the initial returns have an immensely positive effect for Green Bay as the Packers have ultimately found their star pass rusher while maintaining success against the run. Meanwhile Dallas not only failed to improve its run defense, but is now struggling to replace the passing rushing success it once had with Parsons.

  • The Best 4th Down Decision Maker is Still in Detroit

    The Best 4th Down Decision Maker is Still in Detroit

    The NFL is often referred to as a “copycat” league, and the trendsetter this time around is Dan Campbell. Campbell is not the NFL’s most recent head coaching hire, but his aggressiveness on 4th down is now catching on with the rest of the league. Turns out, it’s hard to stop a team when they are playing with four downs instead of three.

    Surprisingly, other NFL teams have been more efficient than the Lions, in addition to going for it more frequently. Does that mean Dan Campbell is no longer the King of Fourth Down? Let’s find out.

    Who’s the Best on 4th Down?

    When you remove 4th down tries with a less than 10% chance of winning, the Lions lead the NFL in attempts dating back to the beginning of last season with 39. They converted on 67% and their attempts averaged 2.7 eventual points on drives with a successful conversion.

    Despite its reputation, Detroit has not been the most efficient team in the league on 4th down. The Commanders have been especially impressive over the last season and a half. Let’s take a look at the top five most efficient teams on fourth down dating back to the start of 2024.

    Team 4th Down Attempts Avg Yards to Go 1st Down Rate Score Rate Eventual Drive Points
    Commanders 26 2.8 85% 77% 4.3
    Chiefs 30 1.7 77% 60% 2.9
    Eagles 37 3.1 73% 54% 2.8
    Bills 25 2.0 73% 54% 3.5
    Buccaneers 16 2.4 69% 63% 3.4

    Washington’s efficiency on 4th down has been remarkable, and the other teams in the top 5 are interesting as well. All of these teams have great quarterbacks that can get first downs in the air or on the ground.

    The Commanders, Bills, and Buccaneers have made the most of their successful 4th down conversions. They have the highest averages of eventual drive points across the NFL at 3.4 and above.

    The main takeaway here is that you’ll have a much better chance of converting on 4th down when you have a great quarterback. If you are a struggling team that doesn’t have a franchise guy under center, maybe it’s better to punt or take the points.

    Field Position Value

    Detroit’s 4th down reputation is also interesting when you take the field position into consideration. The Lions tend to go for it right around their opponents 29 yard line, which is tied for the second-closest average with the Texans, and slightly behind the Vikings. So the Lions aren’t necessarily a team that is making these big aggressive moves on their own side of the field, but are doing so in a more calculated manner when looking to score points. 

    Not only that, but Dan Campbell and the Lions understand that it’s more difficult for their opponents to score when they have to drive the length of the field.

    Across the NFL, teams averaged 1.7 points when the drive started at its own 30. That number jumps to 2.4 when they get to midfield, and again when they get to the opposing 35 (2.8).

    The Raiders have the highest average yards to the end zone at 46.4, and they’ve only converted on 47% of their tries (fourth-worst). So far in 2025, they have 7 attempts with a 52.4 average yards to the end zone, so they haven’t made any adjustments.

    A few other teams that play risky include the Cowboys, Cardinals, and Giants. They tend to go for it when they are roughly 42-43 yards from the end zone. New York has been the most successful (58% first down rate), but all three teams only scored on 43% or below of those drives.

    The difference between the Raiders and the Lions is that Detroit is going for it roughly 17 yards closer to the end zone. That 17 yards is worth more than one point on average per drive.

    Kicking Impact

    Kickers and punters play a massive role in every game, whether it’s field goals, extra points, kickoffs, or punts. Field goals get most of the attention because they directly add (or don’t add) 3 points to the score, but the other kicks are still impactful, just in more of an indirect way.

    Thanks to Ryan Rubinstein’s study of the NFL’s kickoff rule changes, we know that the average drive start is still around the 29 yard line in 2025. Touchbacks kicked into the end zone bring the ball out to the 35, but the increase in kick returns have kept the average drive start in the same range as last year.

    Another hot topic this year is the increased field goal distance, highlighted by Brandon Aubrey’s record of 5 60+ yard field goals. When you have a kicker with a range like Aubrey’s, it could impact your decision to go for it on 4th down. The decision could be either to go for it in your own territory to try and get within range, or kick it since you are already in it.

    It also helps to have a great punter that can pin the opposing team inside its own 15 yard line. The eventual net drive points from drives with 85 yards to go is an average of 1.1. It’s around 2.4 points when you are close to midfield, and around 3 points at the opponents 35 yard line.

    The current leader of punts inside the 20 and 10 yard lines is none other than the Detroit Lions’ punter, Jack Fox. Fox has 22 total punts on the year, with 13 ending up inside the 20, and 7 inside the 10.

    Dan Campbell’s Mastery of 4th Down Decisions

    Most people around the NFL will point to Dan Campbell and the Lions when it comes to the increase of 4th-down attempts across the NFL. That might make you think that they go for it all the time, which isn’t totally wrong, but it’s also not the entire truth.

    They are still the top team in 4th down attempts dating back to last season, but other teams have caught on.

    Detroit is not the leader in 4th down attempts in the early goings of 2025, and they aren’t the most efficient team either. The Chiefs lead the NFL in 4th down attempts prior to Week 8 with 14, while the Lions have 9. The Commanders have kept up their efficiency this year, converting on 80% of attempts, but they only have 5. The Chiefs converted on 79% of their league-leading attempts, and the Patriots have an 82% first down rate on their 11 tries. Detroit has picked up a first down 67% of the time, which is average compared to the rest of the league.

    Despite not being the league leader in attempts or conversions, the Lions are still making great decisions whether they convert or not. When they don’t go for it, they are pinning their opponent deep in their own territory, giving their defense more opportunities to get a stop.

    There are so many different variables in place when it comes to 4th downs, but if you’re doing it like Dan Campbell, you are doing it right.

  • State of the Steel Curtain: Paid To Be The Best, Still Getting There

    State of the Steel Curtain: Paid To Be The Best, Still Getting There

    Photo: Mark Alberti/Icon Sportswire

    The Steelers are sitting at a surprise 4-1 and leading the AFC North after the first 6 weeks of the season. This is even more of a surprise when considering the subpar performance on defense the first two weeks, allowing 32 points on 394 yards to the Jets and 31 points (24 on offense) on 395 yards to the Seahawks.

    At a cool $163.1 million, the Steelers defense is the highest paid in the league by $23 million. At that price tag, relinquishing 30 points in back-to-back games to start the season is unacceptable.

    Since then, this unit has been able to rebound and only allowed 14, 21, and 9 points over the last 3 games. After struggling in both the run and pass phases the first two weeks, it has been able to settle in just in time for a stretch in which the team will see a string of potent offenses (leaving a Joe Flacco-led Bengals offense to your imagination).

    How exactly has the defense improved? Will it be sustainable against better competition? Is the Steel Curtain back? Only one of these is a definitive no, but let’s dive into the former two.

    Looking at things from a personnel perspective, the Steelers defense has primarily utilized three groupings. However, the allowed success rates vary drastically.

    Personnel Grouping Usage % Usage Rank Success % Success Rank
    3-3-5 30% 9 57% 31
    2-4-5 29% 14 40% 8
    3-4-4 27% 5 41% 15

    Obviously, the 3-3-5 has yielded the worst results. This the result of the pass defense, which has allowed a 58% success rate in this grouping, the 4th worst in the league. This result is in stark contrast when compared to the 2-4-5 in which the Steelers defense allows a 33% success rate against the pass, which is good for 5th in the league.

    When looking at men in the box, the Steelers may want to consider simplifying things a bit.

    Men in Box Usage % Usage Rank Success % Success Rank
    7-Man 25% 25 34% 1
    Light (< 7) 49% 16 54% 32
    Stacked (> 7) 26% 8 48% 26

    The Steelers have the most success in the league when operating out of a 7-man box. They are the worst and 7th-worst when operating out of a light and stacked box, respectively. This is not lopsided either in regards to the run or the pass, as they are 1st and 5th out of a 7-man box and 2nd- and 4th-worst with a light box in success rate allowed against the run and pass, respectively. Essentially, adding in the extra defensive back has not yielded the dividends that they hoped to get thus far.

    Last season, the Steelers blitzed at a 25% clip, the 15th-highest rate in the league. So far in 2025, they are at a 35% rate which is the 3rd-highest in the league. Not only are they blitzing more, but they are also playing man coverage 39% of the time, the 7th-highest rate.

    Yes, Blitzburgh might be back, but this isn’t the zone blitz that legendary defensive coordinator Dick LeBeau utilized time and time again with the great defenses of the early 2000s. Adding veteran corners Jalen Ramsey and Darius Slay to the fold has allowed the defense to bring the heat and put those guys on islands against guys like Justin Jefferson and Jaxon Smith-Njigba. And Joey Porter Jr. has recently come back from injury and will play into the mix going forward.  

    Overall, the Steelers are pressuring the quarterback at a 39% rate, the 10th-highest in the league. When bringing the blitz, they are getting pressure 55% of the time, good for 6th. When bringing the standard 4-man pass rush, that number drops to 30%, only the 22nd-best.

    So far, T.J. Watt has been solid, but has not produced to his standard Defensive Player of the  Year type numbers. He ranks 18th in pressures with 21 and his 3.5 sacks are tied for 23rd. He has a pressure rate +/- of -2%, meaning that he should be applying pressure more than he is given factors like his alignment, game situation, etc. 

    Watt has struggled with his bull rush move this year. He has used it the most out of his repertoire, but has yet to log a pressure when utilizing it. The speed and speed-to-power rushes are where he has made his hay thus far, logging a total of 10 pressures and 2.5 sacks.

    The pass rusher who has made the most noise this year is Nick Herbig, whose role increased after Alex Highsmith was injured in Week 2. Herbig is 6th in Pass Rush Total Points and is tied for 8th in sacks with 4.5. 

    Herbig’s speed rush is his go-to as he has given it a go on 30 pass snaps and has generated 5 pressures and a sack. After this, he has a pretty robust repertoire where he has attempted 6 other moves at least 10 times this year. The inside cross, cross chop, and rip moves have all generated at least 3 pressures for him this season and an additional 2 sacks. He’s trying the rip much more often, though, so his success rate has not been as good with that move.

    The defensive line is what has been the main issue early on for this unit. With Cam Heyward sitting out the majority of camp and rotating in some young guys like Derrick Harmon (who missed the first two games), Yahya Black, and Logan Lee, the Steelers needed guys like Keeanu Benton and Isaiahh Loudermilk to step up.

    Early on, they did not do that, as both of them had negative Total Points Above Average in Run Defense, the lowest values on the team through the first two weeks. Benton was also a negative in pass rush. Both of these guys were getting blown off the ball and unable to disrupt any runs that came their way. The struggling interior was the main culprit of the vulnerabilities in the run game.

    Derrick Harmon has now made his debut and has contributed 3 tackles for loss. Benton has also improved slightly in the run game, but he has made his presence felt on the pass rush, accounting for 1.5 sacks in the last 3 games.

    Overall, this defense has begun to show flashes of the top unit it intends (and is paid) to be. The growth of Harmon and Black will help fortify the trenches for the likes of Patrick Queen and Payton Wilson to roam free. The returns of Alex Highsmith and Joey Porter Jr. will bolster a pass defense that is looking to attack the quarterback while playing man on the back end. There are plenty of tests to come, the question is: Will this unit be able to cash in?

  • Ravens, Bills, Packers Line Injuries Can Have A Major Impact

    Ravens, Bills, Packers Line Injuries Can Have A Major Impact

    Photo: Frank Jansky/Icon Sportswire

    Injuries are an unfortunate part of football and can derail a team’s season before it even gets started. We’ve seen it over the years at quarterback with Joe Burrow and the Bengals. This year, we are also seeing teams suffer after losing key players in the trenches. 

    We’re going to take a look at three teams that entered the season with Super Bowl aspirations who have lost key players on the offensive or defensive lines. The Ravens and Bills have been without their top defensive tackles while the Packers have had to reshuffle their offensive line. 

    Ravens

    The Ravens were hit with a tsunami of injuries before Week 5, but they lost 2 key players on the DL in Nnamdi Madubuike and Kyle Van Noy at an inopportune time after Week 2. We’re going to ignore what happened in Week 5 as the Ravens were missing a majority of their best players on both sides of the ball. We’ll focus on Madubuike because he’s out for the season with a neck injury, while Van Noy was able to return in Week 5.

    Madubuike was on pace to have another great season in 2025. After 2 weeks, he ranked 3rd in Pass Rush Total Points and was above average in Rush Defense Total Points among defensive tackles. 

    The table below shows the impact of Madubuike on the Ravens defense through the first four games: 

    On Field Off Field
    EPA/60 Plays -6 16
    Pressure % 37% 25%
    AVG Rushing YBC 1.3 1.9

    The Ravens defense has been 22 points worse with Madubuike off the field (remember, EPA is from the offense’s perspective, so negative is good in this case). Their pressure rate has been cut by a third and the defense is allowing a little more than half a yard more before contact on run plays.

    Part of this is due to the fact that teams are calling more interior runs with Madubuike absent. The 2025 league average rushing YBC on inside and outside runs is 1.2 and 1.5, respectively. Madubuike’s impact is clear as they’ve gone from league average to well below league average on rushing YBC. 

    The table below clearly shows the impact of his absence on opposing offensive coordinators in terms of run direction.

    Opponent Run Direction with and without Madubuike in 2025

    On Field Off Field
    Inside 17% 48%
    Off Tackle 48% 37%
    Outside 35% 15%

    In the first two games, the Bills and Browns were trying to attack the edges in the run game to avoid the impact of Madubuike up the middle. The Lions and Chiefs didn’t have that problem and chose to test the depth of the Ravens interior, especially the Lions. Ravens DTs ranked 26th in Pass Rush and Rush Defense Total Points in the two games after Madubuike’s injury. 

    The Lions ran Duo 15 times against the Ravens for 156 yards and 2 touchdowns. Duo is an interior run predicated on hard doubles on the defensive line that get pushed back into their linebackers to create rushing lanes. The Lions and OC John Morton called it over and over again as the Ravens had no answer while missing their defensive stalwart on the interior. 

    Kyle Hamilton and Roquan Smith lead the back 7 of that defense and both missed last week’s game. The Ravens are experiencing an injury crisis on the defensive side of the ball similar to what we saw with the Lions at the end of last season. They still have time to salvage the season, but they will need to get healthy to overcome the massive loss, literally and figuratively, of Madubuike in the middle of their defense. 

    Bills

    Another great AFC DT has missed time this year, Ed Oliver for the Bills. Oliver is hopeful to return this week after suffering an ankle injury in Week 1 that caused him to miss the last 4 games. 

    Unlike the Ravens, the Bills have had a relatively easy start to the season allowing them to start off 4-1 despite some key injuries on defense. However, the Bills have Super Bowl aspirations and they will need to address some issues if they want to achieve their goals. 

    The Bills’ run defense has been a problem to start the year. Through 5 weeks, it has given up 728 rushing yards at an average of 5.6 yards per carry, both ranked in the bottom 5. The Bills have been able to mitigate this problem so far with splash plays. They are tied for 10th with 17 tackles for loss and have recovered 2 fumbles. 

    Oliver is more of a threat as a pass rusher, but his loss exposes some lack of depth in terms of interior run defense. 

    Against the run, four other Bills defensive tackles have been 2 points below average in 2025 (per Total Points), while Oliver has been a smidge above average since the start of 2024. 

    The 4-1 Bills don’t need to panic like the 1-4 Ravens, but they will need to find answers to tighten up the run defense and they do have the luxury of time to find those answers, internally or externally. The last thing Buffalo needs come playoff time is a defense that can’t get off the field and leaves Josh Allen stranded on the sideline. 

    Packers

    To the offensive side, the honeymoon phase for the Packers after the Micah Parsons trade appears to be over. Despite hopes and talks of a perfect season, the Packers find themselves at 2-1-1 coming off a well-timed bye week, which is rare to say for a Week 5 bye. 

    The Packers have invested a lot of resources into their offensive line. They rewarded RT Zach Tom with a lucrative contract extension this offseason and also brought in LG Aaron Banks in free agency from San Francisco. 2024 1st-round pick Jordan Morgan and 2025 2nd-round pick Anthony Belton both entered the season as backups to solidify a strong unit on paper. Despite all the resources invested, they are struggling with injuries to Banks and Tom. Belton getting injured while filling in only complicated matters. 

    Offensive line depth in the NFL comes at a premium. Even the Packers struggle to replace their starters despite having young, early draft picks on their bench. The injuries have caused drastic changes to the Packers offense. The table below shows the effect of a depleted offensive line:

    Week 1 & 2 Week 3 & 4
    ADoT 12.8 (1st) 3.9 (31st)
    OL Blown Block% 1.5% (4th) 4.4% (19th)
    Sack% 3.5% (6th) 7.8% (23rd)
    OL Total Points per play 0.21 (6th) 0.11 (25th)

    The first thing that really popped out to me was the drastic decrease in throw depth along with an increase in sack percentage. The first two weeks of the season, Jordan Love and the Packers were pushing the ball downfield and avoiding sacks. The next two weeks with a depleted offensive line? The exact opposite. 

    This table shows how important the offensive line is in establishing an identity for your offense. In certain situations it can have a similar effect to losing your quarterback.

  • Nevermore? The 1-3 Ravens’ Playoff Path

    Nevermore? The 1-3 Ravens’ Playoff Path

    Photo: William Purnell/Icon Sportswire

    Prior to the season kicking off, the Baltimore Ravens were +400 to win the AFC. Those were the second-best odds behind only the Buffalo Bills, to whom they lost in the opener despite having a 99.1% win probability with 8:36 to go in the fourth quarter. Since then, not much has gone their way and they stand at 1-3 at the quarter pole with injury issues to boot. Even so, ESPN puts their chances of making the playoffs at 70% and their chances of winning the division at 47%, which puts them neck-and-neck with the 3-1 Steelers (71%/46%).

    So, what gives? Let’s start with the fact that, in the past ten years, there have been 11 instances of 1-3 teams going on to make the playoffs. The 2024 Rams were the most recent team to do so, and the Patriots, Steelers, and Eagles all cracked the playoffs in 2021 after dropping three of their first four. That said, 88 teams have gotten off to a 1-3 start over that period, so very few of them have reached the postseason. Put another way: it may not be uncommon, but it is unlikely.

    How teams that started 1-3 finished (2015-2024)
    1-3 Teams 88
    Made Playoffs 11
    Percentage 12.5%

    Now let’s deal with the particulars: The Ravens are dealing with quite a few injuries at the moment and have a two-game homestand before their bye week. Their schedule was a bit frontloaded and is quite soft after the bye, with those first six opponents sporting a combined 8-16 record. All told, they have the sixth-easiest schedule in terms of opponent net EPA/play after the bye – whereas the Steelers have the sixth-hardest – but they certainly don’t want to be 2-4 or 1-5 heading into it.

    In the meantime, they’re missing a lot of key contributors. Nnamdi Madubuike has been ruled out for the season, and several starters did not participate in practice on Wednesday: quarterback Lamar Jackson, left tackle Ronnie Stanley, cornerback Marlon Humphrey, linebacker Roquan Smith, and cornerback Nate Wiggins. 

    With the exception of Wiggins, who currently ranks 7th among corners in Pass Coverage Total Points/snap, all those players are tenured Ravens who have combined for roughly 5 wins above replacement (WAR) over the past two seasons. That’s a lot of firepower missing, with Jackson deemed ‘unlikely’ to play against the Texans, and Humphrey and Smith both expected to miss at least a few weeks with calf and hamstring injuries.

    Assuming they can tread water over the next few weeks, they’ve got some things they’ll have to clean up moving forward. With the caveat being that they’ve faced some of the best passing offenses in the NFL and also the Chiefs, some of their defensive efficiency numbers aren’t the best.

    Defensive coaches usually soapbox about tackling, stopping the run, preventing big plays, getting offenses into long down and distances, and creating turnovers, and the Ravens check only one of those boxes. They rank 6th in broken + missed tackle rate, but rank 27th in EPA allowed/rush, have neither forced nor recovered any fumbles, and have just 1 interception to 3 dropped interceptions. 

    Worse though is the fact that opposing offenses have consistently been in manageable situations. In terms of opponents’ average distance to go on 2nd and 3rd down, the Ravens defense is in the 8th and 15th percentiles, respectively, of all defenses since 2016. That probably has something to do with them allowing a 43% 3rd down success rate, which is 6th percentile over the same timespan. Put more simply: opposing offenses have stayed on schedule and converted 3rd downs at a high rate accordingly.

    There’s also the problematic dynamic of giving up a lot of big plays and not generating any to offset them. The Ravens pass D ranks 30th in boom rate (offensive plays which generate 1+ EPA) and 30th in bust rate (offensive plays which generate -1 EPA or less), which isn’t a great combination. Part of this is they’ve seen the second-most passes of 15+ air yards and have given up the third-most EPA on those passes. They had this problem last year in the aggregate, but corrected in the second half of the year when they ranked 3rd in boom rate and 2nd in bust rate from Week 10 onward.

    Ravens Pass Defense: Big Play Breakdown (2025)
    Big Play Type Rate Rank
    Boom (big play for O) 31st 30th
    Bust (big play for D) 30th 30th

    On the offensive side of the ball, there have been some bad breaks in big games. The Derrick Henry fumbles were particularly unfortunate considering that he had fumbled just three times in the two previous seasons, and Baltimore lost a total of 36 percentage points of win probability on his fumbles against Buffalo and Detroit.

    Matters were made worse by two three-and-outs against the Bills (-17% WPA) and one against the Lions (-14%), and the Ravens offense has just generally taken a downturn in 4th quarters this year. They’re the 7th-best offense in EPA/play through the first three quarters, and the 22nd-best in the 4th quarter. Stripping out turnovers lifts all offenses, but doing so suggests that theirs have been particularly untimely because their 4th quarter EPA/play looks pretty comparable.

    There are also some run game balancing issues. Last year, they were top six in success rate on both zone and gap runs and were top 10 in gap usage, but this year they’ve skewed zone-heavy and have simultaneously fallen to 27th in zone success rate. And we should beware of small samples, but Derrick Henry is also tracking for the lowest broken + missed tackle rate of his career at just 4%.

    The Ravens’ margin for error going forward is slim, especially in light of the injuries they’ve sustained. However, most 1-3 teams have not been as talented as Baltimore and have not had a two-time MVP quarterback. This is also a particularly weak division with Joe Burrow being out and the Browns being in, so the potential to claw back from down two games is there. Some of this stuff should work itself out over the long-term (e.g. fumble luck on both sides of the ball), but they’ll have to win more early downs on defense, which they should be able to do against their remaining schedule. But first, they have to get to the bye in one piece.

  • Study: The Impact Of The NFL’s Kickoff Rule Changes

    Study: The Impact Of The NFL’s Kickoff Rule Changes

    Through one month of the NFL season the changes to the kickoff have seemingly divided football fans. This year, the NFL decided that a touchback that first lands outside the landing zone (20 yard line back to the goal line) is brought to the 35 yard line rather than the 30 yard line like in 2024.

    Is one minor change producing higher return rates, better average field position, and shorter kick hang times? Kickers are even kicking the ball in different ways to try and combat excelling return rates. We’ll look back and compare to last season to see just how much things have changed. 

    Kick Type

    The 2025 season has featured the highest use of non-normal kick types on kickoffs that we have seen. At SIS, we track kick types, and we classify a “normal” kickoff as a kick with a typical trajectory having a hang time between 3.3 – 3.8 seconds. 

    Through the first four weeks of the season, there has been a non-normal kick on 28% of kickoffs (not including squib or onside kicks). Comparatively in 2024, there was a non-normal kick on only 7% of kickoffs. Kickers are actively reducing their hang time and changing the way they kick the ball to either add or take away spin. 

    Hang time

    The increased frequency of line drive kicks is manifesting itself in the hang time as well. During the 2024 season, the average hang time on NFL kicks was 3.86 seconds. Through the first month this season, the average hang time is down to 3.37 which is about half a second shorter than last season. The difference between 2024 and 2025 gives kick returners more opportunity to create explosive returns with increased return lanes available. 

    The average hang time the two seasons before the Dynamic Kickoff was implemented was 4.00. A big part of this is the kicker allowing the ball to hit the ground before it can be caught by the returner, which in turn gives the kick coverage more time to cover potential return lanes. 

    Even if you look within a given kick type, the kicks are spending less time in the air. On non-line-drives, the average hang time is about a third of a second shorter than it was a year ago.

    Returns

    The decreased hang time on kickoffs is encouraging teams to take a chance and return the ball at a much higher rate than 2024. Last season 65% of kickoffs resulted in touchbacks, whereas so far in 2025 only 17% of kickoffs have resulted in touchbacks. 

    However, the results of returned kicks have been basically the same. The average length of returns are slightly down from last year (27 yards in 2024 and 25 in 2025). That’s made up by the average start of the return increasing from the 2 yard line to the 4 yard line between seasons. With touchbacks outside the landing zone being brought out to the 35, kickers are incentivized to make sure the kick lands in the landing zone thus producing returns at a significantly higher rate and those returns starting slightly farther from the end zone. 

    If you incorporate the touchbacks and returns into a single average, the resulting field position has nudged forward a bit, but not by much. From 2016 to 2024, teams started their drive somewhere between the 23 and 24 yard line on average every year. In 2025 so far, the average is the 26 yard line.

    Injuries

    One of the big talking points around the use of the dynamic kickoff was the potential for getting more action without increasing the rate of injury. Through four weeks of kickoffs, the per-play injury rate has been consistent with previous years, but the dramatic spike in returns leads to more total injuries. 

    SIS has charted more injury events on kickoffs through Week 4 than the previous three years combined. But those have come on a similar increase in returns. If you look per-return, the injury rate is a bit higher than 2023-24 but right in line with 2021-22. 

    Findings

    It’s still early, but a simple change of moving a touchback from the 30 yard line to the 35 yard line is producing some consequential effects in how the game looks, but it may not be changing as much as people initially thought. Contrary to popular belief, the average starting field position for all returned kicks is the 29 yard line, which is the same for both 2024 and 2025. Injuries are up, but that’s just a factor of there being more football happening. 

    One thing we know for sure: return rates are dramatically increasing and kickers are kicking the ball with less hang time in order to keep the length of return down. So far it’s been working.

  • Introducing Our Multi-Year Injury Risk Model

    Introducing Our Multi-Year Injury Risk Model

    Injuries. Everyone hates them, and we all can agree injuries are the worst part of sports. 

    Part of the reason is that injuries can occur when you least expect them, and there are so many different variables that can come into play for why they happen, making it very difficult to accurately predict them. Unfortunately we cannot just turn injuries off like we are playing a game of Madden, and so there can be great value in trying to provide something to base expectations off in terms of how much time a player misses. With our multi-year injury risk model, we aimed to do just that.

    Methodology

    Football can vary greatly depending on what position you play, and so we split our player dataset into three different position groups: offensive skill players, offensive linemen, and defensive players. We also wanted to test various time frames, so we made predictions for the number of games players will miss in one-, two-, and three-year spans. Features incorporated in our dataset include biographical data, injury history data, playing time data, and other stats that convey what the player does on the field.

    We used the XGBoost machine learning framework to build our regression model. For our target variable, to lessen the impact of outlier cases, we took the average of the number of games missed in the next year (or two or three) and the number of games the player was expected to miss based on the injury prognosis (which is something that our injury staff logs for most injuries). 

    Findings

    Games Missed Prediction Error by Position Group and Timeframe

    One Year Two Years Three Years
    Offensive Skill Players 3.6 5.9 7.1
    Offensive Linemen 3.7 5.3 7.3
    Defensive Players 3.7 6.2 7.3

    Root mean squared error (RMSE) was used to evaluate the accuracy of our model. As we can see above, overall, the accuracy is similar across positions, with accuracy predictably being better the shorter the time frame is. However, it can also be argued that the three-year model was the most accurate because when you divide the RMSE by the number of games corresponding to that time frame (i.e. 17 games in one year, 51 games in three), the ratio is smallest for the three-year interval. Therefore, the model predicted games missed for the longest time span with the least error percentage-wise. 

    Average Predicted Games Missed by Position Group and Timeframe

    One Year Two Years Three Years
    Offensive Skill Players 2.2 5.2 7.7
    Offensive Linemen 2.4 6.4 8.2
    Defensive Players 2.1 4.6 6.4

    We observe more of a discrepancy across position groups when examining the average predicted games missed. For all three time intervals, offensive linemen were predicted to miss the most games, followed by offensive skill players, and then lastly the defensive players. This is in line with the trend for actual games missed by position group.

    Top 10 Feature Importances by Position Group

    Here are the top 10 features in terms of importance (how much a feature contributes to a model’s predictions) by position group for the three-year interval.

    Offensive Skill Offensive Linemen Defensive
    1. Snap % in the Slot Snap % Playing Tackle Age
    2. Snaps Blocking Projected Snaps Total Points per Snap
    3. Age Games Missed Past Year Projected ST Snaps
    4. Total Points per Snap Blown Block % Snap % Playing Linebacker
    5. Special Team Snaps Total Points per Snap Special Team Snaps
    6. Snaps in Motion BMI Projected Snaps
    7. Projected Snaps Snaps on Pass Plays Snap % Playing Run Defense
    8. Routes Run Age Snap % Pass Rushing
    9. Games Missed Past 3 Years Games Missed Past 3 Years BMI
    10. Snaps Player was Hit Snap % Playing Guard Tackles Made

    We can see that projected snaps and age were among the most significant for each position group. To dive deeper into why, we ran a comparative analysis between players in the top half of predicted games missed and players in the bottom half.

    Comparison of Key Features for Skill Position Players, by Predicted Games Missed

    The table below shows an example of one of our datasets, skill players in a two-year time span. 

    High Prediction Low Prediction
    Predicted Games Missed, Two Years 6.1 4.4
    Snaps Played Past Season 835 554
    Projected Snaps Next Two Years 1,503 1,045
    Age 26.6 27.4

    We can observe that on average, players who are predicted to miss more games have played more snaps in the previous season, are projected to play more snaps the next two years, and are about a year younger than players who are predicted to miss less games. 

    This pattern was more or less present across all our datasets. At first, this may seem counterintuitive. One could think that older players are more injury prone or that players are projected to play less because they got hurt. However, the data is telling a different story; players are predicted to miss more games when they are expected to also play more games. Playing football is itself a hazard.

    One place where this trend reverses is at the very end of a career. Among the 1,700 players we made predictions for 2025 and beyond, about two dozen players were predicted to miss more games in a two-year period than in a three year one, a finding that was quite confounding at first. However, when comparing these players to the rest of the population, an even larger discrepancy in age existed, with them being three years older on average than their counterparts. The model was picking up signals for when a player was close to retirement and inferring reduced playing time over a three-year span. For these cases, we adjusted the number of predicted games missed in three years to be equal to the two-year number. 

    We observed more trends when taking a look at who our model predicted to miss the most games. 

    Top 10 Players Predicted to Miss the Most Games Over a Three Year Span

    Player Position One Year Two Years Three Years
    Kamari Lassiter, HOU CB 4.0 8.7 14.6
    Rashawn Slater, LAC OT 3.5 9.1 13.7
    Paulson Adebo, NYG CB 4.4 8.1 13.6
    Derek Stingley Jr., HOU CB 3.4 8.3 13.3
    Dalton Kincaid, BUF TE 3.3 9.5 12.9
    Kyle Pitts, ATL TE 2.3 7.0 12.9
    Luke Goedeke, TB OT 3.7 9.1 12.8
    Pat Freiermuth, PIT TE 2.8 8.5 12.8
    Alaric Jackson, LAR OT 3.0 7.8 12.6
    Jake Ferguson, DAL TE 3.2 8.1 12.6

    First, every player was drafted in 2021 or later, keeping in line with the propensity of our model to predict younger players missing more games than older players (in large part because younger players are on the field more). 

    Second, all players had sustained a multi-week injury at some point during the last three years. Indeed, though not as prevalent as the other key features, missed games in past years were greater on average for players in the top half of predictions than for those in the bottom half. 

    Lastly, within the three position groups, our model predicted tight ends, offensive tackles, and cornerbacks to be more prone to injury, and accordingly, everyone on this list plays one of those positions.

    Conclusion

    While attempting something as inherently difficult as predicting the number of games a player will miss due to injury in a given time frame may seem like a lemon that is not worth the squeeze, our study shows there is value in going through the exercise and extracting inferences from the data. Chief among them is that the more a player is on the field, the more he invites risk of getting injured. 

    This is a simple premise, but one that is often more overlooked than it should be, and emphasizes even more just how much we should appreciate players who exhibit extraordinary durability. 

  • World’s No. 1 QB Rankings 2025 – Do We Buy Bo Nix?

    World’s No. 1 QB Rankings 2025 – Do We Buy Bo Nix?

    In the 2024 NFL Draft quarterbacks went early and often, and it didn’t take long to find out why. We saw some impressive rookie campaigns last season and it’s clear that these quarterbacks have bright futures ahead.

    One of those quarterbacks is Bo Nix, who Denver took with the 12th overall pick a year ago. He was actually the sixth quarterback taken in the draft, behind Caleb Williams, Jayden Daniels, Drake Maye, Michael Penix Jr., and J.J. McCarthy.

    Nix went on to finish third in NFL Offensive Rookie of the Year voting, but how much did his play justify that?

    Well, by our World’s No. 1 Quarterback Rankings methodology, he’s pretty much arrived.

    The World’s No. 1 Quarterback Ranking uses our player value stat, Total Points, to make a cumulative evaluation of game performance over a three-year period. The key to our calculation is Points Above Average (PAA), the statistical underpinning of Total Points that is centered at zero so that positive numbers are above average and negative numbers are below average.

    Success over time is key to maintaining a good ranking. Prolonged inactivity results in a ranking drop. The most recent performances carry the most weight.

    Here are the rankings heading into 2025, grouped into tiers:

    Tier 1

    1. Lamar Jackson

    Tier 2

    2. Josh Allen

    3. Joe Burrow

    Tier 3

    4. Jayden Daniels

    Tier 4

    5. Justin Herbert

    6. Patrick Mahomes

    Tier 5

    7. Bo Nix

    8. Jordan Love

    Tier 6

    9. Jared Goff

    10. Baker Mayfield

    You might be able to quibble with the order of some of these names, but the inclusion of Nix here is the most surprising thing. Is that a reasonable assessment of his value?

    Nix’s Rookie Season Stats and Analysis

    The Broncos’ quarterback had some solid counting stats last season, especially his 29 passing touchdowns.

    He also proved he can make plays happen with his legs, picking up 41 first downs by rushing, which ranked 29th among all players, not just quarterbacks.

    Counting stats move the needle for awards voting, but by taking a closer look at Nix’s Total Points and other advanced metrics, we can get a better idea of just how good he was last season.

    First, let’s take a look at some general advanced statistics, with Nix’s rank among the 46 quarterbacks with at least 100 attempts:

    Stat Value QB Rank
    Passing Total Points Per Play 0.166 9th
    Positive Play % 48% T-20th
    Boom % 25% 26th
    Bust % 19% 20th

    * Boom and Bust Rate are the rate of plays gaining or losing at least one EPA, respectively.

    Nix was 9th in Total Points Per Play last season, but he wasn’t particularly consistent, and he wasn’t frequently making splash plays either. You would think that a good quarterback would fit into at least one of these categories, but Nix didn’t last season.

    So why did Nix rank so highly in terms of Total Points? Well for that, we have to dig a little deeper.

    Pass Attempts

    Nix’s average throw depth was 7.3 yards last season, which ranked 27th among QBs. A big reason for this was the number of screens he threw (90, 3rd-most). On non-screen passes, Nix’s average throw depth was 9.7 (tied for 15th).

    There was a solid effort for big plays in Denver, the Broncos just struggled to convert on them. In fact, Nix was 5th in Intended Air Yards, but he ranked a lot lower in completed Air Yards at 17th. Broncos receivers had the fifth-most targets of at least 20 yards, but they posted a 10.3% drop rate (7th-worst). Total Points gives Nix credit for being aggressive downfield, and those drops get credited to him as though they were completed. But he was below average in how often he delivered an accurate throw on those deep targets.

    And finally, his completion percentage was right in the middle of the pack (66%), and his catchable pass percentage was tied for 21st (85%).

    Sack and Turnover Avoidance

    Young quarterbacks tend to struggle with pressures, sacks, and turnovers. Caleb Williams, Drake Maye, and Jayden Daniels all had a sack rate at or above 7.8%, which ranks 34th or worst among quarterbacks.

    This is an area where Nix shined. His sack rate was 3.8%, which was 5th-best in the NFL. He threw 12 interceptions, but he did not lose any fumbles on the year.

    Sacks are drive killers, and they hurt most quarterbacks more than Nix last year. If you exclude sacks from the ledger of every quarterback, Nix’s rank in Passing Total Points per play drops from 9th to 20th.

    Nix is a tough player to sack, despite not forcing a lot of broken or missed tackles like Daniels and Williams. Instead, Nix would find a way to gain positive yardage on a scramble, rather than take a drive-killing sack. He had 49 scrambles last season, which was second-most in the NFL (Daniels had 72). Nix was also the league leader in pass attempts on designed rollouts (65). Combine these with the high amount of screen passes, and you have a good idea of how Denver kept Nix on his feet last season.

    Looking Ahead to 2025

    Is there a sophomore slump in store for Bo Nix in 2025? He still has Sean Payton calling the plays, a stellar offensive line, and some new pass catchers to throw to as well. They got a big upgrade at tight end when they signed Evan Engram, and they drafted Pat Bryant in the third round of the 2025 NFL Draft as well.

    Marvin Mims made some big plays in the second half of last season, and Troy Franklin is also entering Year 2. Denver also added J.K. Dobbins and RJ Harvey in the backfield, which will make defenses have to respect the run.

    One thing Nix will have to deal with this year is that opposing defenses now have a year’s worth of film on him. Screens and designed rollouts can only get you so far. Nix is going to have to prove he can make throws in the pocket and to all three levels of the field.

    Is Bo Nix a Top 10 Quarterback?

    Bo Nix was the 6th QB taken in the draft just a year ago, but are the teams who passed on him already regretting their decision?

    Our advanced metrics show that Nix has desirable traits that Sean Payton’s offensive scheme can take advantage of. However, there are some underlying statistics that make it difficult to rate him as a top 10 quarterback already.

    If you remove screens, Bo Nix drops from 6th to 11th in passing Total Points. He’s willing to push the ball downfield, but he’s not particularly strong at it. From a rushing perspective, he’s got enough mobility to extend plays and scramble for additional yardage, but he’s not evading tackles at an elite rate. That very low sack rate might not hold up.

    Nix could have a very solid career as an NFL quarterback, but let’s not rush to place MVP bets on him just yet.

  • Which NFL Teams Have Been Most and Least Impacted By Injuries?

    Which NFL Teams Have Been Most and Least Impacted By Injuries?

    Photo: Matthew Pearce/Icon Sportswire

    This article has gotten an inordinate number of pageviews and we believe that those clicking on it are looking for the most updated info.

    This article is entering Week 13 of 2025. The original version of this article (covering 2024) is below it.

    Look, if you’ve followed along with the 2025 NFL season, you probably know what team I’m about to focus on here. If the conversation is about the cumulative effect of injuries on a team this year, that starts and ends with the 49ers.

    They already knew they were going to be missing Brandon Aiyuk for much of the season, and from that point have also sustained injuries to Nick Bosa, George Kittle, Fred Warner, Ben Bartch, Brock Purdy, and Ricky Pearsall, among others. As a result, they’ve lost the most potential productivity to injury of any team in the NFL.

    Most Value Lost To Injury, 2025 NFL season (through Week 13)

    Team Games Missed Total Points Missed
    49ers 206 156
    Cardinals 177 151
    Bengals 115 142
    Commanders 143 136
    Dolphins 169 123
    Bills 212 123
    Giants 192 116
    Buccaneers 186 116
    Falcons 140 114
    Chargers 194 109
    Saints 152 103
    Panthers 133 95
    Colts 176 91
    Lions 226 89
    Bears 240 84
    Steelers 183 83
    Ravens 128 73
    Chiefs 123 71
    Jaguars 110 70
    Texans 167 65
    Packers 157 64
    Titans 116 63
    Vikings 122 63
    Cowboys 177 62
    Raiders 62 57
    Jets 130 54
    Seahawks 160 53
    Broncos 128 49
    Eagles 111 40
    Browns 113 35
    Rams 97 35
    Patriots 107 25

    The value we’re measuring here is each injured player’s Total Points per game over his previous 17 games, multiplied by the number of games missed due to injury. This only counts injuries sustained since August 1.

    The Walking Wounded

    The Bengals have had substantially fewer total games missed to injury, but Joe Burrow’s loss alone cost them as many points as half the teams in the NFL have suffered in total this year. Without that injury they’d rank in the fortunate half of teams.

    The Commanders are at the top of this list because of Jayden Daniels’ injury-plagued season. But they have also missed wide receiver Terry McLaurin, running back Austin Ekeler, safety Will Harris, and defensive end Deatrich Wise.

    Kyler Murray’s injury has not affected the Cardinals’ fortunes as much as you’d think because backup Jacoby Brissett has been more than serviceable, but he still ranks among the most impactful injuries of the year by Total Points. Running back James Conner has been a favorite of Total Points for a little bit now, so his absence also looms relatively large.

    Others Receiving Votes

    A training camp injury to tackle Rashawn Slater started the ball rolling early for the 10th-ranked Chargers, and the hits kept coming as opposite tackle Joe Alt has dealt with multiple ailments. Los Angeles has more games missed than all but the 49ers and Bills in terms of Total Points missed.

    The Lions and Bears have the most games missed due to injury in the league, but they rank just 14th and 15th respectively in Total Points missed. They’ve been fortunate to not have their biggest names go down so far this year, although the Lions’ fortunes have turned a bit recently with injuries to Sam LaPorta and Amon-Ra St. Brown. 

    Dodging Raindrops

    The Patriots and Rams are the most fortunate teams so far in terms of health, which sheds a little light on their strong showings this year. The five teams with the fewest Total Points missed due to injury (adding in the Browns, Eagles, and Broncos) are currently a combined 41-20, compared to 24-37 from the top 5 teams.


    ——————————————————–

    For those curious, this is the original version of the article, which is through 2024 Week 16

    By Brett Barnes

    As we finish out the final two weeks of the regular season, we can take a look back at the amount of injuries that each team has had to endure throughout this 2024 season. While the sheer amount of injuries a team has to deal with certainly takes its toll, most of the time the quality of players being lost is the more important variable. 

    When a team’s depth is tested, fans can really see the caliber of coaching staff and front office their organization has. The Lions are a great example this season of being a team that hasn’t missed a beat while dealing with a ‘next man up’ mentality all season. They top the NFL with the most Total Points missed due to injury this season.

    Most Total Points Missed Due To Injury

    Team Total Points Missed due to Injury
    Lions 158
    Saints 149
    Browns 141
    Buccaneers 136
    49ers 132
    Raiders 119
    Panthers 117
    Steelers 109
    Texans 108
    Titans 101

    Along with the Lions, the Buccaneers, Texans, and Steelers find themselves in the middle of the playoff picture while dealing with a lot of talent loss during the season. 

    That number will continue to grow for the Texans as they lost one of their best playmakers in Week 16 to a gruesome left knee injury. Tank Dell has had a nice connection with QB C.J. Stroud since the two made their NFL debuts together last season. Dell missed the end of last season after breaking his fibula on that same leg in Week 13. 

    The Texans passing offense took a big hit when he wasn’t on the field last season. 

    Houston Texans in 2023 (Through Week 16)

    Dell On the Field Dell Off the Field
    EPA/60 Plays 4 -6
    EPA/60 Passing Plays 9 -4
    Completion % 65.6% 61.5%
    Yards per Attempt 9.2 6.7

    Among players with at least 50 targets, Dell ranked 15th in the league last season with 9.5 yards per target. The Texans were already dealing with the loss of Stefon Diggs and now losing Dell for the very end of the season again can make you wonder if their offense is going to have enough explosiveness to make a deep playoff run (they didn’t score on offense in Wednesday’s loss).

    On a more positive note let’s look at the teams that have been relatively healthy this season. 

    Fewest Total Points Missed Due To Injury

    Bottom 10 Total Points Missed due to Injury
    Ravens 33
    Commanders 34
    Falcons 45
    Eagles 46
    Chiefs 47
    Vikings 49
    Packers 50
    Patriots 50
    Chargers 52
    Bills 55

    Unsurprisingly, health might be one of the biggest indicators of playoff chances a team has in a season, as 9 of the 10 teams listed here are in the playoff chase. That the Patriots are not in playoff contention despite so few injuries shows the talent deficit that the team has been dealing with in 2024.

    There are plenty of examples of the teams on this list keeping key players on the field or getting them back from injury in a reasonable amount of time. For example, the Packers have benefited from their injured players being out for  recently welcomed back 2nd-round rookie linebacker Edgerrin Cooper in Week 15. He missed 3 games with a hamstring injury, but has been one of the most impactful players at his position the past two weeks. 

    The Packers will look to continue expanding his role and have him be an important piece of their defensive puzzle as they head into the playoffs.

    During Weeks 15 and 16 Cooper ranked 8th among all linebackers in Points Saved in pass coverage, 2nd in Points Saved per pass rush, and 17th in Points Saved during rushing plays. He’s shown his versatility these past few games and opposing offenses have felt his presence for the Packers defense all season.

    Green Bay Packers in 2024

    Cooper On the Field Cooper Off the Field
    EPA/60 Plays -6 -4
    EPA/60 Passing Plays -11 -1
    Sack % 9.5% 6.6%

    Cooper is an under-the-radar player who has a chance to make a name for himself in his first season as a pro as the Packers look to build off of their playoff success last season.

    Looking ahead to the playoffs, we can see what teams are going to be missing with the current players on injured reserve. We can also break that down into offensive and defensive players to see if teams are going to be hurting more on one side of the ball. Note where the Packers are:

    Bar graph showing a breakdown of which teams have missed the most Total Points on the offensive side and the defensive side. The point of emphasis is on the Lions, whose losses are overwhelmingly on the defensive side (Aidan Hutchinson).

    It’s been well documented that the Lions defense has been decimated, and that’s represented here. The Seahawks and Steelers are missing more on the offensive side, with most of that being tied to offensive linemen. The Broncos will continue to miss the services of tackling machine Alex Singleton, but the offensive side of the ball remains healthy at the right time of year. 

    Injuries can happen at any time, and we know losing key players can sometimes be too much to overcome. We wish every team a clean bill of health as we head towards the most exciting time of the NFL season.