Sports Info Solutions
Category: Baseball
-
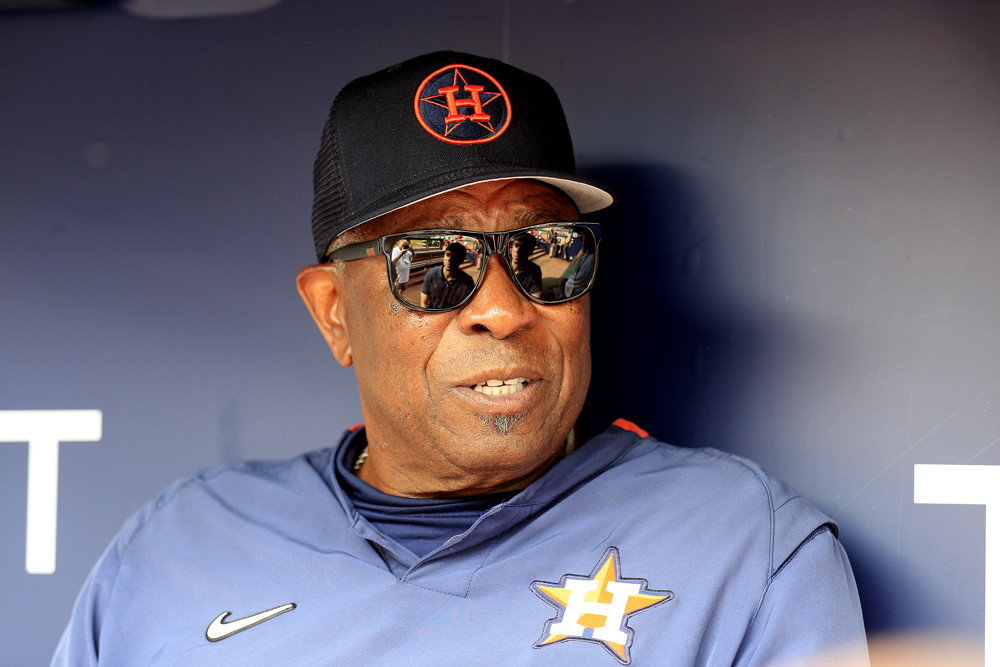
Q&A: Dusty Baker On Analytics Before There Were Analytics, His New Book
By
On Hank Aaron and defensive positioning, why Dusty started a bad hitter in the World Series, and much more
-
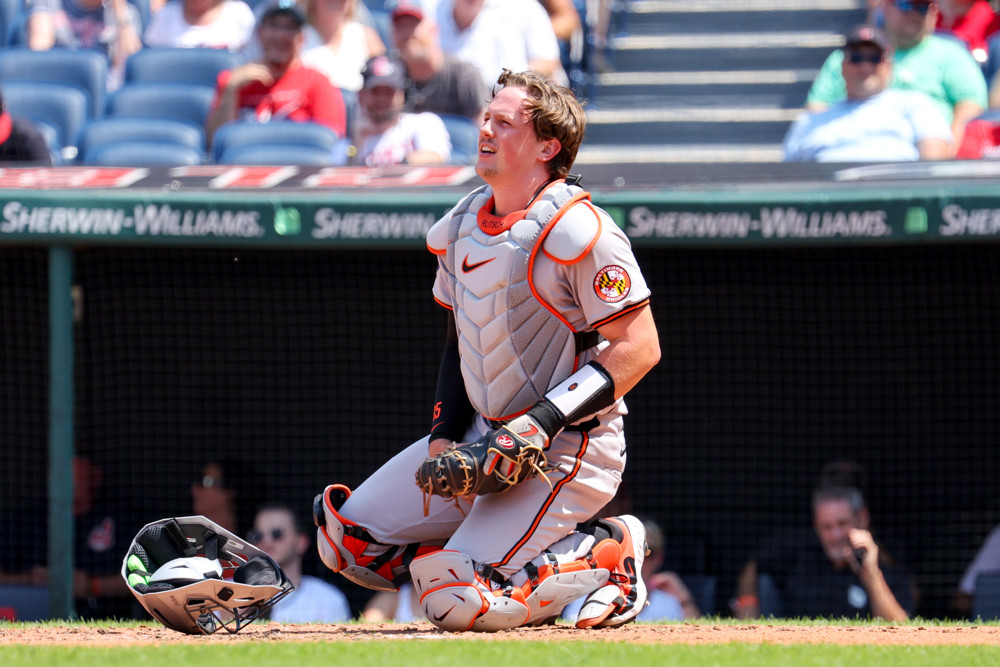
Stat of the Week: How Often Are Catchers Getting Hit With Foul Balls In Bad Spots?
By
Quantifying how catchers are getting hit by foul balls in sensitive spots since the rise of the one-knee-down stance
-
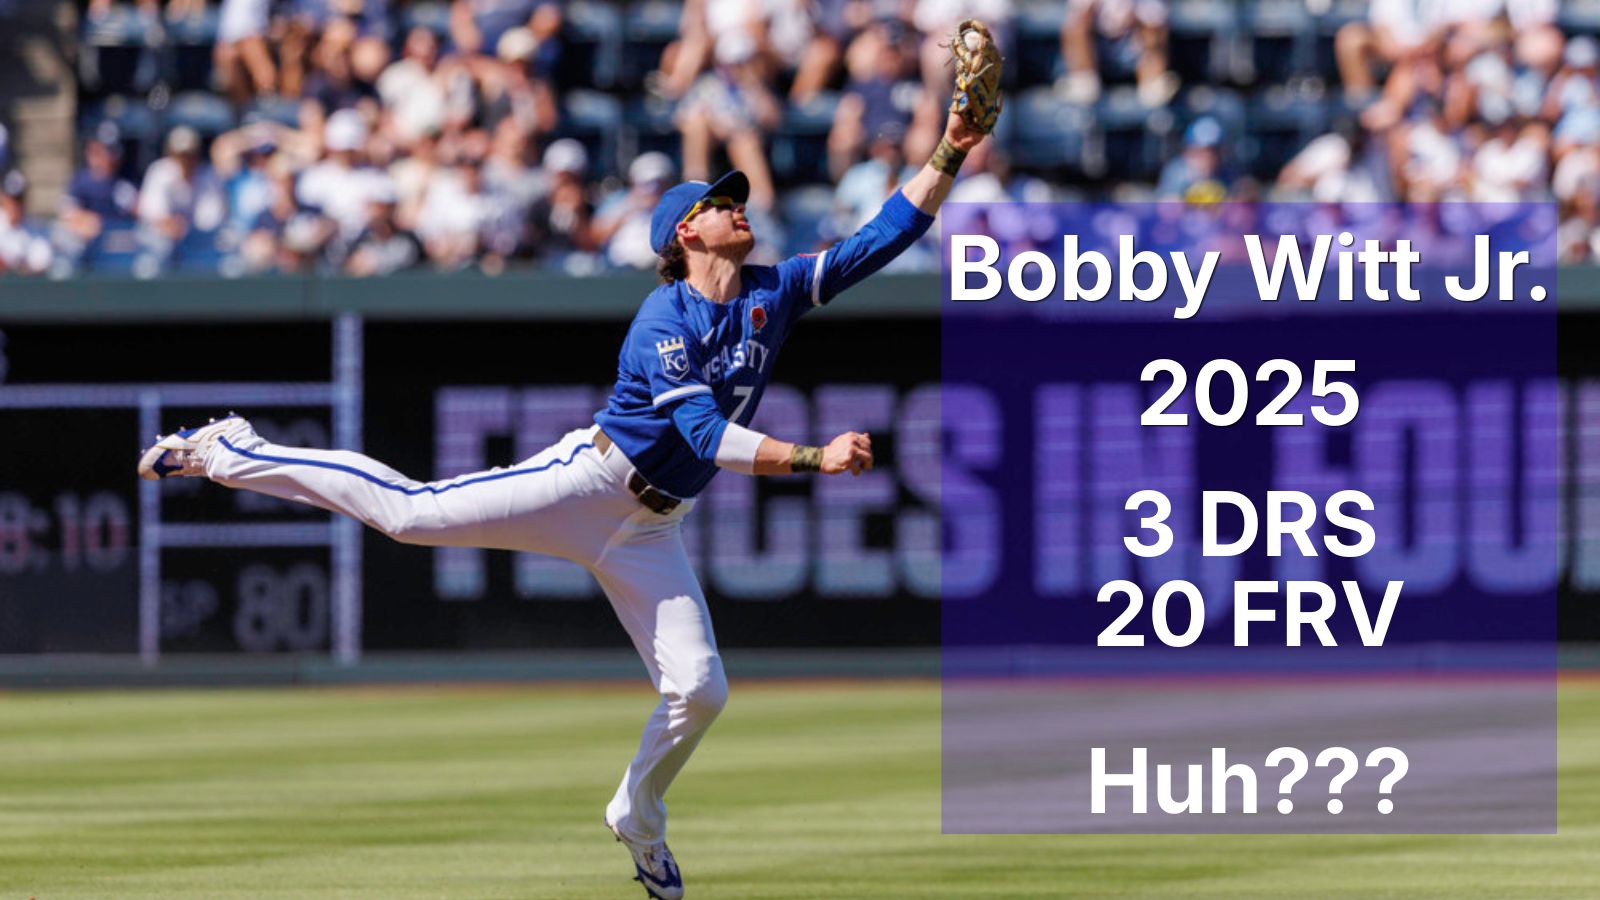
Study: Defensive Runs Saved & Fielding Run Value Are Inching Closer to Each Other
By
Looking more closely at whether the gaps between the stats are converging over time
-
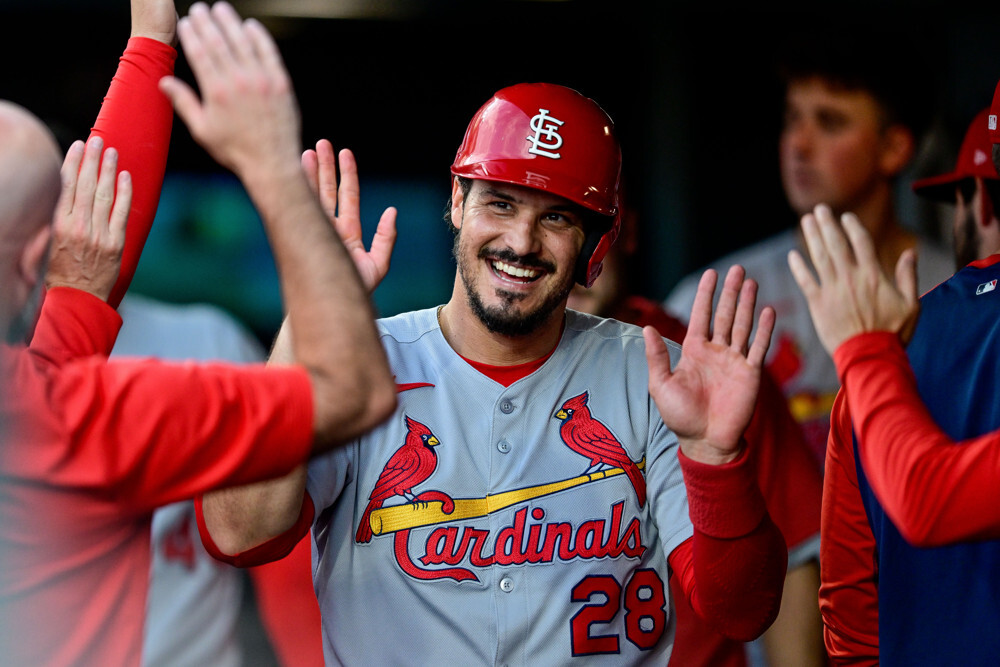
Stat of the Week: The Hall of Fame And Active Players
By
Who are some of those that are on the bubble at the moment?
-
Stat of the Week: Which Team Can Put Out The Best Defensive 9-Man Group?
By
Our version of a ‘best ball’ competition spanning 2003 to 2025.
-
Stat of the Week: New Year’s Resolutions
By
Some players and teams have pretty obvious points of focus in looking ahead to 2026
-
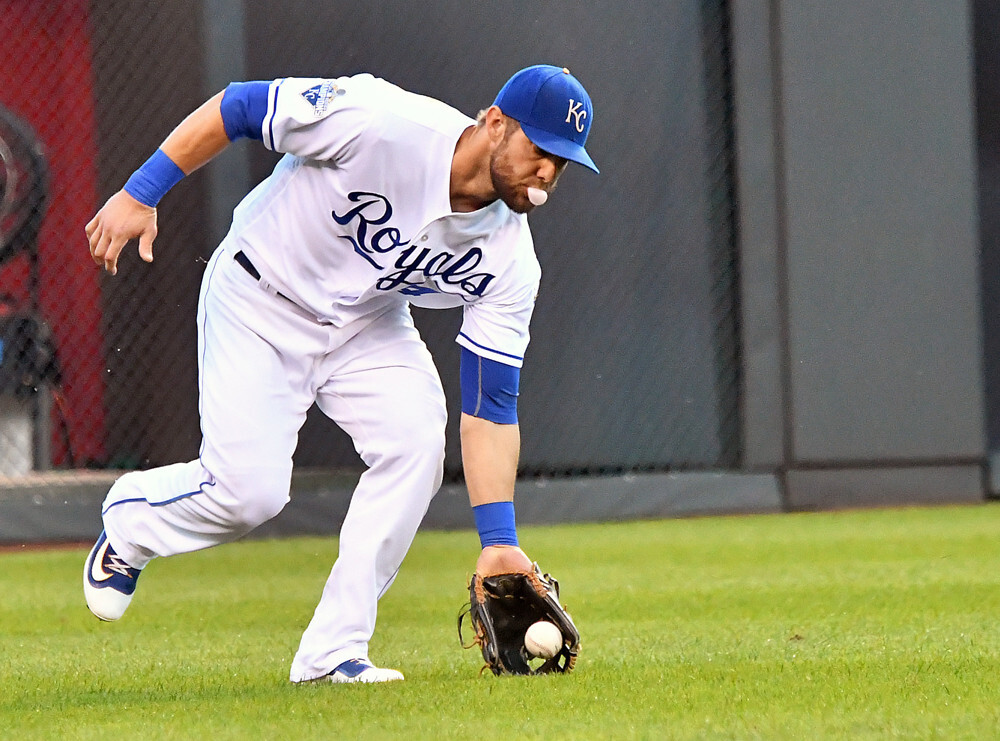
Stat Of The Week: Good To See Alex Gordon On The Hall Of Fame Ballot
By
Photo: Keith Gillett/Icon Sportswire The Hall of Fame ballot came out a few weeks ago and so we’re in for lots of debates and discussions and everything that comes with one of the most polarizing topics in sports. This is not a strong ballot when it comes to first-time candidates, with Cole Hamels the best…
-
Stat of the Week: Top Defensive Players in Free Agency
By
Harrison Bader, Cody Bellinger, Ha-Seong Kim, and … Ranger Suárez are among the players who could bring good defensive value to the teams that sign them.
-
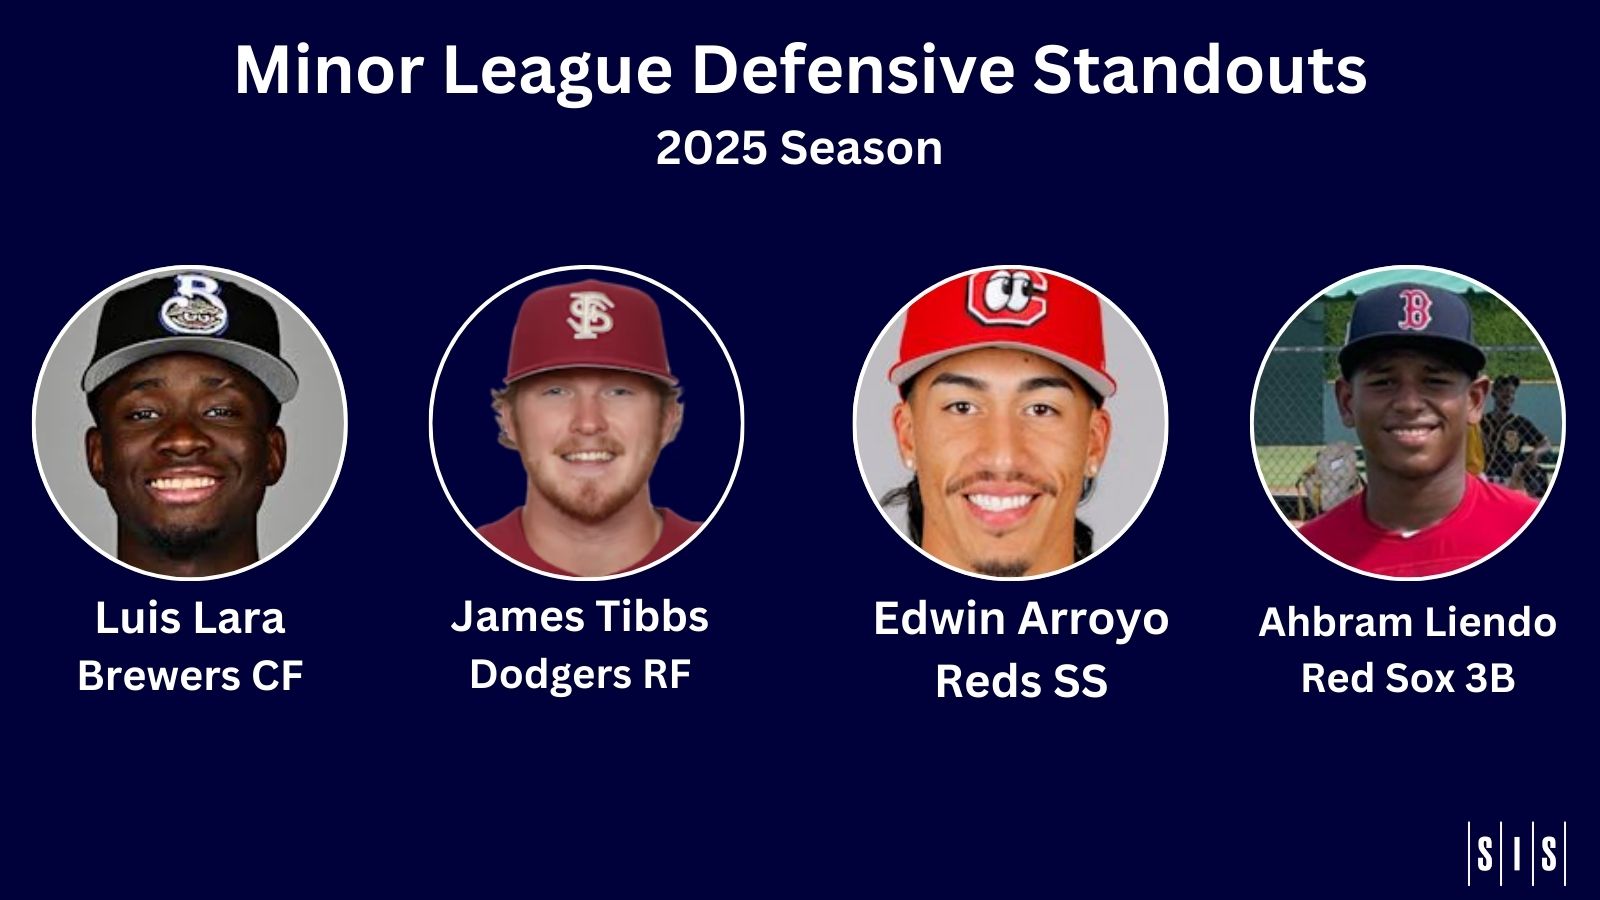
Stat of the Week: Minor League Defensive Standouts
By
BY MARK SIMON In addition to tracking Defensive Runs Saved for major league players, we calculate it for minor leaguers as well. These numbers can be challenging to interpret because we use major league out probabilities as a basis for comparison. As such, because most minor leaguers are worse defenders than major leaguers, most minor league…
-
Lessons from a Decade of Strike Zone Runs Saved
By
Who are the top catchers at getting extra strikes, who are the top teams at producing them, and what can we glean about hitters, pitchers, and umpires?