Sports Info Solutions
Category: MLB
-
New podcast: Royals GM Dayton Moore on analytics, leadership, breaking into baseball
By
On the state of the Royals rebuild, what an MLB manager should know about analytics, knowing whether shifts work, and much more.
-
Stat of the Week: The Fielding Bible All-Decade Team
By
Which players were best in the field from 2010 to 2019?
-
Evaluating Infielder Throwing with the DRS PART System
By
Baseball Info Solutions recently introduced a major update to Defensive Runs Saved that will be rolling out this offseason. We’re splitting DRS for infielders into Positioning, Air, Range, and Throwing components. In that introductory blog post, we mostly covered how this will affect the Positioning and Range components (which were previously reported together as one…
-
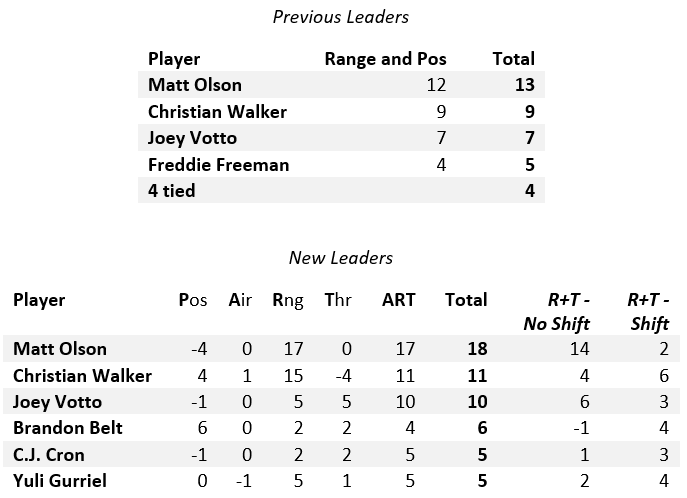
Updated 2019 Infield DRS Leaders Using the PART System
By
Adjustments to our method of evaluation produced some very interesting results.
-
New podcast: Nationals assistant GM, free agents and more awards
By
LISTEN HERE On this week’s edition of the Sports Info Solutions Baseball podcast, senior research analyst Mark Simon ( @MarkASimonSays) opens the show by talking about the defensive analytics concepts he hopes a manager would know (1:16). Mark then talks with Nationals assistant general manager for baseball research and development, Samuel Mondry-Cohen. They discuss Sam’s…
-
Stat of the Week: Who does the public want elected to the Hall of Fame?
By
Where do Barry Bonds and Roger Clemens stand?
-
Stat of the Week: A Surprising Win Shares Leader
By
It’s not Mike Trout, Christian Yelich or Cody Bellinger.
-
Who has the best chance to reach MLB milestones? (Bill James Handbook excerpt)
By
Who has the best chance of hitting 500 or 600 home runs? What about the most likely pitcher to throw a no-hitter?
-
Bill James Handbook excerpt: The year in fathers and sons
By
In this excerpt from the Bill James Handbook, we look back at the year for the younger Biggio, Tatis, Guerrero, Yastrzemski, and Bichette.
-
Which ‘Modern Era’ candidates are Hall of Fame worthy?
By
Using a Bill James stat, we can ascertain that 4 players on the ballot have a very good Hall of Fame case