Sports Info Solutions
Category: Basketball
-
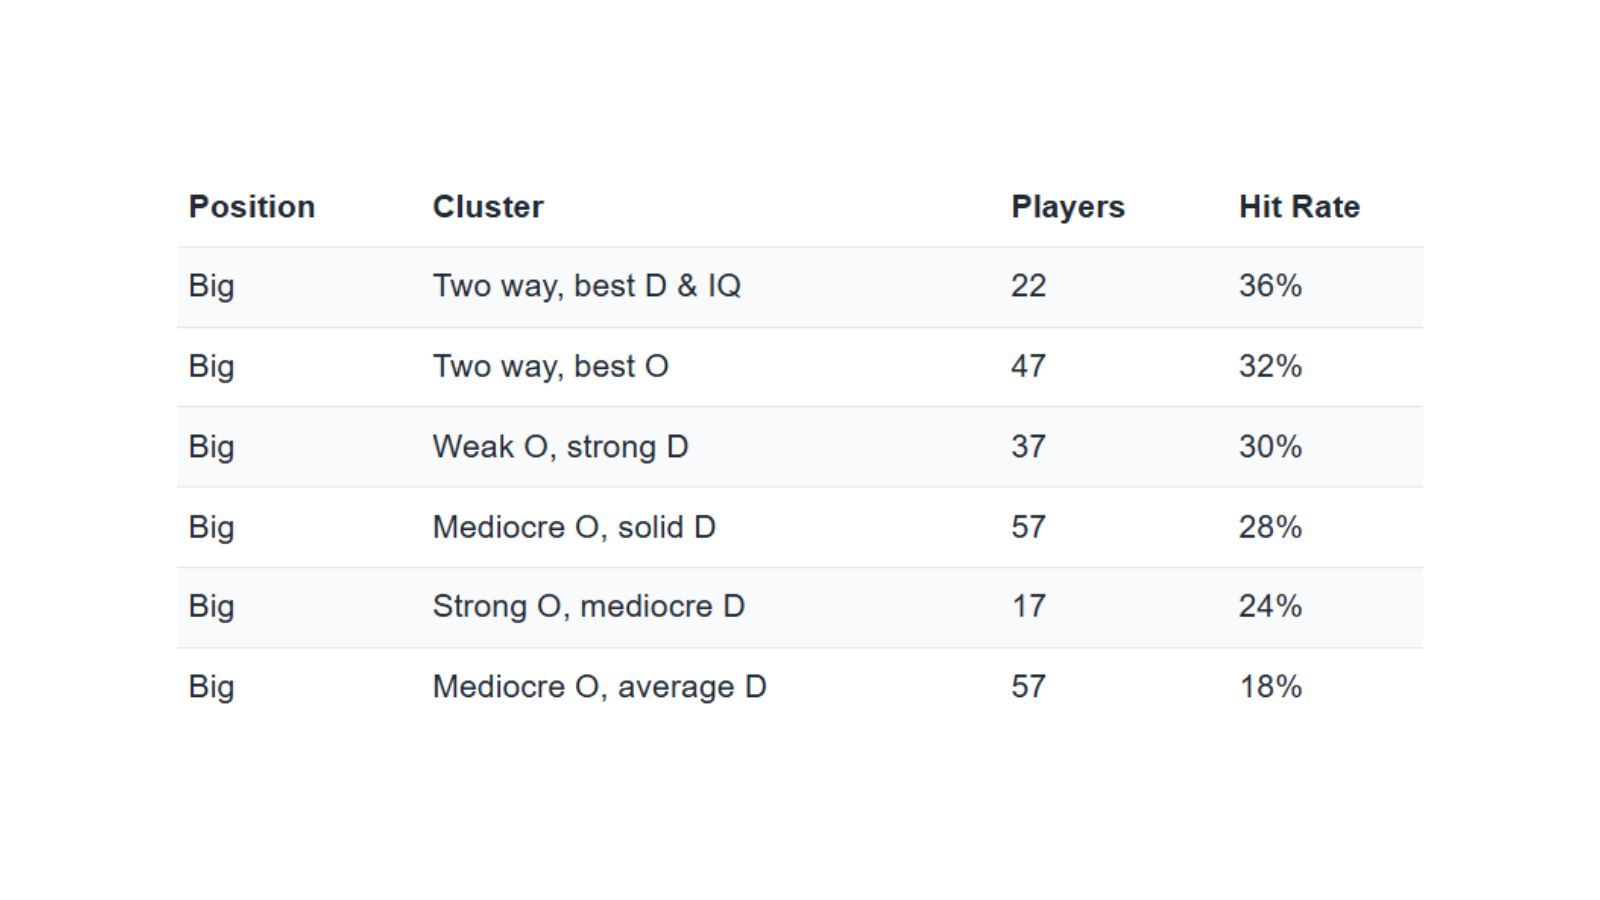
Study: Clustering Pre-Draft Profiles to Predict NBA Success
By
A look at which types of players have the highest hit rate for NBA success.
-
What Can the Knicks Learn From The Thunder?
By
Against a 7’4 destroyer of worlds and his legion of gritty defenders, the Knicks’ offense will have to be unpredictable and ready to adjust on a dime
-
Joel Embiid’s Impact Has Been Monumental
By
Putting data to how much of a game-changer Joel Embiid is.
-
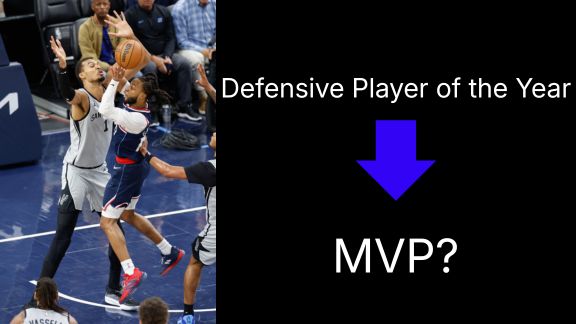
Is Victor Wembanyama’s Defense Enough to Earn Him MVP?
By
Is there enough value in what Wembanyama does on the defensive end to match what others bring to the table?
-
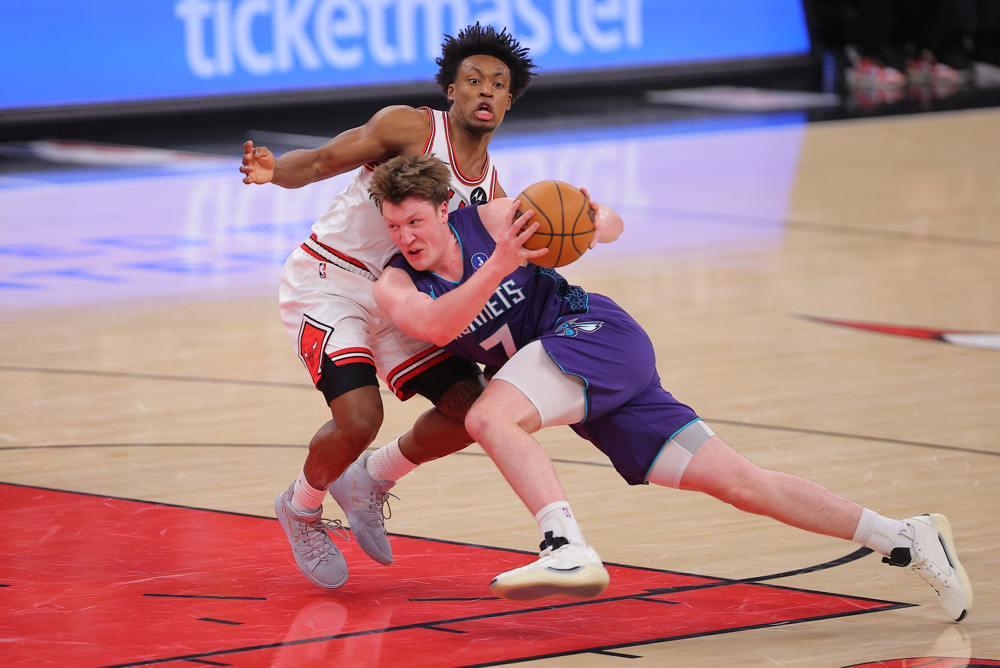
Why the Hornets are Primed For a Playoff Run
By
The buzz is all about Kon Knueppel and Moussa Diabate and what they’ve done since becoming starters.
-
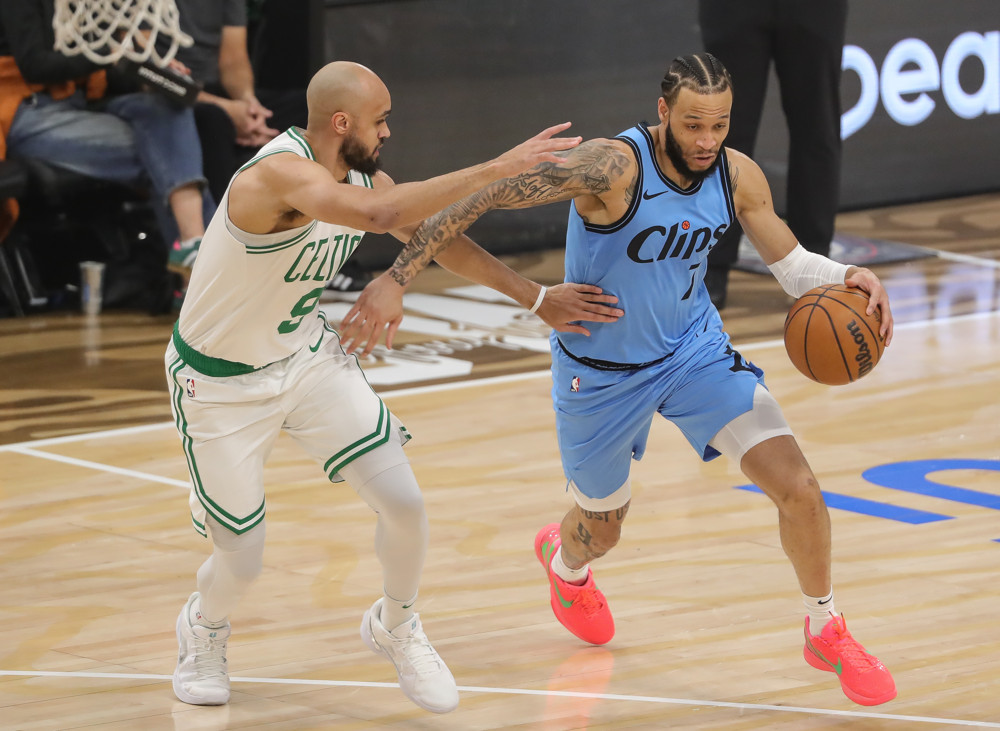
Derrick White’s Bigger Role Has Worked Out Great For Celtics
By
He’s been great at both creating and limiting advantages. We’ve got the numbers to show it.
-
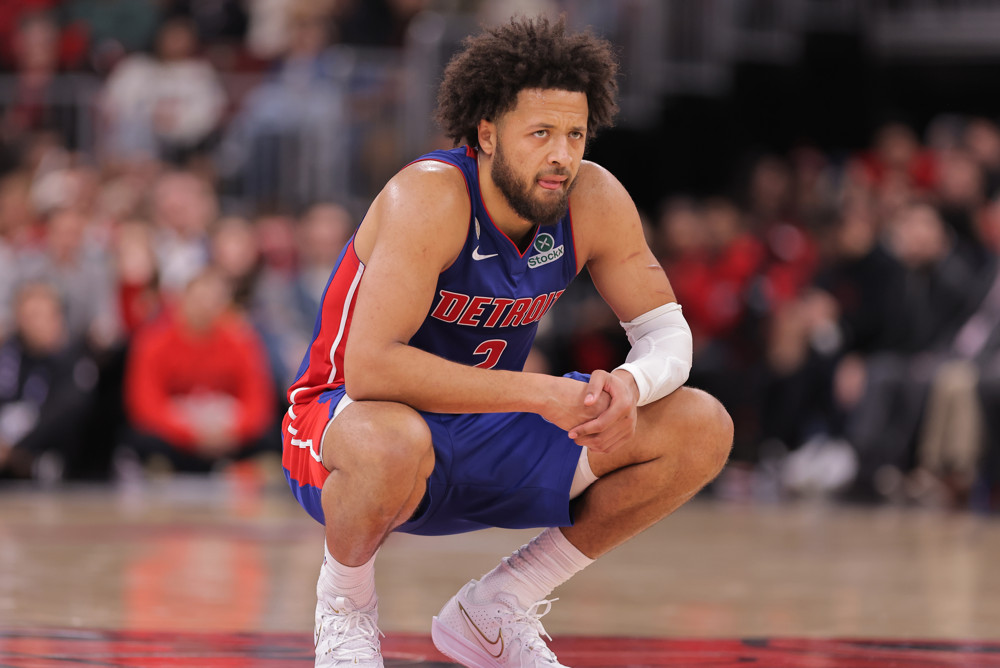
Potential Assists And Cade Cunningham’s Overall Excellence
By
We look at assist opportunities and the passes leading to shots that aren’t made.
-
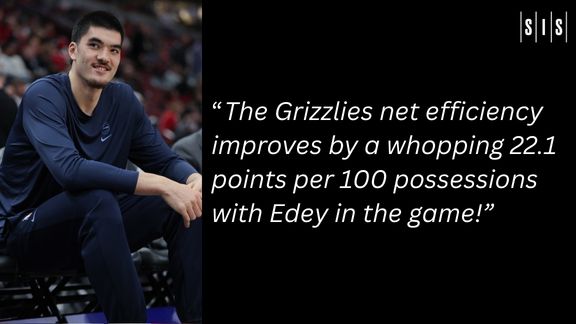
How Zach Edey Makes A Massive Difference For The Grizzlies
By
Our data shows that his size and dominance is translating well to the NBA … when he’s healthy.
-
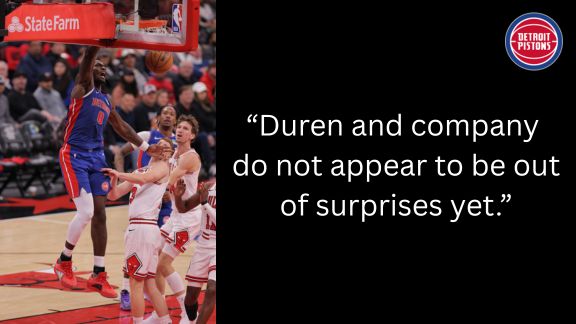
Star On The Rise: Pistons center Jalen Duren
By
We use our data to show just how much better Duren has been this season than last season.
-
What Do We See When We Scrutinize NBA Defense More Closely?
By
Dru Smith is among the top defensive disrupters in the league. Who else makes the list for positive plays and negative ones?