Category: NFL

  • Which quarterbacks have had the most success with long throws in 2018?

    For an updated version of this article, which includes all of 2018, click here

    by MARK SIMON

    A quarterback throwing the deep ball is one of the most exciting things you’ll see in a football game. It leads to big plays, sometimes game-changing moments and puts a receiver’s athleticism on display.

    So let’s dig into a few of the numbers related to long passes this season. For our purposes, unless otherwise noted, we’re referring to passes thrown at least 20 yards downfield.

    Who throws them most often?
    The NFL leader in deep pass attempts this season is Chiefs quarterback Patrick Mahomes with 62, just ahead of Aaron Rodgers. Mitchell Trubisky ranks fourth despite having missed two games. He could have been atop the list had he played every game this season.

    Seahawks quarterback Russell Wilson led the NFL with 88 deep pass attempts last season. More on him in a moment.

    Most Deep Passes Attempted in 2018
    Patrick Mahomes 62
    Aaron Rodgers 61
    Ben Roethlisberger 58
    Mitchell Trubisky 54
    Matt Ryan 49
    Russell Wilson 47
    Kirk Cousins 47

    Who throws them most accurately?
    An easy explanation for Saints quarterback Drew Brees’ success this season is his success on deep balls. He’s 22-of-37 on them, a 60 percent completion percentage that easily ranks best in the NFL. Two other quarterbacks are at 50 percent or higher — Ryan Fitzpatrick of the Buccaneers (52 percent) and Jared Goff of the Rams (50 percent).

    If we change the criteria to on-target percentage, rather than completion percentage, Goff takes the lead. He’s thrown 31 of his 46 deep passes on target (67 percent).

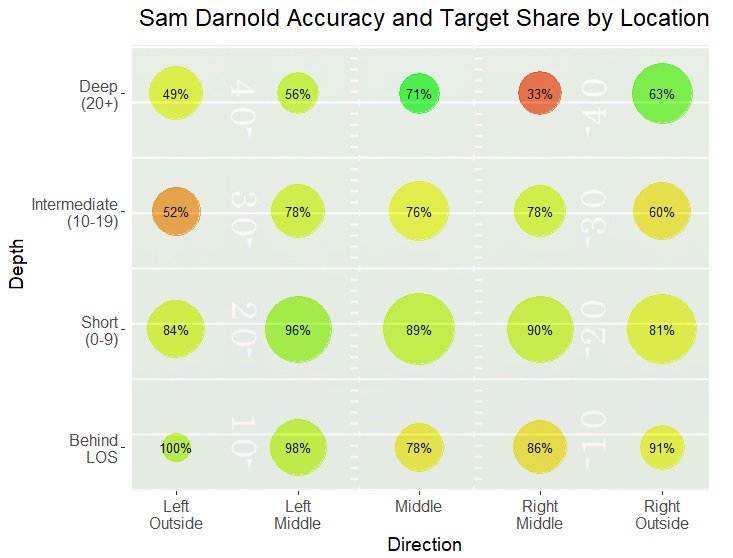
    The contrasts to Brees and Goff are Jets rookie Sam Darnold and Cowboys quarterback Dak Prescott.

    Darnold is 6-of-36 on his deep throws (17 percent, the lowest completion percentage in the league), though that’s not completely his fault. His on-target percentage is 47 percent (17-of-36). Darnold’s backup Josh McCown is actually worse, going 1-of-15 on his deep throws. He was a much more respectable 20-of-46 (43 percent) completing those passes last season.

    Prescott has a 33 percent completion percentage, but an NFL-low 40 percent on-target percentage (12-of-30).

    The NFL averages on deep throws this season are a 37 percent completion percentage and a 52 percent on-target percentage.

    Highest Completion Percentage on Deep Passes – Minimum 25 Attempts
    Attempts
    Drew Brees 59.5% 37
    Ryan Fitzpatrick 51.7% 29
    Jared Goff 50.0% 46
    Russell Wilson 48.9% 47
    Derek Carr 44.2% 43
    Philip Rivers 43.9% 41
    Eli Manning 43.5% 46
    Patrick Mahomes 43.5% 62

    Who is hitting on the deepest deep balls?
    The thin air in Denver is allowing Case Keenum’s balls to carry a bit. He’s average 31.7 air yards on his long pass completions, the highest average in the NFL. He’s about a half-yard better than Chargers quarterback Philip Rivers.

    Who has had the biggest payoff the most often?
    Steelers quarterback Ben Roethlisberger leads the NFL with 10 touchdown passes on deep throws, one more than Wilson and Drew Brees.

    Brees has yet to throw an interception on one of these pass attempts. Roethlisberger has two. Wilson has one.

    On the opposite side of the ledger, Deshaun Watson leads the NFL with five interceptions on those passes. Six quarterbacks have four, including Mahomes.

    In all, quarterbacks have 150 touchdown passes and 89 interceptions on these passes, which averages to 4.7 and 2.8 per team respectively.

    Who is the best overall?
    It would be easy to say that Brees is the top guy, given his completion percentage and his touchdown success on these passes, and if you did, that would be completely fair.

    However, our Total Points system makes a different choice. It goes with Wilson, who ranked seventh last season (Alex Smith and Tom Brady were 1-2).

    To excerpt from Alex Vigderman’s Football Outsiders article on a quarterback’s Passing Points Earned.

    The core assumption of passing Points Earned is that each throw has a certain expected outcome based on information like the route, the depth, and the coverage. From that point, the passer and receiver split responsibility for how well they perform above that expectation. Throwing off-target passes and deserved interceptions (caught or not) will bury a signal-caller, while he will be rewarded for leading receivers to more yards after catch and making something out of a broken pocket.

    Wilson’s volume of success, his rate of success, and the outcomes themselves have combined to put him in the No. 1 spot in terms of which quarterbacks are best at one of the most exciting plays in the game.

    For those wondering about Rodgers, his value gain comes in the drops by his receivers, which are being treated as completed passes in this system. With those, and his performance on 30-yard or longer throws, he vaults ahead of Brees by a hair.


    NFL Leaders – Points Earned on Deep Passes
    Pts Comp-Att, TD, INT
    1. Russell Wilson 29.5 23-of-47, 9 TD, 1 INT
    2. Aaron Rodgers 25.8 22-of-61, 6 TD, 0 INT
    3. Drew Brees 23.5 22-of-37, 9 TD, 0 INT
    4. Patrick Mahomes 23.4 27-of-62, 8 TD, 4 INT
    5. Philip Rivers 22.5 18-of-41, 7 TD, 1 INT


  • Stat of the Week: A look at NFL and NBA Power Ratings

    With the baseball postseason over, it’s time to immerse ourselves in the NFL and NBA. If you haven’t paid close attention to this point, or are just curious for some interesting analysis, the Bill James Online Power Ratings are here to help.

    NFL

    Bill James Online Power Ratings
    Team
    1. Saints 111.7
    2. Chiefs 110.9
    3. Rams 110.2
    4. Steelers 109.5
    5. Ravens 108.5

    The top NFL team by the power ratings is the New Orleans Saints, who edge out the Kansas City Chiefs and the Los Angeles Rams. The Pittsburgh Steelers and Baltimore Ravens round out the Top 5 overall. The Power Ratings are intended to show how many points above (or below) average that a team is to that point in the season. The NFL Power Ratings use 100 as a baseline, so the Saints would be 11.7 points better than the average team.

    The 8-1 Saints have eight straight wins, including two wins over Top-5 teams. They’ve beaten the Ravens on the road and the Rams at home. They’ll face the struggling defending Super Bowl champion Eagles on Sunday. Drew Brees is playing like an MVP with 21 touchdown passes and only one interception.

    The Chiefs have looked ultra-impressive thanks largely to quarterback Patrick Mahomes, whose first season as a starter has been a record-setting one. His 31 touchdown passes are a Chiefs single-season record.

    Rams running back Todd Gurley may have something to say about Brees’ and Mahomes’ MVP candidacies. He leads the NFL with 988 rushing yards, 13 rushing touchdowns and 17 touchdowns overall. Gurley has a chance to be the first player to lead the NFL in touchdowns scored in consecutive seasons since Shaun Alexander for the Seahawks in 2004 and 2005.

    NBA

    Bill James Online Power Ratings
    Team
    1. Bucks 214.9
    2. Trail Blazers 209.8
    3. Warriors 207.8
    4. Clippers 206.9
    5. Raptors 206.8

    (Note that the NBA uses 200 as a baseline. The Bucks are 14.9 points better than the average team).

    The early surprise in the NBA’s Power Ratings (which are based entirely on this season’s performance) is that there are two teams ahead of the Golden State Warriors — the Milwaukee Bucks are No. 1 and the Portland Trail Blazers are No. 2.

    Both the Bucks and Trail Blazers are 10-3. The Bucks have shown their mettle by beating the Raptors (No. 5 in our rankings) by 15 and the Warriors by 23, though they’ve lost to both the Clippers (No. 4 in our rankings) and the Trail Blazers. The addition of Brook Lopez has boosted a Bucks team that leads the NBA in three-pointers made and is averaging 121.6 points per game. Giannis Antetokounmpo is averaging 25 points and 13 rebounds to lead the way for them.

    Damian Lillard, C.J. McCollum and the Trail Blazers are trying to bounce back from a disappointing finish to last season when they got swept by the Pelicans in the first round of the playoffs. They’ve won three straight games against prominent teams — the Bucks, Clippers and Celtics– to wrap up a six-game homestand.

    Up next is six straight on the road, including back-to-back games to close the trip against the Bucks and Warriors. Their next home game is against the Clippers on Nov. 25.

    The power ratings will be worth checking again at that point to see whether the Trail Blazers have the staying power to remain among the league’s top teams.

    If you want to keep up with the Power Ratings, you can follow them with a subscription to Bill James Online.

  • The most interesting numbers from the NFL Draft

    The most interesting numbers from the NFL Draft

    By KEEGAN ABDOO
    It was a fascinating and exciting NFL Draft, with twists, turns and plenty of interesting selections.

    What numbers were most telling to us about some of the top players selected?

    On Cleveland Browns QB Baker Mayfield
    Baker Mayfield ranked first with a Passing Success Rate of 61% (out of 113 FBS Quarterbacks with 200+ attempts), which is 4.7% better than second and a margin that represents the gap between 2nd and 14th best.

    Mayfield also excelled when plays broke down. He had an 82 percent on-target percentage on 44 throws in those instances.

    On New York Giants RB Saquon Barkley
    There were only eight RBs with at least 100 carries and 50 receptions in 2017. Among them, Barkley’s 7.0 yards/touch, 5.9 yards/attempt and 11.7 yards/reception each ranked first.

    On Denver Broncos Pass Rusher Bradley Chubb
    Bradley Chubb’s 111 pressures were the most in FBS over the last two seasons and 14 more than the second best total, which represents the gap between #2-#10.

    On Browns CB Denzel Ward
    Denzel Ward’s 3.9 Yards Allowed per Target were the best in the nation among CBs with at least 40 targets.

    He was even better in Man Coverage, where he allowed 2.8 Yards Per Target.

    On Bills QB Josh Allen’s escapability
    Josh Allen broke 16 tackles in the pocket last season, which was second only to Lamar Jackson (20). However, he did this on 174 fewer dropbacks.

    Of the 103 QB’s with at least 300 dropbacks last season, Allen’s 4.8% Broken Tackle/Dropback rate led the FBS by a significant amount.

    On a successful Bears LB
    Bears LB Roquan Smith was excellent in man coverage last season:

    Out of 44 LBs with at least 10 man targets, Smith ranked 2nd in Success Rate (83.3%) and Yards/Touch (2.55).

    Success Rate, per Football Outsiders, is how often a defensive player that prevent a successful play by the offense, defined as 45% of needed yards on first down, 60% of needed yards on second down, and 100% of needed yards on third or fourth down.

    On a disruptive CB
    Packers CB Josh Jackson has great ball skills. In 2017, he led the nation with 8 interceptions and ranked 4th among the 100 most targeted cornerbacks with a 31% Pass Disruption Rate.

    On surehanded receivers
    Arizona Cardinals WR Christian Kirk and Jacksonville Jaguars WR D.J. Chark ranked 1-2 in on-target catch percentage among receivers last season. Each caught 84 percent of on-target throws to them.

    On Mason Rudolph being first-round caliber
    When compared to Baker Mayfield, Sam Darnold, Josh Allen, Josh Rosen and Lamar Jackson, new Steelers QB Mason Rudolph had the second-highest Independent Quarterback Rating (IQR). IQR is a stat that measures QB effectiveness, taking into account the factors that he most controls.

    Rudolph also had the highest IQR among himself and the first-round quarterbacks when playing against a man defense.

  • Top 5 QB Prospects: Performance by Throw Location

    Top 5 QB Prospects: Performance by Throw Location

    By KEEGAN ABDOO
    Here at Sports Info Solutions, we track the direction and throw depth of every throw made at the FBS level, as well whether the ball was catchable or not. A huge conversation this draft season has been about the top five quarterback prospects and how well their true accuracy was represented by their Completion Percentage. Our On-Target Percentage statistic (simply catchable throws divided by all throws) captures a player’s ball placement ability much better than Completion Percentage, as it isolates a quarterback’s accuracy from his target’s ability to catch the ball.

    On that note, we have visualized each of the top five quarterback prospects’ accuracy and Target Share (percent of total attempts) by location of their throw. The size of the circle represents the Target Share, the color represents their On-Target Percentage relative to FBS average for that location (red = bad, yellow = average, green = good), and the number in the circle is their observed On-Target Percentage. We’ve included both 2016 and 2017 for these players to increase their sample sizes.


    Baker Mayfield


    In summary:
    Was consistently accurate all over the field.

    Baker Mayfield has had above average to elite accuracy almost everywhere on the field. Directionally, he most frequently threw passes between the hashes and to the right sideline outside the numbers.

    From a throw depth perspective, he ranked in the top two (amongst these five QBs) in throws behind the line of scrimmage and in deep and intermediate areas. However, he threw by far the fewest passes in the 0-to-9 yard range of any QB in this group at 33% (which was seven percentage points less than any other QB).

    When comparing his accuracy to FBS average, he had four of the five biggest differences in this group in On-Target Percentage: Deep Right Middle (+32%), Deep Left Middle (+31%), Intermediate Right Outside (+27%), and Deep Right Outside (+18%).


    Sam Darnold


    In summary:
    Could stick a deep throw to the right sideline at an elite level.

    Sam Darnold presented more of a mixed bag. Directionally, he slightly favored his right, especially outside the numbers.

    His accuracy was most impressive compared to FBS average in the Deep Middle (+17%) and Deep Right Outside (+15%), but he attempted three times as many throws (52 attempts vs. 17) to that Deep Right Outside area.


    Josh Rosen


    In summary:
    Majority of throws were short, potential West Coast Offense fit.

    Josh Rosen absolutely loved throwing in that bread basket right in front of him in the short middle—he had a higher percentage of his attempts here than any other of these QBs had in any area (13%).

    Likewise, this conservative throw distribution (whether by scheme or a bad offensive line) showed up again in his deep throw percentage, which ranked last by a considerable margin. By direction, nearly two-thirds of his throws were between the numbers.

    His accuracy didn’t really stand out in any area other than the Intermediate Left Outside (+14%); this was his only area which he placed in the top 20 (of the 100 depth and direction combinations) in terms of the difference between his On-Target Percentage and the FBS average.


    Lamar Jackson


    In summary:
    Threw short the most, deep middle sweet spot.

    Jackson did have the highest percentage of throws to the short area (46%), but he had the second fewest percentage of throws behind the LOS (13%) and lowest in the intermediate area (23%).

    Jackson really loved the Deep Middle—his Target Share in this area (6%) was highest of any prospects in any deep section, and his On-Target Percentage was elite (8% above FBS Average) on a big sample. However, his two most accurate areas compared to FBS average were interestingly both to the left and outside the numbers—specifically the Short Left Outside (+13%) and Intermediate Left Outside (+12%).


    Josh Allen


    In summary:
    Works sideline and deep the most.

    And finally, we have Josh Allen, an inaccurate QB whose arm strength and mobility still entice teams to think about his potential. To be fair, Allen’s throw locations were often to some of the hardest places to complete passes on the field, as his 51% Target Share outside the numbers was 12% more than the next QB (Darnold, 39%).

    Correspondingly, he was averse to throwing in the middle and left middle areas, ranking last in both. He also led in the percentage of his throws that were deep (22%) and intermediate (27%), while having the least amount of easy throws behind the LOS.

    While his accuracy generally was below average, he did excel in the Deep Right Middle compared to FBS average (+19%, which ranked fourth overall among these 100 combinations). However, that was on only 19 attempts, so sample size beware.

    After diving deep into accuracy by ball location, a lot of the narratives from this draft season actually hold up pretty well. Allen was, in fact, asked to make harder throws than everyone else.

    But even after controlling for the difficulty of throws, there is no QB who even came close to Mayfield in terms of being consistently accurate no matter where he threw the ball.