Sports Info Solutions
Category: Football
-
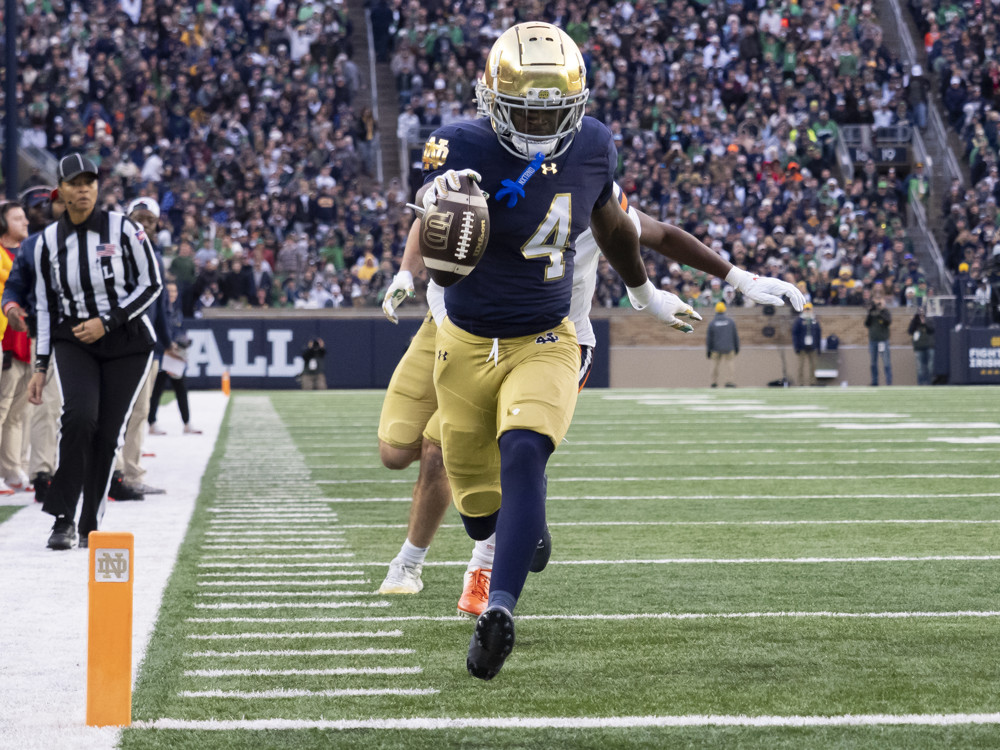
2026 NFL Draft: Jeremiyah Love Scouting Report
By
Love is a well-rounded and explosively athletic running back with a solid build, true game-breaking threat every time he touches the ball,
-
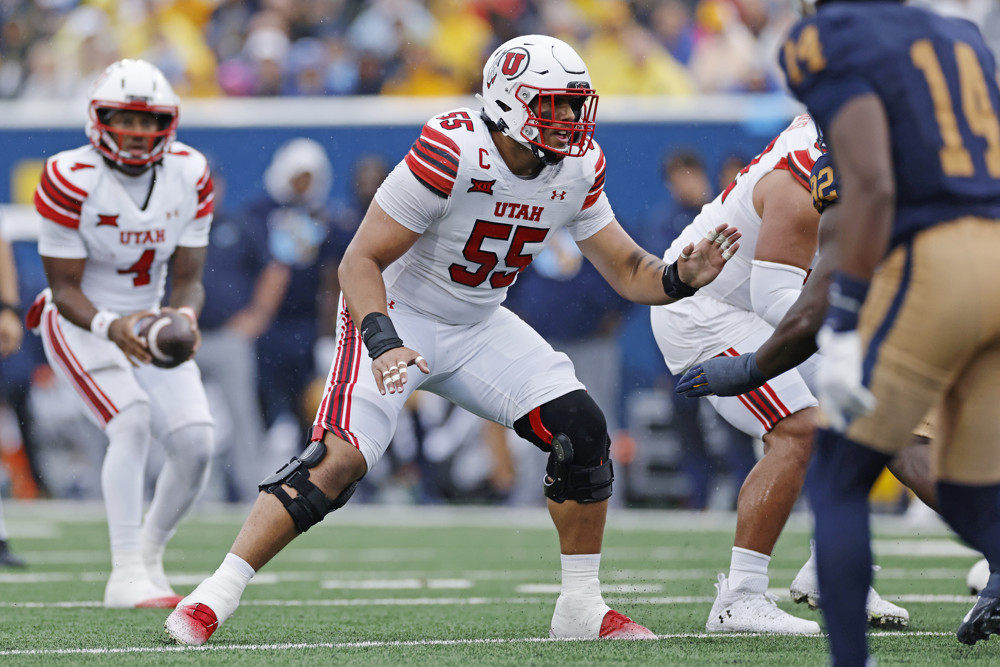
Breaking Down A Line In An NFL Draft Scouting Report: Spencer Fano
By
Dissecting what happens when Spencer Fano is asked to pull
-
2026 SIS Operations Staff 7-Round Mock Draft
By
Our operations staff takes its best guess at who goes where.
-
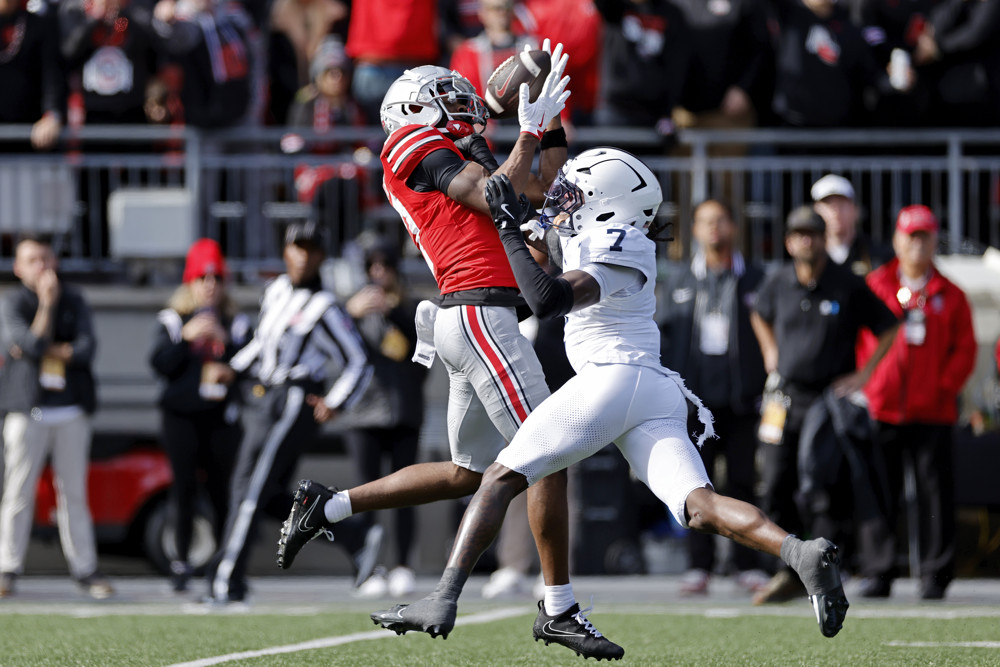
2026 NFL Draft: Carnell Tate Scouting Report
By
Carnell Tate is a smooth and savvy receiver whose strong, secure hands make for a QB-friendly target that will see plenty of playing time.
-
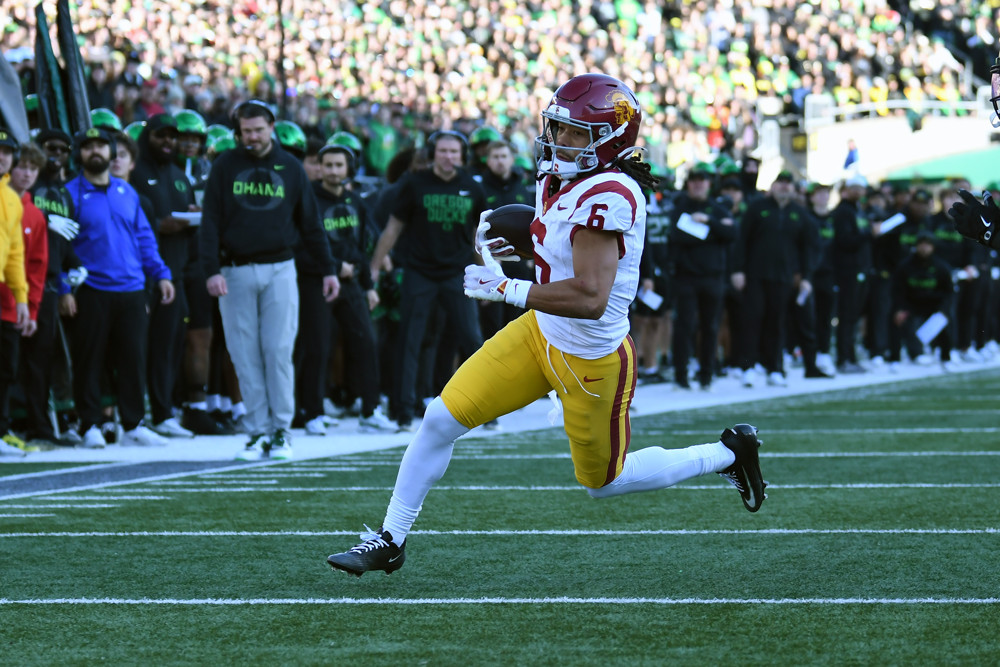
2026 NFL Draft: Makai Lemon Scouting Report
By
A prospect that should develop into a passer’s favorite target when they need to make a completion but with some early growing pains
-
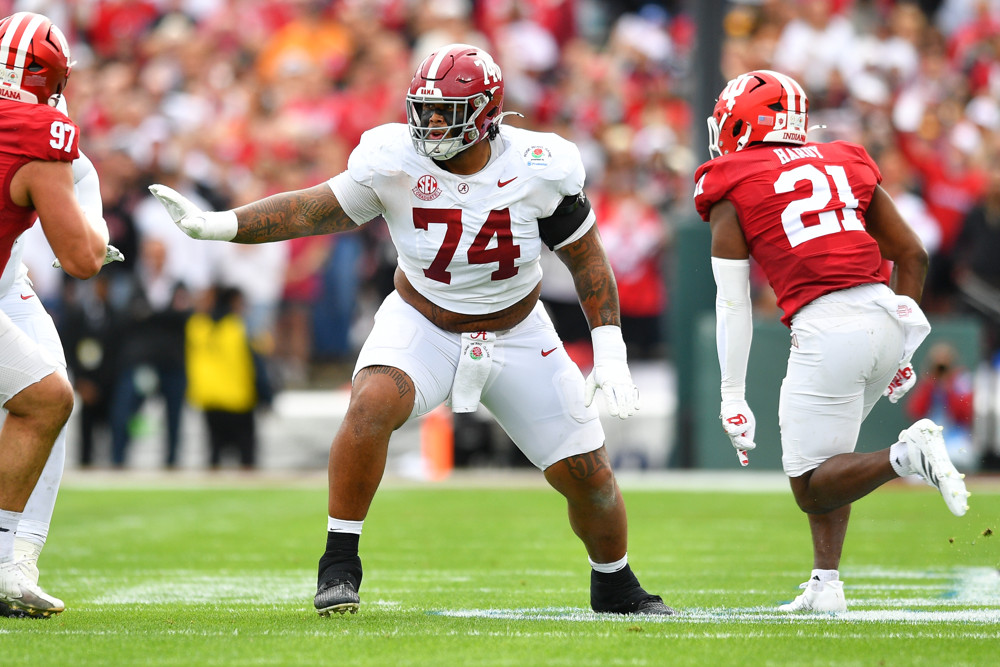
2026 NFL Draft: Kadyn Proctor Scouting Report
By
Proctor has the ideal size and athleticism combination that teams drool over
-
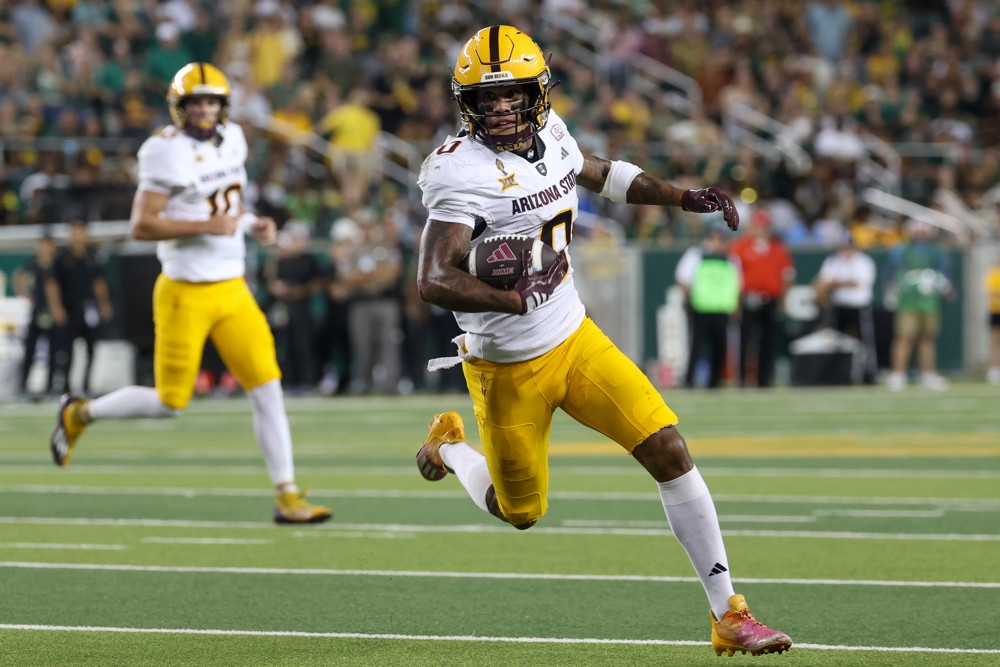
2026 NFL Draft: Jordyn Tyson Scouting Report
By
Tyson is an NFL-ready receiver whose clutch ability and contested catch prowess should give him ample opportunity to earn his quarterback’s trust early in his NFL career.
-
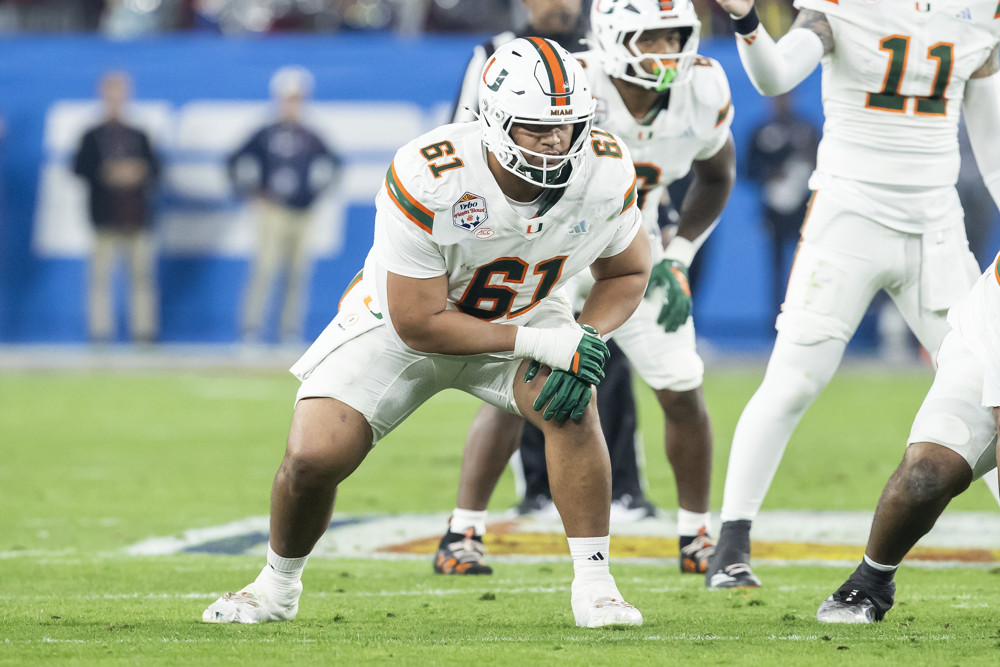
2026 NFL Draft: Francis Mauigoa Scouting Report
By
Francis Mauigoa projects as an immediate, high-end starter at right tackle at the next level.
-
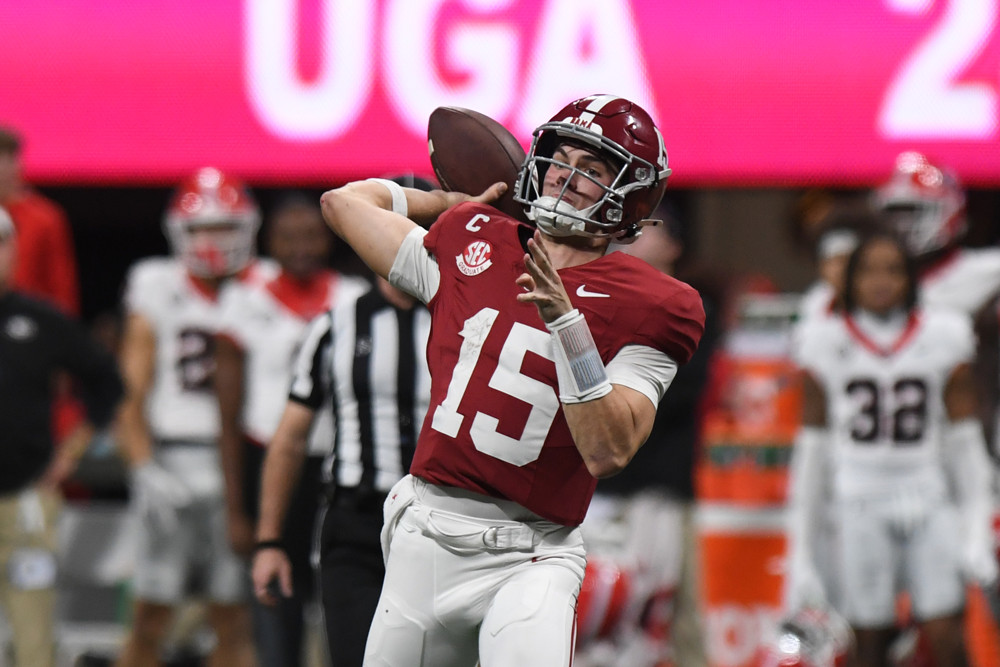
2026 NFL Draft: Ty Simpson Scouting Report
By
Simpson is a sufficient athlete, with toughness and leadership, but is relatively inexperienced as a starter and will take time to develop.
-
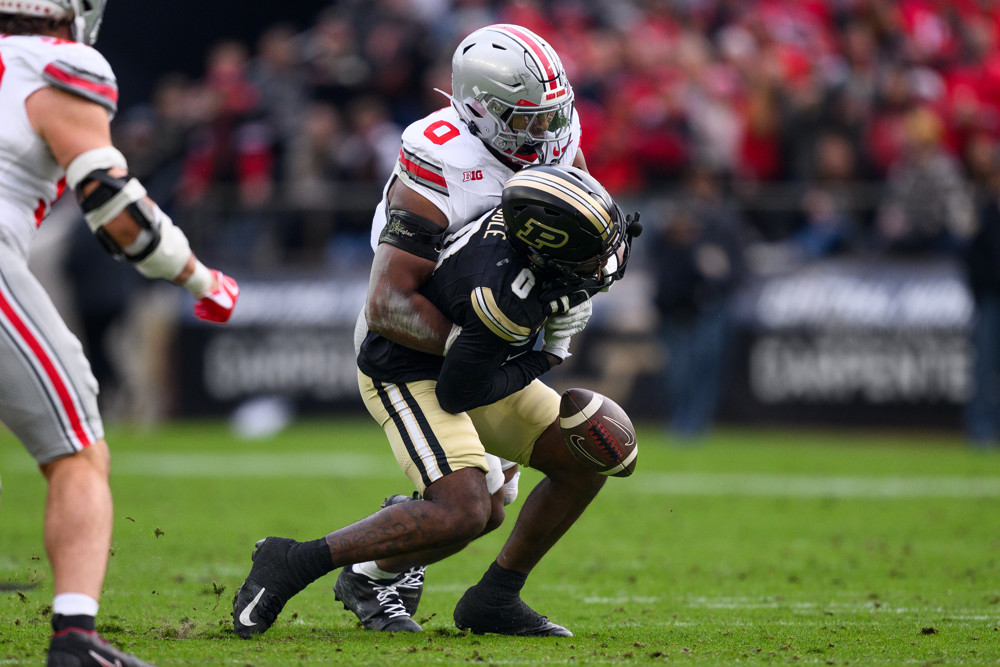
2026 NFL Draft: Sonny Styles Scouting Report
By
Styles is a steadily improving off-ball linebacker with exceptional skills and loads of potential.