Category: Football

  • How Do Tyler Warren and Colston Loveland Compare As Draft Prospects

    How Do Tyler Warren and Colston Loveland Compare As Draft Prospects

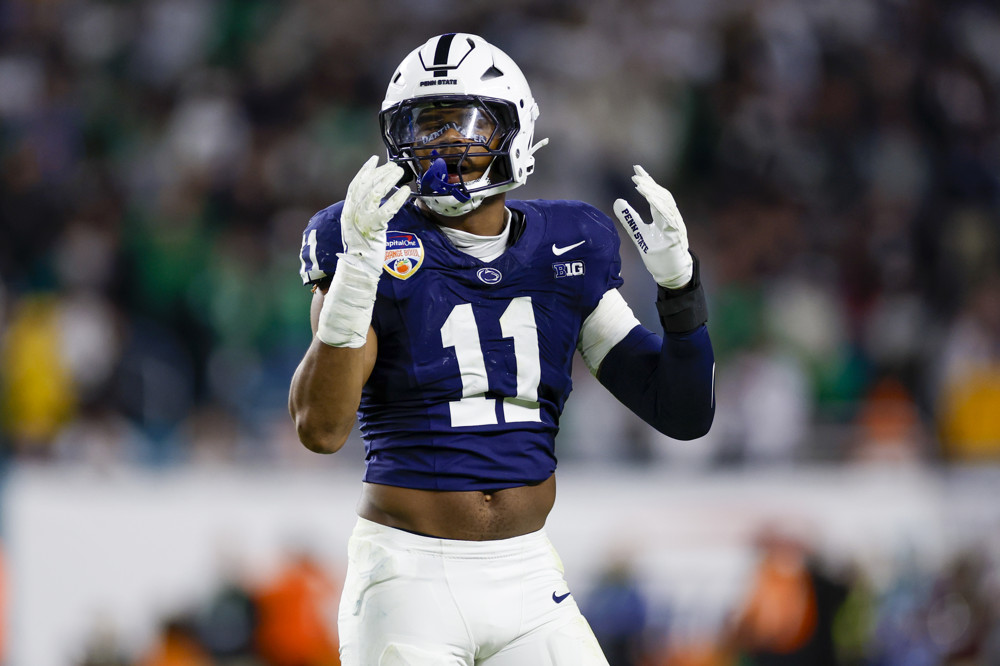
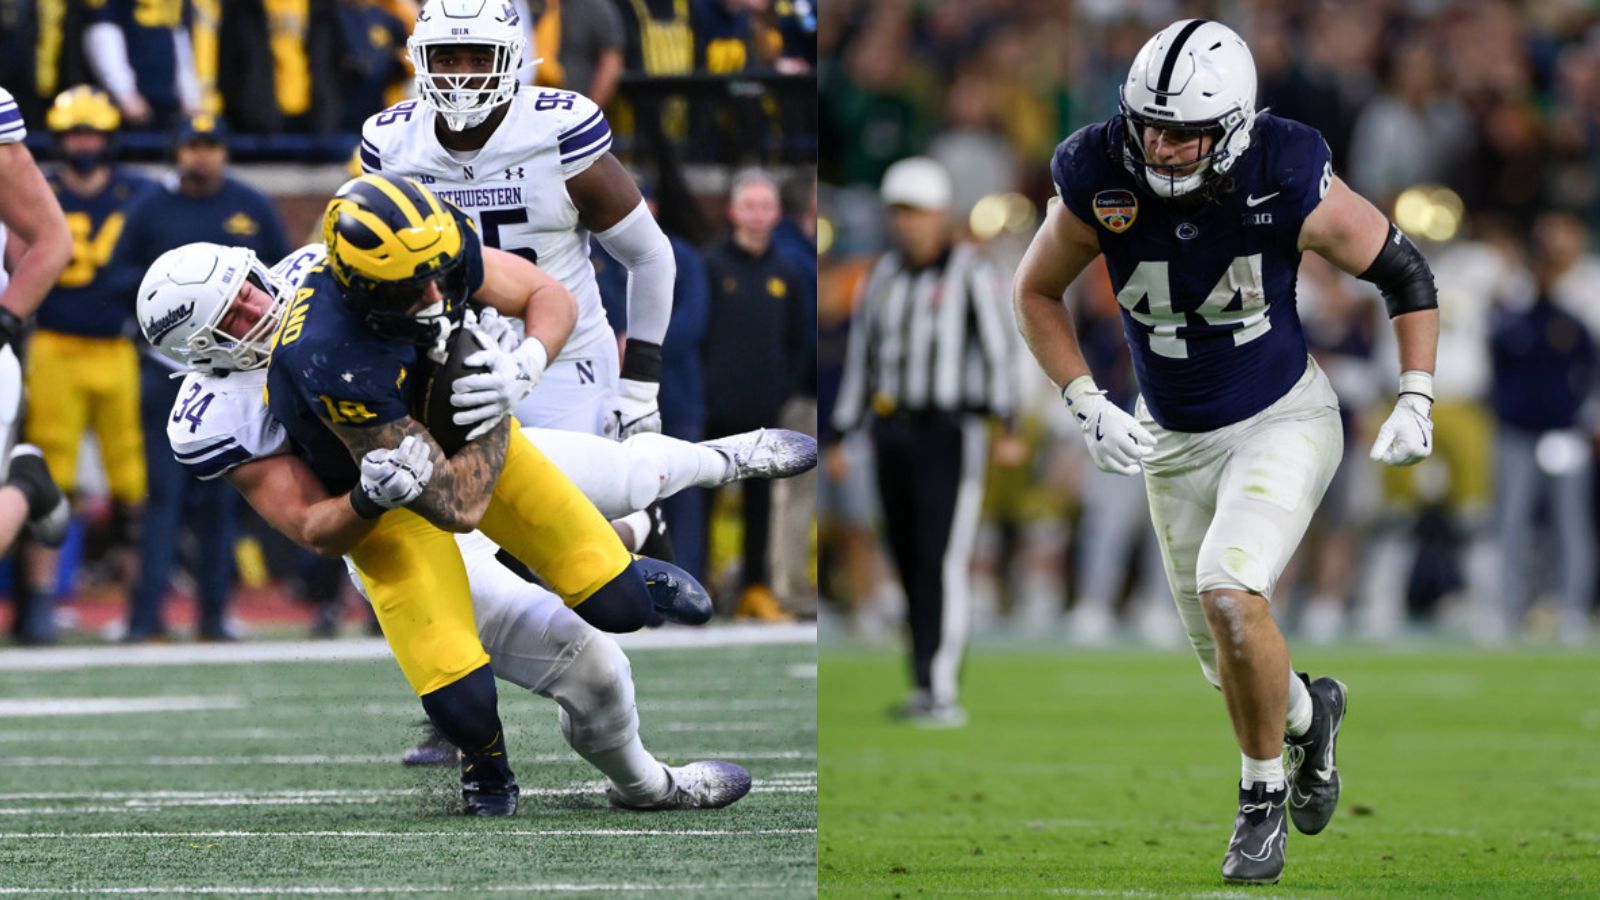
    Photo: Steven King (left) and David Rosenblum (right)/Icon Sportswire

    It has been six years since two tight ends were last taken in the first round of the NFL Draft, when Noah Fant and TJ Hockenson went 8th and 20th overall, respectively. But that trend is likely to change this week, as Penn State’s Tyler Warren (scouting report) and Michigan’s Colston Loveland (scouting report) are both all but guaranteed to have their names called on Day 1.

    These players make an interesting case study because they have similar profiles in a general sense – they’re both F tight ends – but are quite different once you dive into the particulars. 

    Warren is the more powerful of the two and is better with the ball in his hands, whereas Loveland is the better athlete and has true mismatch ability. Both have issues as blockers that we’ll get into.

    Let’s begin with the broad strokes and take a quick look at how their teams deployed them in 2024:

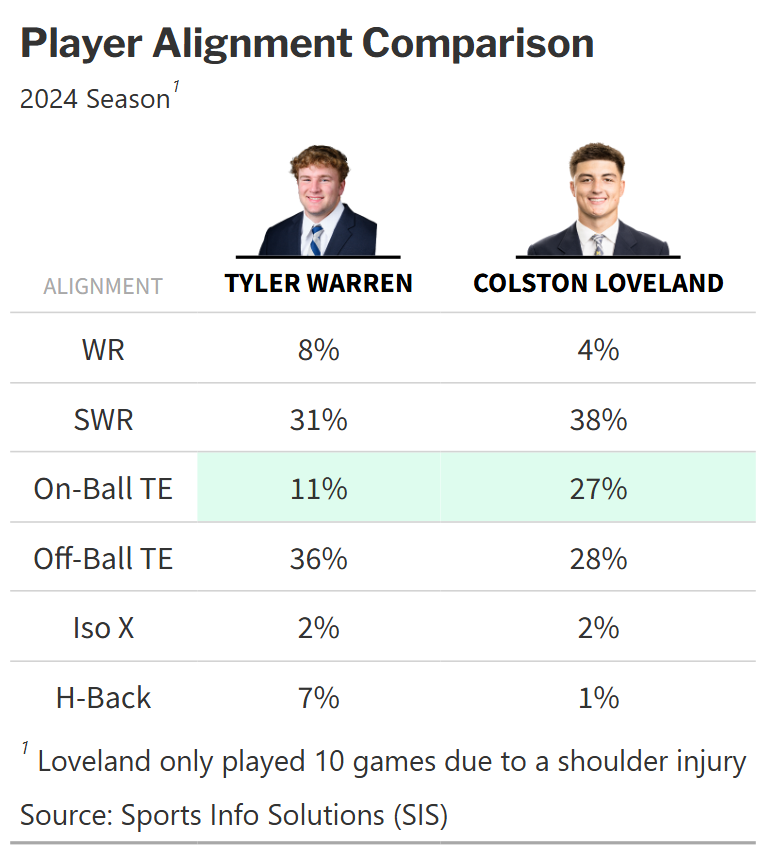
    As you can see, Loveland spent more time lined up as a traditional tight end, but the rates at which they moved out wide (including as an X) or into the slot were pretty similar (41% for Warren, 44% for Loveland). It’s also worth noting that the on-ball and off-ball splits are meaningfully different, particularly because they speak to the types of blocks these players were being asked to execute, which we’ll return to in a moment.

    For now, let’s focus on them as receivers since their positional breakdown indicates they’re receiving threats first and foremost.

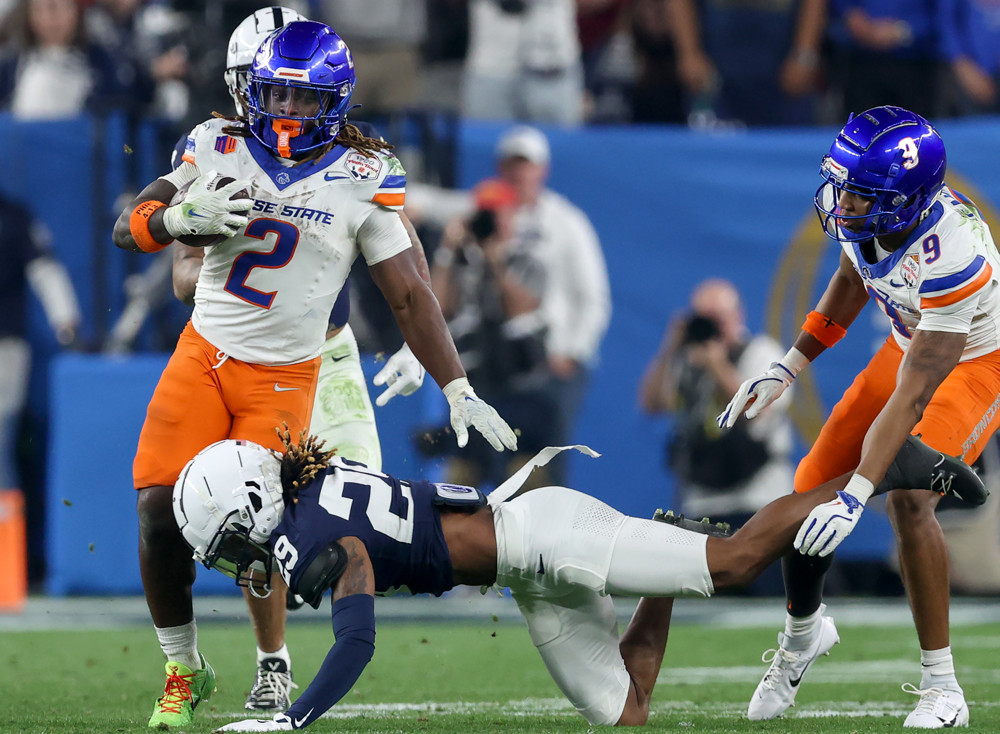
    Let’s start with Warren, whose big selling point is that he’s a YAC monster. He had a 22% broken + missed tackle rate (BMT)  and averaged 6.8 yards after the catch in 2024. That’s not quite Brock Bowers territory (31% BMT and 8.7 YAC in 2023), but both are top-15 marks for qualifying Power 5 tight ends (minimum 50 receptions) over the past 10+ years.

    Warren does have some ability to get up the seam and did run a high percentage of vertical routes (19%), but he’s at his best working the short-to-intermediate areas of the field, with his most efficient work from a Total Points perspective coming on out-breakers and under routes (i.e. slants and drags). A middling average depth of target (ADoT) of 6.6 yards rounds out the statistical profile here, although that number is admittedly sandbagged by the fact that screens made up nearly 10% of his targets in 2024.

    Loveland, on the other hand, is a better athlete and more threatening at the second and third levels of the defense. 2023 is more instructive in his case because the Wolverines were largely dysfunctional on offense in 2024 even before his season was cut short by a shoulder injury. 

    During Michigan’s championship season, Loveland ranked 8th among Power 5 tight ends in ADoT (9.6) and was extremely efficient on seams and fades, which made up 10% of his routes. His yards per route run of 2.6 that season was third among tight ends, trailing only Bowers and Jatavion Sanders among tight ends with 50+ targets.

    Loveland has a better catch radius and body control in the air but Warren is much stronger at the catchpoint. Take a look:

    Catch Percentage

    Loveland Warren
    Off-Target but catchable 63% 47%
    Contested but catchable 45% 64%

    There are some similarities, though. Both Loveland and Warren are natural hands catchers who had similar drop rates in 2024 (4.8% and 5.2%, respectively), and both are good route runners who ranked top 10 among tight ends in open rate, although Loveland is the better man separator.

    As I noted atop the article: Warren is the more powerful of the two and is better with the ball in his hands, whereas Loveland is the better athlete and has true mismatch ability. The picture that’s been painted of the former thus far may make him seem more like a traditional Y, but both have shortcomings as blockers that are worth discussing.

    Circling back to the point that was previously alluded to, Warren played off the ball a lot in a zone-heavy Penn State offense and was largely tasked with cutting off the back side – either by initial alignment or by splitting across – or widening out the front side of outside zone. His blocking skills require some projection considering he has mostly been responsible for generating lateral movement on zone runs and executing 2-back run game. He had a lot of good reps from a backfield alignment tracking to the second level but has seldom been a true point of attack player, with just 26 reps blocking power/duo in 2024. While he has the requisite strength and demeanor to grow into such duties and vertically displace edges at the NFL level, his length is a concern (31 ¾” arms).

    Despite having the thinner frame, Loveland was base and down blocking more in Michigan’s offense, especially in 2023 under Harbaugh. He is also a willing blocker and has superior length to Warren, so the question here is not one of experience or length but of functional strength to root out NFL bodies on the edge.

    It could be said that Loveland could get stronger whereas Warren’s arms will not grow anymore, but it may be difficult to accomplish the former without compromising one of his biggest selling points – his quickness and fluidity. Ultimately, both these players project better to zone schemes, albeit for different reasons. That said, most NFL teams skew zone-heavy anyway, and would be perfectly happy to settle for tight ends who are willing blockers provided they check enough boxes as receivers.

    Warren and Loveland are very talented and at this point it should be clear that team fit may be more important than anything in terms of who comes off the board first. However,  we can still tie this off with a general statistical comparison of Loveland and Warren to both each other and tight ends who have been drafted since 2016:

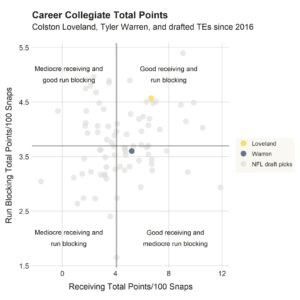
    As you can see, both are pretty good receivers even in comparison to the pool of tight ends who have been drafted over the years, although interestingly enough Warren falls just below the median as a run blocker.

    It should be reiterated that these players excel at different functions and therefore, that this is more of a 1A/1B situation than an exercise in picking a clear-cut better prospect. Risk tolerance likely factors in, as well, with Warren’s game feeling more familiar and therefore more bankable as a security blanket and YAC threat, whereas Loveland seems to have a higher ceiling and more game-breaking potential.

    Both players are worthy of being taken in the top half of the first round, but who ends up TE1 seems like an exercise in picking your poison, and whoever lands these players will be hoping to force defenses to do just that.

  • A Comparison of the Top 3 QBs in the 2025 NFL Draft Class

    A Comparison of the Top 3 QBs in the 2025 NFL Draft Class

    Photos: David Rosenblum (left, right), David Buono (middle)/Icon Sportswire

    It will be years until we determine what prospects pan out to be the best of this upcoming class, but that isn’t going to stop us from making predictions. Cam Ward, Shedeur Sanders, and Jaxson Dart are projected to be the top 3 quarterbacks taken in this class, but we don’t know the order in which they’ll be selected.

    What we do know is how they performed in their collegiate careers from a statistical and scouting perspective, and that is what will be used to project them forward. 

    Without a true consensus No. 1 like we have seen in past seasons (e.g. Trevor Lawrence, Joe Burrow), teams will have to look at the fit in their schemes to see which one will have the best potential to succeed. 

    A quick pass RPO scheme? Dart would be the look. 

    A more mobile playmaker? Ward’s your guy. 

    Someone who can avoid pressure and throw on the move? That would be Sanders. 

    Using the reports from our scouting department and the metrics from our charting operation, let’s take a look deeper into how these three compare (and contrast) and why we think each fits as they do.

    Overall

    From a statistical perspective, Dart had the better season in yards per attempt, interceptions, and SIS’ Independent Quarterback Rating (IQR, an SIS quarterback metric that builds on the traditional Passer Rating formula by considering the value of a quarterback independent of results outside of the his control such as dropped passes, dropped interceptions, throwaways, etc.). His success is all the more impressive when considering he also had the higher average depth of target by 2 yards over Ward and almost 4 higher than Sanders.

    Under Pressure and On the Move

    Most of Dart’s success comes from a clean pocket, as his IQR dips significantly when under pressure and falls behind his two counterparts. As Max Nuscher and Brandon Tew highlighted in Dart’s scouting report, When under pressure, he throws too often off his back feet and will put the ball in dangerous places.”

    Sanders is the one who led the pack in IQR when pressured, but Ward led in accuracy with a 73% on-target percentage. Dart’s was a measly 61%, which was 44th in FBS among 116 QBs with 50 attempts under pressure (put another way, he was in the 63rd percentile of those QBs).

    All three of these guys have talent on the move according to our scouts…

    “He does a good job with his accuracy on the move and has shown the ability to make good throws across his body and down the field if can’t get set.”

    – Max and Brandon on Dart


    “He is accurate on the move as long as he can get enough into the throw.”

    – Matt Manocherian on Sanders


    “His ability to extend plays is phenomenal. He scrambles with a pass-first mindset, constantly keeping his eyes downfield on broken plays.”

    – Zach Somma and Vincent Shipe on Ward

    IQR and On-Target Percentage while on the move

    Player IQR On-Target Percentage
    Shedeur Sanders 125.8 78%
    Jaxson Dart 112.9 68%
    Cam Ward 75 71%

    However, Sanders has the advantage while on the move, leading in both IQR and on-target percentage on those passes. Ward is accurate but made too many poor decisions that resulted in 4 interceptions, the most out of the three. Dart’s accuracy was better when on the run than it was while pressured, meaning he can benefit from having better pocket awareness and escaping when able.

    Accuracy on Throws to Different Areas of the Field

    My colleague Chris Lee wrote a great piece projecting accuracy from college to the pros and highlighted the on-target percentages of the quarterbacks of this year’s class. He found that, out of the three, Dart had the best accuracy on intermediate throws at 74%, followed by Sanders at 69% and Ward at 67%. On deep throws, Sanders had the edge at 55% with Dart at 51% and Ward at 46%.

    Ward’s deep ball accuracy being worse than 50% is at the low end of the spectrum. The vast majority of those misses are on overthrows, over 70 percent of them. The trend is less stark on intermediate throws, but he is still more prone to sailing a throw when he misses. According to our scouts, his footwork may be the main culprit.

    “Mechanically, Ward has decent footwork, but relies upon an extra hitch often in order to fully set his feet rather than throwing at the top of his drop consistently. Additionally, he often fails to transfer his weight toward his target, throwing off his back foot or while falling to one side or the other.”

    – Zach and Vincent on Ward’s mechanics

    Inside vs. Outside Throw On-Target Percentage

    When comparing accuracy on inside and outside throws, Dart’s is 7 percentage points higher on outside throws than the next closest in Sanders.

    Player Middle On-Target Percentage Outside On-Target Percentage
    Cam Ward 85% 64%
    Jaxson Dart 82% 80%
    Shedeur Sanders 82% 73%

    Dart shines on a specific sideline throw according to our scouts:

    “He throws with good accuracy throwing to the back shoulder along the sideline where only his receiver can get to it.”

    – Max and Brandon

    Snap to Throw Times

    All of these guys had clean-pocket snap-to-throw times in 2024 ranging between 2.43 and 2.49 seconds.  Ward had the fastest at 2.43 seconds followed by Dart at 2.47 seconds and Sanders at 2.49 seconds. However, the way that they got to those numbers differs considerably.

    In 2023, Cam Ward recorded the fastest clean-pocket snap-to-throw time we have recorded at 2.13 seconds, following up the 8th-fastest in 2022 at 2.20 seconds. The jump this year is certainly notable given that he played in a new offense in Miami. 

    Part of the reason might be a change in his drop type distribution. The number of deep drops he had last season increased to 49 in 2024 from 31 in 2023 while his short drops decreased to 351 in 2024 from 395 in 2023.

    Shedeur had nearly 3 times the amount of deep drops than the other two in 2024. According to our scouts, deep drops can get him into trouble…

    “However, he tends to hold the ball for much too long on deep drops. He doesn’t always trust his reads and will miss some on-schedule opportunities, extending plays unnecessarily and getting himself into trouble.”

    – Matt on Shedeur’s deep drops

    His 3.1 second snap-to-throw time on deep drops is roughly average. However his on-target percentage on deep drops falls to 63.4%, the lowest out of the group.

    Conclusion

    This quarterback class certainly is more up-in-the-air than ones in the past. Ward, Sanders, and Dart each have plenty of strengths and flaws. If one is provided a system that highlights their best traits (the ones we’ve noted here), we think they’ll have a better chance to thrive. There is a long time until we know the answer of who is the best, so set your predictions now and see where they take you.

  • Analytics Scouting Report: Travis Hunter, Wide Receiver

    Analytics Scouting Report: Travis Hunter, Wide Receiver

    Photo: Chris Leduc/Icon Sportswire

    Usually, the saying goes that players who are athletes but can’t catch the ball play cornerback. Well, a cornerback who won the Chuck Bednarik Award as the nation’s best defender also took home the Fred Biletnikoff Award as the nation’s best receiver (and something else called the Heisman Trophy).

    Travis Hunter is an incredible athlete whose versatility reached unprecedented levels while playing at Jackson State and Colorado. In his final year, Hunter played 700-plus snaps on both offense and defense, rarely coming off the field at any point in time.

    Even though Hunter’s intentions are to play both sides of the ball 100% of the time in the NFL, it will be rather difficult to excel at both on a full-time level. Covering the best receivers in the world AND trying to become one of the best receivers in the world is something nobody has seen and would be a monumental task to achieve. 

    Assuming he will pick one side as primary, our scouting department believes he will provide the most value as a cornerback and scouted him as such. But to capture the full picture of who Hunter is, we wanted to break down his receiving ability from a metrics perspective to find where his best part-time value can be applied on the offensive side of the ball. Playing both sides all the time may be impossible, but there will come opportunities that having one of the freakiest athletes on the field can pay dividends on the scoreboard.

    Here is what his Stats Overview would look like on our draft site if he were coming out as a receiver.

    Stat Value Rank (out of 22) Percentile
    TPTS Per Game 2.5 4 87th
    TPTS RTG Overall 91 9 57th
    TPTS Per Gm Slot 0.9 8 65th
    TPTS Per Gm Wide 1.5 3 87th
    Catchable Catch % 94% 2 96th
    Target% +/- 5.7% 11 57th
    Target Share 27% 8 61st
    Deep Route% 26% 22 0
    Unique Routes 31 17 30th
    YAC Per Rec 5.0 18 26th
    Brk+Miss Tkl Per Rec 0.28 7 74th

    Hunter comes into the draft with some of the surest hands we have seen since we started collecting data in 2016. Hunter’s 2024 ranked 14th in catchable catch percentage at 94% and 19th in on-target catch percentage at 97% among the nearly 1,200 receivers with 75 or more targets in a season since 2016. Not too bad for a corner! 

    From a Total Points perspective, Hunter led the Buffaloes with 31 Receiving Total Points, which was also good for 9th in FBS last season. The majority of this production was from out wide, notching 21 Receiving Total Points on 103 targets compared to only 9 Receiving Total Points on 22 targets from the slot, with the former being good for 6th in FBS last season.

    Travis Hunter’s Top 10 Routes Run

    Route Type Percent of Routes Percent of All Completions
    Curl 32% 25%
    Fade 10% 3%
    Slant 9% 8%
    Dig 9% 16%
    Screen 6% 19%
    Post 5% 3%
    Deep Cross 4% 4%
    Out 4% 5%
    Go/Fly 3% 4%
    Drag 2% 4%

    Hunter’s route tree is pretty concentrated to the curl route, accounting for about one-third of his routes in 2024. Colorado had to get the ball out quick with a below-average pass protection unit, so throwing to your best player on a simple curl route with hands as sure as his proved to be successful. This also could help explain his low rate of running deep routes generally.

    Even though he ran more fades and slants, the percent of his completions are lower than digs and screens. Fades make sense, as that is a lower catch probability than others and can be used as a clearout route for underneath targets. However, the gap between slants and the others is significant given that was his third most common route, but was only targeted 9 times.    

    Given that the majority of his receptions come on the curl route, it isn’t a shock that his yards after catch per reception were so low (18th out of 22 qualifying players SIS scouted this year). His ability to make people miss and break tackles is above average, so hitting him more in space where he can show that athleticism can help his YAC.

    Hunter starred on both sides of the ball in college, both with his production (most Total Points among receivers and corners in FBS in 2024) and pure athleticism. He made plenty of highlight reel catches and has sure hands in got-to-have-it situations. He has room to grow as a receiver and was not fully unleashed at Colorado on that side of the ball. It will be intriguing to see if a team lets him play both sides in some capacity, as there is a path to success with his profile.

  • Evaluating How A Quarterback’s College Accuracy Projects To The NFL

    Evaluating How A Quarterback’s College Accuracy Projects To The NFL

    Photo: Andy Altenburger/Icon Sportswire

    The NFL Draft is always a tricky thing to figure out. Drafting well can propel a franchise for sustained success, but whiffing on picks, especially at the top of the draft, can set a team back for years. This applies even more so when it comes to quarterbacks. Teams are constantly trying to find the slightest edge over their competition, and so there is great value in discerning if an aspect of a player’s play in college can reliably indicate how they will perform in that same aspect in the NFL.

    For that purpose, we wanted to investigate how strong of a correlation existed between a quarterback’s accuracy in college and in the NFL. To give it a little more specificity, we compared on-target percentage between college and the NFL at three specific depths. When running correlation and linear regression tests, we got results that are in line with what one would have expected, in terms of on-target percentage for short passes having the strongest correlation between college and the NFL.

    On-Target Percentage Depth Correlation Coefficient Adjusted R2
    Short (< 11 yards) 0.73 0.50
    Intermediate (11-20 yards) 0.36 0.09
    Deep (> 20 yards) 0.34 0.07

    The above table shows how career college on-target percentage at different depths predicts NFL on-target percentage in the first 2 to 3 years (at least 2 years and 300 passing attempts, at most 3 years). SIS started tracking college football in 2016 and 22 quarterbacks qualified by these criteria since then.

    While the order of correlation may not be the most exciting discovery, just how strong the correlation is for short passes is worth paying attention to. At the very least, a prospect’s college on-target percentage for short passes is a good piece of context to include when considering how accurate he could be at that depth at the next level.

    When observing the graph above, there are other interesting bits of information to take away. Let’s take a moment to compare Josh Allen and Zach Wilson. Both came out of college being described as boom-or-bust prospects with big arms and a penchant for big plays, but questionable accuracy, decision making, and reliance on hero ball at times. We can see that in college they had similar accuracy on short throws (and intermediate throws as well, as seen in the graph below), but at the next level Allen has been able to deliver accuracy above expectations while Wilson’s accuracy has been underwhelming. This offers insight on one potential factor out of many for why their careers have taken different directions.

    Results for correlation testing at the intermediate and deep levels are not as strong, though not insignificant and therefore still worth mentioning. One note to take away from all three charts is that Baker Mayfield was the most accurate at all three depths in college and that has translated into him now being one of the more accurate passers in the NFL, a trait that belies his gunslinger reputation.

    On-Target Percentage and Overall QB Performance

    With these results in mind, we wanted to discover whether they could tell us anything in terms of performance, and therefore we performed correlation testing between on-target percentages and IQR (Independent Quarterback Rating, an SIS quarterback metric that builds on the traditional Passer Rating formula by considering the value of a quarterback independent of results outside of the his control such as dropped passes, dropped interceptions, throwaways, etc.).

    NFL Accuracy by Depth Correlation with NFL IQR
    Short (< 11 yards) 0.55
    Intermediate (11-20 yards) 0.74
    Deep (> 20 yards) 0.24

    First, we wanted to test with NFL accuracy numbers because if there was no significant correlation, then there would not be much reason to check for correlation between college on-target percentage and NFL IQR. We can see that short and especially intermediate accuracy share a strong correlation to QB performance and therefore being more accurate on intermediate throws could be a little more valuable when evaluating prospects than at other depths.

    College Accuracy by Depth Correlation with NFL IQR
    Short (< 11 yards) 0.34
    Intermediate (11-20 yards) 0.38
    Deep (> 20 yards) 0.16

    When testing with college accuracy numbers, the results are understandably not as strong. However, the strength of correlation follows the same order with intermediate on-target percentage coming in first, followed by short, and then lastly deep. Deep accuracy showing weak correlation to QB performance makes some sense on an intuitive level even if solely because long throws are rarer and more volatile in nature.

    2024 Draft Class

    The 2024 draft class was not included in the study above due to having only one season under its belt. However, evaluating their rookie seasons against their college careers (both with a minimum of 300 attempts) could prove useful in terms of identifying bounce back or regression candidates. Among these players, when taking a look at Caleb Williams, his intermediate on-target percentage had the largest drop off at any depth between college and the NFL. If his intermediate accuracy bounces back, we could see better production from him in year two.

    Stats Bo Nix Caleb Williams Drake Maye Jayden Daniels
    Coll OnTgt% Short 83% 84% 79% 78%
    NFL OnTgt% Short 83% 81% 83% 80%
    College OnTgt% Intermediate 60% 63% 63% 63%
    NFL OnTgt% Intermediate 61% 48% 55% 64%
    College OnTgt% Deep 52% 47% 50% 49%
    NFL OnTgt% Deep 44% 40% 43% 54%
    NFL IQR 92.7 88.0 84.8 104.6

    2025 Draft Class

    Looking ahead to the 2025 draft class, outside of Riley Leonard and Tyler Shough, the other eight prospects are fairly bunched together in terms of their short accuracy in college, so making any meaningful predictions for how they will compare to each other at the next level could prove difficult. One nugget to file away is Jaxson Dart’s lead in accuracy on intermediate throws, potentially one positive indicator for his overall performance if he is able to replicate that level of precision in the NFL.

    Player OnTarget% Short OnTarget% Intermediate OnTarget% Deep
    Cameron Ward 82% 67% 46%
    Dillon Gabriel 84% 64% 58%
    Jalen Milroe 82% 56% 51%
    Jaxson Dart 84% 74% 51%
    Kurtis Rourke 83% 62% 51%
    Kyle McCord 81% 61% 55%
    Quinn Ewers 82% 66% 48%
    Riley Leonard 79% 59% 45%
    Shedeur Sanders 83% 69% 55%
    Tyler Shough 79% 58% 47%
    Will Howard 81% 60% 49%

    Conclusion

    While recognizing the limitations of sample size and various factors outside of a quarterback’s control, our study shows there is some value in considering a quarterback’s accuracy in college, especially on short throws, when projecting how accurate he may be at the same distances in the NFL.

    Separately, we found that accuracy on intermediate throws had the strongest correlation with a quarterback’s overall performance, with short throw accuracy coming in second. Deep accuracy had a significantly weaker correlation, presumably due to deep throws inherently being more volatile, at least in part. While dropping a 60 yard bomb right into a receiver’s hands may draw the most applause, a quarterback’s accuracy at shallower depths may prove to be more insightful when projecting how he might perform in the NFL.

  • What Do Analytics Show For Edge Rushers In NFL Draft?

    What Do Analytics Show For Edge Rushers In NFL Draft?

    Quarterbacks, tackles, edges, and corners – those are the premium positions in the NFL right now. The consensus seems to be that, among those positions, this year’s edge group is the deepest, with ESPN ranking six edge prospects in its top 32 and sixteen in its top 100. Both are the highest among any position group, and there are lots of flavors to be had within this class.

    Penn State’s Abdul Carter and Tennessee’s James Pearce Jr. are finesse rushers with a lot of burst off the edge. Texas A&M’s Shemar Stewart and Georgia’s Mykel Williams are long, explosive ends with questions about their production. Mike Green of Marshall is a short, bendy player who led the FBS in sacks. The point of this article is not to give detailed reports on each of these players, but to look at how this year’s edge class fares in some of our advanced metrics, so let’s get into it.

    Pressures Above Expectation

    In the 2020, and 2023, 2024 NFL drafts, the NCAA leader in Expected Pressure Rate +/- (xPressure Rate +/-) among draft prospects was the first EDGE off the board (and in 2022, Aidan Hutchinson was the 2nd EDGE off the board.)

    Player Draft Year xPressure Rate +/-
    Chase Young 2020 +12%
    Tyree Wilson 2023 +11%
    Laiatu Latu 2024 +14%

    For the uninitiated, xPressure Rate +/- (and its analog Pressures Above Expectation) is a metric that measures the probability of a player generating a pressure on a play given factors like down and distance and alignment, and then compares that to whether or not they actually generated a pressure. 

    Were the aforementioned trend to repeat this year, Pearce, Jr. (+8%) would be the first EDGE taken, although that seems unlikely considering Carter is the consensus best player at the position (at least among media).

    Player School Rank Expected Pressure Rate +/-
    James Pearce Jr. Tennessee 2nd +8%
    Mike Green Marshall 4th +8%
    Princely Umanmielen Ole Miss 11th +7%
    J.T. Tuimoloau Ohio State 12th +7%
    Donovan Ezeiruaku Boston College 13th +6%
    Josaiah Stewart Michigan 14th +6%
    Abdul Carter Penn State 16th +6%

    Snap to Pressure Times

    Carter also holds the distinction of having the fastest average time to pressure of any draft-eligible player with at least 20 pressures at a blistering 2.31 seconds, a testament to his get-off and explosiveness. The second-fastest player was at ‘just’ 2.45 seconds. 

    Of course, things aren’t as easy in the pros, but the best NFL pass rushers in this metric any given year typically hover at around 2.5 seconds. Furthermore, the 2023 collegiate leader was Carter’s former teammate Chop Robinson at an insane 2.11 seconds.He averaged 2.69 seconds in his rookie season with the Dolphins (still good for top 15).

    Player School Pressures Avg. Snap to Pressure
    Abdul Carter Penn State 52 2.31s
    Shemar Stewart Texas A&M 21 2.45s
    Mike Green Marshall 50 2.52s
    James Pearce Jr. Tennessee 32 2.54s
    Princely Umanmielen Ole Miss 32 2.55s

    Stewart is a notable inclusion here considering that he’s been knocked for his lack of production. The length, size, and explosion flashed both on tape and at the combine, but it hasn’t shown up in the stat sheet – he had just 11 TFLs and 4.5 sacks in three seasons – and these advanced stats don’t exonerate him either.

    At the other end of this is Arkansas’ Landon Jackson, the only one of the group to exceed an average snap to pressure time of 3 seconds. On top of that, his xPressure Rate +/- is negative. That’s not a great combination, and his pass rush Total Points/snap rank was good but not great (57th among qualifying edge players last season).

    Total Points

    Some notable players from the 2024 draft class fared pretty well in Total Points in 2023. Robinson (1st), Laiatu Latu (2nd), Jared Verse (6th), and Dallas Turner (30th) are sure to be familiar names. It might also be noted that Pearce Jr., who was extremely hyped at the beginning of last fall, trailed only Robinson and Latu in this metric that year. As for the 2024 leaderboard:

    Player School Pass Rush Points/Snap Rank
    Princely Umanmielen Ole Miss 0.16 2nd
    Josaiah Stewart Michigan 0.15 3rd
    Mike Green Marshall 0.14 6th
    Abdul Carter Penn State 0.13 7th
    Donovan Ezeiruaku Boston College 0.11 12th

    Meanwhile, Pearce Jr. lurks at 54th and Stewart lags behind at 168th among qualifying players at their positions after ranking 3rd and 29th last year, respectively.

    It’s not a good year to need a quarterback, but it is a good year to need someone to affect the quarterback. While there’s not a blue chip like a Myles Garrett in this class, there are lots of traitsy, high-upside players. And when you’re dealing with players who you have to project a bit more, advanced stats like the ones we’ve laid out can help paint a more complete picture.

  • New Podcast Episode: NFL Draft’s Top Defenders

    New Podcast Episode: NFL Draft’s Top Defenders

    David Rosenblum /Icon Sportswire

    On this week’s Off The Charts Football Podcast, members of the SIS football operations team analyzed some of the defensive players they liked the most in this year’s NFL Draft.

    Here are some excerpts from their analysis. Click the links to see the individual player scouting reports from our NFL Draft Website.

    Mason Graham, DT- Michigan

    “ He wins late in the down with his effort. He can win early with his hand technique. Overall, again, he’s just one of those players that he’s just gonna come in and be a starter from day one … no matter what team gets ’em, they’re gonna get a stud in the middle. He, again, he’s gonna play all three downs right off the bat and he’s gonna be a player that your team loves and you’re gonna be very happy you get ’em.”

    – Jeff Dean

    Abdul Carter, EDGE- Penn State

     ”He has probably the highest ceiling in this entire draft. I’ve never seen anybody get off the snap under control in his manner. He beats anybody to the edge and jumps across a lineman’s face. I compare it to Jalen Green in transition basketball. He’s just so smooth and so explosive. He could go in any direction at any moment.” 

    – Ben Hrkach

    Will Johnson, CB, Michigan

     ”I think this is a No. 1 corner. The instincts are really there. Being able to play in a zone coverage scheme will benefit him the most, playing in a heavy man coverage scheme will be a little more volatile for him.”

    – Jordan Edwards

    The crew also talked about Jihaad Campbell, Derrick Harmon, and Shemar Stewart. Tune in to hear what they had to say (click here and pick your podcast app) and find all our scouting reports, rankings, and stats at NFLDraft.SportsInfoSolutions.com.

  • Analyzing Ashton Jeanty’s Eye-Popping & Head-Scratching Stats

    Analyzing Ashton Jeanty’s Eye-Popping & Head-Scratching Stats

    Photo: Steve Nurenberg/Icon Sportswire

    If you haven’t already, check out the SIS NFL Draft website at NFLDraft.SportsInfoSolutions.com. You can find scouting reports, stats, and rankings for the top NFL prospects. Click the hyperlinked names here to see the scouting reports for those players.

    Former Boise State running back Ashton Jeanty set the world aflame with his 2024 performance, starting the year with a six-game stretch of over 200 yards per game and 10 yards per attempt. He finished up with a pedestrian 180 yards per game and 7 yards per attempt, which were good enough to be a finalist for the Heisman.

    He might not be the “generational” talent that caused people to drool over the likes of Saquon Barkley and Bijan Robinson in recent years, but he is plenty exciting and still given a strong starting grade by our scouting staff.

    Of course, with all that hype comes some extra scrutiny, the perennial nitpicking that convinces people not to take a player as high as some might want. I’m here to offer just a little dab, a splash, of cold water based on how others with his rushing profile have performed at the next level.

    Elusiveness

    Jeanty showcased an incredible ability to break tackles in his college career, with a per-carry rate eclipsed by only Javonte Williams among rushers from the 2020 Draft to now with at least 100 NFL carries. His overall elusiveness (broken and missed tackles per attempt) puts him behind only Williams and Bijan Robinson.

    That said, his missed tackle rate is in the middle of the pack, at least among NFL-caliber prospects. And that’s relevant because the results are a bit discouraging for players who had at least 5 percentage points more broken tackles than missed tackles in college (admittedly arbitrary), with worse performance measures and more injuries forcing missed time.

    College Elusiveness Similar (+/- 5%) BT/A > MT/A
    Players 26 14
    EPA per 100 att -2.4 -6.6
    Total Points per 100 att 6.1 3.7
    Games per injury 20.0 14.7

    (For more info on Total Points, see our primer here.)

    Dominance on outside runs

    Jeanty had incredible success rates on outside runs in his last two years at Boise State, roughly 10 percentage points above average. On the flip side, he was less and less successful running between the guards each year.

    Ashton Jeanty Success Rate on inside vs. outside runs

    Inside Outside
    2022 53% 34%
    2023 50% 55%
    2024 42% 57%
    Career 47% 49%

    I’m not sure if you’d expect this, but in general inside runs and outside runs have roughly the same success rate. So when a player shows a tendency to be out of balance with that, it feels like something we should look a little deeper into.

    Jeanty’s outside-inside profile—namely, his success coming more from outside runs—suggests that he might underperform, although he might also be a little healthier. Among players in the last several drafts with at least 200 college carries and 100 NFL carries in their first two years, outside-favoring players in college have been a little worse on a per-carry basis with slightly fewer injuries that have caused missed time.

    College Success% Inside better Similar (+/- 2%) Outside better
    Players 18 9 13
    EPA per 100 att -1.1 -5.5 -5.8
    Total Points per 100 att 5.9 6.0 4.3
    Games per injury 17.1 16.2 21.0

    So you’re out on this guy?

    I’ve somehow put this really exciting player into two buckets that suggest he’s less exciting. That doesn’t mean I’m out, but it does mean I’m glad we’re not hearing top-5-pick level hype.

    Of course, sample size is something we need to be mindful of; we just don’t have a ton of backs to judge on (at least over the years SIS has charted everything above). Have to mention that.

    And not all of these players had the same overall grade coming out. Jeanty’s comps in terms of the combination of these splits are J.K. Dobbins, Javonte Williams, Kenneth Gainwell, Dameon Pierce, Zamir White, and Cam Akers. None of them had the high-level projection that Jeanty does.

    But by the same token, the characterization we’re looking at is stylistic, and not about performance. Yes, we’re using success rate and broken and missed tackles, all of which express skill, but it’s the relative success across splits that we actually care about here. So I think we’re at least justified in bringing some suspicion to the table.

    Little bonus nugget

    To whatever extent you buy what I’m selling above, you might be interested in which of this year’s backs fall into the cluster that has the best historical production. The one that features Jonathan Taylor, Bijan Robinson, Jahmyr Gibbs, Devon Achane, Kyren Williams, Jaylen Warren, and Bucky Irving.

    North Carolina’s Omarion Hampton is in there, although just barely. His career broken tackle rate is 4.9 percentage points higher than his missed tackle rate. He has the same grade from our staff as Jeanty.

    Similar story with Arizona State’s Cam Skattebo, except with a 4.8 and a low-end starter grade from our staff.

    If you want someone who clears the thresholds easily, Oklahoma State’s Ollie Gordon II fits the bill. He has a three-down backup grade, along with a lot of other backs on our board.

  • What Does The Data Show About Patrick Mahomes and Favorable Officiating?

    What Does The Data Show About Patrick Mahomes and Favorable Officiating?

    Photo: Scott Winters/Icon Sportswire

    With Kansas City on the precipice of making NFL history – a Super Bowl threepeat – some NFL fans are feeling a bit of Mahomes fatigue. The 29-year-old signalcaller has already won three Super Bowls, is about to compete for his fourth, and seems poised to be the league’s boogeyman for the foreseeable future. And just like Brady before him, grumbling about favoritism he gets from officiating crews has emerged from those who deny or downplay his greatness.

    This largely seems like infantile coping – it doesn’t take a veteran NFL scout to see that Mahomes is extremely talented – but we at SIS are morbidly curious about whether or not there’s any validity to the idea that Mahomes is the NFL’s favorite son. 

    Fortunately, we track officiating crews as far back as our database goes (2016). We could tell you which crews call the most Defensive Pass Interferences, which crews are more liable to throw flags on the visiting team, which crews throw flags in late-game situations, or which crews get overturned on review the most, and we can also tell you whether or not the Kansas City offense benefits disproportionately from officiating.

    It’s first important to acknowledge that each ref crew officiates a bit differently in a given year. For example, in 2024, Clay Martin’s crew called offensive holding penalties almost twice as often as the NFL average, whereas Tra Blake and company came in below the NFL average and rarely flag holds on passing plays. 

    From here, we can set a baseline for each crew across multiple categories (e.g. home/away, offense/defense, penalty type, situation, etc.) and compare that to a team’s penalty profile in aggregate. If a team consistently sees more (or fewer) penalties than would be expected based on the crews that officiated them, then there’s at least something to talk about.

    There are, of course, other factors that could reasonably result in an officiating crew deviating from their baseline in a given game. For example, a team may have a handsy corner who creates a lot of contact and draws a lot of DPI calls. A quarterback might be really good at drawing offsides or pass interference.

    Even with that in mind, Kansas City’s offense doesn’t stand out in a meaningful way.

    They are one of eight offenses in 2024 who were both penalized below expectation and drew defensive penalties above expectation, but neither of these rates were to an egregious extent. The Chiefs ranked 9th in offensive penalty rate against crew average (-7%) and 12th in defensive penalty rate (+7%), but the latter figure doesn’t compare to the Joe Burrow-led Bengals (+24%) or Josh Allen’s Bills (+26%). Nor does it come even close to the rate at which defenses playing the 2020 Super Bowl champion Buccaneers were penalized (+29%).

    In fact, if anything, Mahomes is enjoying fewer flags against the defense than he ever has. In the beginning of his career, defenses playing Kansas City were consistently penalized at a very high rate relative to expectation. There was a run from 2018-2022 where Kansas City saw opposing defenses flagged at a pretty high rate, ranging from +24% at the low end to +38% at the high end. They’re in no way notable over the last two seasons, though. 

    Graphic showing where the Chiefs ranked in Defensive Penalties Gotten BY Offense. In 2016, they were middle of the league with just below 50. In 2017, 2018, and 2019 they ascended in each year, peaking at the #1 spot with 70 drawn in 2019. They also had the most in the league in 2020, though with just over 60 in a shortened season. Over the next 3 seasons, the total declined each year. The last 2 years they've been in the top-third of the league with around 50.

    How impactful is that imbalance in penalties? The net EPA gained on penalties never exceeded 0.65 EPA per game in any season during that window. That may seem high, but it barely cracks the top 50 of single team seasons over the past 9 years, and it pales in comparison to the 2020 Bucs who were 1st at +1.8 per game. The EPA in and of itself admittedly cannot account for wiping big, negative outcomes off the board, but the number isn’t so high in and of itself.

    Now, is any of this hard evidence that the NFL issued some kind of officiating mandate or that the referees otherwise showed favoritism to Kansas City? No. You’d need a more rigorous model to control for other variables (including the teams and players themselves) and do some investigative reporting to be able to responsibly conclude such a thing. But, is it interesting enough to throw out there and instigate some discourse while remaining on the fence? Yes, and it’s certainly not what we expected to find, either.

    If you’ve already got your tin foil hat on, you’ll have to take it up with the NFL referees’ union, who recently shot down assertions that the Chiefs get favorable calls. That, at the very least, seems to be true the last couple of years, in which penalties have leaned against them on average (in terms of EPA per game). Beyond that, we’re staying out of this for now, and we leave the rest to those of you who are more given to conspiracy theories.

  • Stat of the Week: The Eagles Have A Game-Changing Defense

    Stat of the Week: The Eagles Have A Game-Changing Defense

    If you haven’t figured it out by now, we like defense here and the tone of what we write about often reflects that.

    This year’s Super Bowl is ripe for talk about defense because the best defensive team in the NFL is in it, the Philadelphia Eagles.

    The Eagles defense has everything you could ask for. We measure team performance utilizing our player value stat, Total Points, an explanation of which can be found here. By our measure, the Eagles have a top five run defense, pass coverage, and pass rush unit. No other team this season was in the top five in more than one of those areas.

    Philadelphia’s most valuable defensive player by Total Points was linebacker Zach Baun. Baun led the Eagles in tackles and nearly halved his broken and missed tackle percentage from last season when he was with the Saints, going from 18% to 11%. He became one of the league’s best run defenders by Total Points and was a solid defender whether rushing the passer or in coverage (he ranked 9th among linebackers in Pass Coverage Total Points). In sum, he had the most Total Points of any player at his position during the regular season.

    Defensive tackle Jalen Carter ranked 4th at his position in Total Points this season. He was a top five defensive tackle at rushing the passer and ranked just outside the top five in run defense. Another defensive tackle, Milton Williams, specializes in pass rush. Though he doesn’t play as much as Carter, he’s a smidge more effective than Carter at getting pressure and in doing things that provide value to his team.

    The Eagles’ top defender in pass coverage is safety C.J. Gardner-Johnson, partly a product of his team-high 6 interceptions. Cornerback Darius Slay has a 42% completion percentage against when targeted, the 5th-lowest of any cornerback targeted at least 30 times. Remember too that we noted that Baun, at linebacker, was also a standout in pass coverage during the regular season.

    The Eagles will be challenged by Chiefs tight end Travis Kelce but they can feel confident going into that matchup. On a per-play basis, they were a top five team in pass coverage against each of the receiving position groups, running back, wide receiver, and tight end.

    We haven’t mentioned the Chiefs defense yet and that’s because it’s OK, but nothing to write a full-fledged article about. Kansas City ranks 13th defensively in Total Points Per Play. Where the Chiefs have the edge in this game is with a spectacular player who can be a good defense’s kryptonite, Patrick Mahomes.

    The Chiefs winning this game on the back of their defense would be surprising, though admittedly not impossible. But as our COO Matt Manocherian pointed out on The Off The Charts Football Podcast, the Eagles have more “wreck the game” players, particularly on the defensive line.

    For those wondering, a No. 1 ranked defense has not won a Super Bowl since we started tracking the NFL in 2016 (the 2020 Buccaneers came closest, 2nd). The last time the No. 1 team in Defensive Runs Saved won the World Series was in 2016, when the Cubs did it. We’ll get back to baseball next week.

  • Andy Reid’s Best Coaching Job and Other Things We Learned From Coaching Wins Over Expected

    Andy Reid’s Best Coaching Job and Other Things We Learned From Coaching Wins Over Expected

    Photo: John Byrum/Icon Sportswire

    When you win 15 games in the regular season, as the Chiefs did in 2024, you need a lot of things to go right. But things going right has been a trademark of the Andy Reid regime, Patrick Mahomes or no Patrick Mahomes (we’ll explain in a second).

    SIS has created an expected wins stat that measures how many games a team should have won based on the comprehensive suite of things that we measure from every play of every game. It utilizes a summed version of each player on a roster’s Wins Above Replacement (WAR, which emanates from our player value stat, Total Points).

    To restate, this is not a projection of future wins—this is using the players’ performance on the field as a measure of the team’s quality and converting that to an expected wins number.

    By those measures, these Chiefs were expected to win 9.8 games this season. They won 15. That’s a 5.2-win gap between actual and expected wins, which we’ll call Wins Over Expected (and somewhat-contradictorily shorten to WOE). That’s the biggest differential between actual and expected wins of any team back to 2016, the first year we started tracking football.

    The next-best is the 4.4 Wins Over Expected by Reid’s Chiefs in 2016, the year before Mahomes joined the team. Reid has three of the top six seasons in that time.

    Admittedly there are some limitations when using this stat to evaluate coaches. It can’t capture everything a head coach does. It can help show how influential timeouts, challenges, substitutions, playcalls, etc. can be, but it does not incorporate the coach’s influence in practices, drafting, free agency acquisitions, etc.

    Top Coaching Seasons

    Here are the seasons in which a team most surpassed its expected win total.

    Top Individual Seasons since 2016

    Season Coach Wins Over Expected
    2024 Chiefs Andy Reid 5.2

    (15-9.8)

    2016 Chiefs Andy Reid 4.4

    (12-7.6)

    2022 Vikings Kevin O’Connell 4.4

    (13-8.6)

    2016 Texans Bill O’Brien 4.3

    (9-4.7)

    2019 Texans Bill O’Brien 4.0

    (10.0-6.0)

    2020 Chiefs Andy Reid 3.7

    (14-10.3)

    As noted, Reid, who often polls as one of the NFL’s best coaches, has three of the top six seasons in that time (two with Mahomes). Kevin O’Connell led the Vikings to a very surprising finish in 2022 and received heaps of praise for his immediate impact during his first season as a head coach.

    The coach that is not thought of in the same breath as Reid and O’Connell is Bill O’Brien. Off-the-field issues are not a part of the metric, but during his first six seasons as the Texans head coach he finished at least two games above .500 every year except one. Additionally, our metric suggests that the Texans lacked a lot of high-end valuable players and were expected to finish at or under .500 every year, making what they did under O’Brien all the more impressive.

    Worst Coaching Seasons

    The bottom of the list is interesting for different reasons.

    Worst Individual Seasons since 2016

    Season Coach Wins Over Expected
    2019 Cowboys Jason Garrett -5.2

    (8-13.2)

    2016 Saints Sean Payton -4.2

    (7-11.2)

    2023 Bills Sean McDermott -4.1

    (11-15.1)

    2016 Chargers Mike McCoy -4.0

    (5.0-9.0)

    2016 Panthers Ron Rivera -4.0

    (6.0-10.0)

    2017 Browns Hue Jackson -3.9

    (0-3.9)

    One of the first things that stands out is that almost all of these teams were supposed to be good or even exceptional based on player performance (except the Browns). Of the top coaches, there were a mix of teams that were supposed to miss the playoffs as well as playoff teams.

    Sean McDermott is the only coach on this list still with his team. On the other side, Jason Garrett was fired after the 2019 season, Mike McCoy was fired after the 2016 season, and Hue Jackson was fired midway through the following 2018 season.

    This data set is certainly interesting to look at, but coaches and teams have ups and downs. Sean Payton followed up a 2016 season in which the Saints were four wins below expectations with four straight playoff berths, and Ron Rivera made the playoffs the year after his Panthers were four wins below expectations as well. To look at coaches, it makes sense to look at their career in cumulative terms.

    Most and Fewest Total Wins Over Expected since 2016


    Coach Total Wins Over Expected
    Mike Vrabel 10.1
    Mike Tomlin 9.9
    Pete Carroll 9.7
    Kevin O’Connell 8.1
    Bill O’Brien 7.9
     

    Coach Total Wins Over Expected
    Doug Marrone -9.6
    Bruce Arians -9.2
    Anthony Lynn -7.7
    Hue Jackson -7.1
    Doug Pederson -6.5

    As noted earlier, O’Brien and O’Connell had multiple seasons where they greatly exceeded expectations, so it is not a surprise to see them at the top of the list of coaches with the most excess wins. Mike Tomlin and Pete Carroll are both Super-Bowl-winning head coaches with sustained success.

    New Patriots coach Mike Vrabel being No. 1 may be a little bit of a surprise, but he overperformed his team’s expected wins in five of his six seasons as the Titans head coach. The only season the team underperformed was his last. If you hear anyone say that Vrabel gets the most out of his players, think back to his presence atop the list here.

    Reid actually didn’t make this list, as despite those three great seasons for exceeding expectations, the sum of his other six dropped him below the top five. He’s 7th at + 7.3.

    The bottom coaches are a wild mix. Doug Marrone and Hue Jackson are not surprises as they both had a lot of losses in a short amount of time and were quickly shown the door. Anthony Lynn had ups and downs, but his team underperformed in his final two seasons. The other two coaches are very interesting as they both won the Super Bowl. Bruce Arians lost a lot of wins due to some really high expectations for his teams. Even the 2021 Buccaneers, who were expected to win 13.8 games, technically underperformed with 13 wins. Also, the 2020 Buccaneers were expected to win 14.7 games, and won only 11 during the regular season, the biggest ding on Arians’ ledger.

    Doug Pederson has eight seasons of coaching in the dataset and is split with four seasons with positive Wins Over Expected and four seasons with negative Wins Over Expected. While the total number of seasons on each side of the ledger is equal, the impact is not. Pederson’s highest WOE was with the 2018 Eagles, who finished 1.2 Wins Over Expected. On the other side, in all four of Pederson’s negative seasons his team finished at least -1.8 Wins Over Expected, the worst being the 2024 Jaguars at -3.3 WOE.

    One interesting coach who was JUST off the bottom is Kyle Shanahan, who has -6.3 Wins Over Expected. Shanahan is often thought of as one of the greatest coaches in the NFL currently, but, according to the metric, he often underperforms. His teams are often loaded with top-end skill position players, and despite how highly one would rank Brock Purdy in terms of NFL quarterbacks, he is not a negative asset to his teams.

    Shanahan has eight seasons in the dataset as well, but amazingly, only two are above zero. As is the case with some other coaches, the expected wins for some of his teams were really high. His worst season was with the 2023 49ers, whose expected wins were 14.6, and they won “only” 12 games (-2.6 WOE), but his next three worst seasons had lower expectations. The 2020 and 2024 49ers were expected to win roughly eight games, they only won six each year, and the 2018 49ers were expected to win five when they only won four.

    One issue with that current list is it does not account for time. Bad coaches are usually fired and good coaches are usually with a team for longer. The final list helps control for that by averaging the Total Wins Over Expected across three seasons. So for everyone with at least 16 games coached, this is what we’d expect from them in 3×17 = 51 games. 

    Most and Fewest Total Wins Expected per Three Seasons since 2016


    Coach WOE/3 Seasons
    Kevin O’Connell 8.1
    Dave Canales 7.4
    DeMeco Ryans 7.0
    Brian Flores 5.5
    Bill O’Brien 5.2
     

    Coach WOE/3 Seasons
    Mike McCoy -12.9
    Hue Jackson -7.6
    Lovie Smith -7.4
    Brian Callahan -7.3
    John Fox -6.3

    O’Brien makes the list again with two highly-thought-of young coaches, O’Connell and DeMeco Ryans, joining him on the list. Dave Canales has only one season under his belt so there is still plenty to figure out, but he did earn 2.5 WOE from this past season with the Panthers. Also included in the top-five is Brian Flores who earned positive WOE in each of his three seasons as the Dolphins head coach.

    Most of the bottom coaches do not have a robust dataset since 2016 for the reason mentioned earlier: head coaches with bad results tend to get fired quickly. Mike McCoy and Lovie Smith have only one season in the dataset and both performed well under expected. Titans head coach Brian Callahan also has one season, but it was only his first so there may be time to turn things around, especially if they hit on their 2025 NFL Draft picks. John Fox and Hue Jackson both have three seasons, although Jackson did not finish his third, but both were shown the door.

    It is not easy to try and determine what makes a good NFL head coach. There are so many intangibles that make it difficult to separate out the raw data coupled with an uneven player talent pool. But nonetheless, we try with Wins Over Expected to measure some of it in aggregate.

    Reid has turned productive Wins over Expected seasons into Super Bowl trophies, which is why, even if the metric makes it seem close, people do not think about Andy Reid in the same manner as Bill O’Brien.