Category: Football

  • NFL Advanced Stat Leaders Entering Week 17

    NFL Advanced Stat Leaders Entering Week 17

    Photo: Matthew Huang/Icon Sportswire

    Welcome to this week’s edition of the SIS StatPack, our weekly look at leaderboards for Total Points and some of our charting stats. 

    You can e-mail mark@ww2.sportsinfosolutions.com for a free one-week subscription to our DataHub Pro, which allows you access to a wealth of information about NFL team and player performance.
    Important note: Wednesday’s games are not included in the calculations
    Total Points Leaderboards
    Highlights from the leaderboards in our flagship stat, Total Points, which attempts to measure everything that happens on the field (full primer here):
    * The top three teams broken down by offensive and defensive unit in terms of Total Points Per Play:
    Offense
    Passing: 1. Ravens, 2. Bengals, 3. Bills
    Rushing: 1. Ravens, 2. Commanders, 3. Bills
    Receiving: 1. Ravens, 2. Lions, 3. 49ers
    Blocking: 1. Bills, 2. Lions, 3. Eagles
    Yes, the Ravens rank 1st in three of the four categories (and that doesn’t include anything from Wednesday’s win). They pretty clearly have the best offense in the NFL.
    Defense
    Run Defense: 1. Browns, 2. Dolphins, 3. Eagles
    Pass Rush: 1. Steelers, 2. Packers, 3. Cowboys
    Pass Coverage: 1. Broncos, 2. Chargers, 3. Lions
    Nine different teams encompass those top three spots. The Eagles are the No. 1 defense overall. They rank 4th in pass rush and 7th in pass coverage.
    * Two players atop the Total Points leaderboard have at least 10 Total Points more than the next-closest player at that position.
    George Kittle is dominating at tight end for the 49ers this season. He leads with 48 Total Points. The next-closest player is Trey McBride of the Cardinals with 35.
    Kittle is averaging an NFL-best 11.7 yards per target this season. He ranks 4th among tight ends in average distance of target (8.2 yards), minimum 30 targets.
    Lions safety Kerby Joseph leads the position with 65 Total Points. That’s actually the most of any non-quarterback this season.  The next-closest safety is Amani Hooker of the Titans with 51. 
    Joseph entered the week tied for the NFL lead with 7 interceptions this season.

    Total Points Power Rankings

    The Top 10 teams in the NFL when taking into account Total Points Per Play for offense, defense, and special teams.

    1. Ravens
    2. Packers
    3. Bills
    4. Lions
    5. Broncos
    6. Eagles
    7. Vikings
    8. Cardinals
    9. Chiefs
    10. Chargers 

    Top 5 Offenses

    1. Ravens
    2. Bills
    3. Lions
    4. Packers
    5. Bengals

    Top 5 Defenses

    1. Eagles
    2. Broncos
    3. Packers
    4. Vikings
    5. Seahawks

    Total Points Leaders: Quarterbacks

    1. Joe Burrow
    2. Lamar Jackson
    3. Josh Allen
    4. Patrick Mahomes
    5. Jayden Daniels 

    Total Points Leaders: Running Backs

    1. Jahmyr Gibbs
    2. Derrick Henry
    3. James Conner
    4. Bucky Irving
    5. Josh Jacobs

    Total Points Leaders: Wide Receivers

    1. Ja’Marr Chase
    2. Jauan Jennings
    3. Puka Nacua
    4. Brian Thomas Jr.
    5. A.J. Brown

    Total Points Leaders: Defensive Ends

    1. Jonathan Greenard
    2. Jared Verse
    3. T.J. Watt
    4. Myles Garrett
    5. Greg Rousseau 

    Total Points Leaders: Linebackers

    1. Zack Baun
    2. Brian Burns
    3. Bobby Wagner
    4. Fred Warner
    5. Andrew Van Ginkel

      Total Points Leaders: Cornerbacks

    1. Marlon Humphrey
    2. Keisean Nixon
    3. Christian Gonzalez
    4. Pat Surtain II
    5. Kenny Moore II

      Total Points Leaders: Safeties

    1. Kerby Joseph
    2. Amani Hooker
    3. Julian Love
    4. Jessie Bates
    5. Nick Cross


    Note: These rankings are based on unrounded totals which virtually eliminates ties between players or teams

    E-mail mark@ww2.sportsinfosolutions.com for a free one-week subscription to our DataHub Pro, which allows you access to a wealth of information about NFL team and player performance.

    Charting Leaderboards

    Leaderboards in various statistical categories based on video review by our staff, including long passes, yards after contact, and pressures.

    Leaderboards in various statistical categories based on video review by our staff, including long passes, yards after contact, and pressures.
    * With 2 receptions on passes thrown at least 20 yards downfield last week, Justin Jefferson now has the lead with 14 such receptions this season. Jefferson could lead the league in that stat for the second time in his career. He tied Calvin Ridley for the league lead with 14 in his rookie season.
    * We list the leaders in quarterback pressures below (and in the PDF attachment). But to break it down a little deeper: The current leader in quarterback hurries is Chris Jones and Maxx Crosby with 43. The leader in quarterback hits is Zach Allen with 46. Allen also leads in quarterback knockdowns with 29. No other player entered Week 17 with even 20 knockdowns.
     

    Most Completions, Pass Attempts 20+ Yards Downfield

    1. Sam Darnold 29
    2. Jordan Love, Geno Smith 24
    4. Justin Herbert, Josh Allen 22 

    Most Receptions, Targets 20+ Yards Downfield

    1. Justin Jefferson 14
    2. Darnell Mooney, George Pickens 13
    4. DK Metcalf 12
    5. Alec Pierce, Terry McLaurin, Calvin Ridley, Courtland Sutton, Jordan Addison 10

    Most Yards After Contact (Rushing)

    1. Derrick Henry 898
    2. Saquon Barkley 897
    3. Josh Jacobs 847
    4. Kyren Williams 820
    5. Bijan Robinson 794

    Most QB Pressures

    1. Trey Hendrickson 73
    2. Maxx Crosby 68
    3. Zach Allen, Jared Verse 61
    5. Chris Jones, Micah Parsons, Myles Garrett 60

    Most Pressures Above Expectation

    1. Osa Odighizuwa 23.3
    2. Chris Jones 18.8
    3. Micah Parsons 18.2
    4. Trey Hendrickson 16.9
    5. Myles Garrett 15.8

    Click here for our full Charting StatPack featuring deeper lists on these stats.

    E-mail mark@ww2.sportsinfosolutions.com for a free one-week subscription to our DataHub Pro, which allows you access to a wealth of information about NFL team and player performance.

    Matchups and Mismatches

    When we look at matchups by unit and compare the teams playing a particular game, there are intriguing matchups and mismatches each week.

    Find your own matchups and mismatches here. You can also find much of this information at the SIS DataHub Pro.

    Here are some we noticed:

    (All references to rankings are in the context of Total Points Per Play)

    * What a great matchup the Packers offense against the Vikings defense is going to be. The Packers rank 7th in the NFL in Passing, Receiving, and Blocking, and 4th in Rushing. The Vikings rank 5th in Run Defense, 6th in Pass Rush, and 9th in Pass Coverage.

    * There’s also a good matchup of strength vs strength in Lions-49ers. The 49ers have the No. 3 receiving unit. The Lions have the No. 3 pass coverage group.

  • Which NFL Teams Have Been Most and Least Impacted By Injuries?

    Which NFL Teams Have Been Most and Least Impacted By Injuries?

    Photo: Matthew Pearce/Icon Sportswire

    This article has gotten an inordinate number of pageviews and we believe that those clicking on it are looking for the most updated info.

    This article is entering Week 13 of 2025. The original version of this article (covering 2024) is below it.

    Look, if you’ve followed along with the 2025 NFL season, you probably know what team I’m about to focus on here. If the conversation is about the cumulative effect of injuries on a team this year, that starts and ends with the 49ers.

    They already knew they were going to be missing Brandon Aiyuk for much of the season, and from that point have also sustained injuries to Nick Bosa, George Kittle, Fred Warner, Ben Bartch, Brock Purdy, and Ricky Pearsall, among others. As a result, they’ve lost the most potential productivity to injury of any team in the NFL.

    Most Value Lost To Injury, 2025 NFL season (through Week 13)

    Team Games Missed Total Points Missed
    49ers 206 156
    Cardinals 177 151
    Bengals 115 142
    Commanders 143 136
    Dolphins 169 123
    Bills 212 123
    Giants 192 116
    Buccaneers 186 116
    Falcons 140 114
    Chargers 194 109
    Saints 152 103
    Panthers 133 95
    Colts 176 91
    Lions 226 89
    Bears 240 84
    Steelers 183 83
    Ravens 128 73
    Chiefs 123 71
    Jaguars 110 70
    Texans 167 65
    Packers 157 64
    Titans 116 63
    Vikings 122 63
    Cowboys 177 62
    Raiders 62 57
    Jets 130 54
    Seahawks 160 53
    Broncos 128 49
    Eagles 111 40
    Browns 113 35
    Rams 97 35
    Patriots 107 25

    The value we’re measuring here is each injured player’s Total Points per game over his previous 17 games, multiplied by the number of games missed due to injury. This only counts injuries sustained since August 1.

    The Walking Wounded

    The Bengals have had substantially fewer total games missed to injury, but Joe Burrow’s loss alone cost them as many points as half the teams in the NFL have suffered in total this year. Without that injury they’d rank in the fortunate half of teams.

    The Commanders are at the top of this list because of Jayden Daniels’ injury-plagued season. But they have also missed wide receiver Terry McLaurin, running back Austin Ekeler, safety Will Harris, and defensive end Deatrich Wise.

    Kyler Murray’s injury has not affected the Cardinals’ fortunes as much as you’d think because backup Jacoby Brissett has been more than serviceable, but he still ranks among the most impactful injuries of the year by Total Points. Running back James Conner has been a favorite of Total Points for a little bit now, so his absence also looms relatively large.

    Others Receiving Votes

    A training camp injury to tackle Rashawn Slater started the ball rolling early for the 10th-ranked Chargers, and the hits kept coming as opposite tackle Joe Alt has dealt with multiple ailments. Los Angeles has more games missed than all but the 49ers and Bills in terms of Total Points missed.

    The Lions and Bears have the most games missed due to injury in the league, but they rank just 14th and 15th respectively in Total Points missed. They’ve been fortunate to not have their biggest names go down so far this year, although the Lions’ fortunes have turned a bit recently with injuries to Sam LaPorta and Amon-Ra St. Brown. 

    Dodging Raindrops

    The Patriots and Rams are the most fortunate teams so far in terms of health, which sheds a little light on their strong showings this year. The five teams with the fewest Total Points missed due to injury (adding in the Browns, Eagles, and Broncos) are currently a combined 41-20, compared to 24-37 from the top 5 teams.


    ——————————————————–

    For those curious, this is the original version of the article, which is through 2024 Week 16

    By Brett Barnes

    As we finish out the final two weeks of the regular season, we can take a look back at the amount of injuries that each team has had to endure throughout this 2024 season. While the sheer amount of injuries a team has to deal with certainly takes its toll, most of the time the quality of players being lost is the more important variable. 

    When a team’s depth is tested, fans can really see the caliber of coaching staff and front office their organization has. The Lions are a great example this season of being a team that hasn’t missed a beat while dealing with a ‘next man up’ mentality all season. They top the NFL with the most Total Points missed due to injury this season.

    Most Total Points Missed Due To Injury

    Team Total Points Missed due to Injury
    Lions 158
    Saints 149
    Browns 141
    Buccaneers 136
    49ers 132
    Raiders 119
    Panthers 117
    Steelers 109
    Texans 108
    Titans 101

    Along with the Lions, the Buccaneers, Texans, and Steelers find themselves in the middle of the playoff picture while dealing with a lot of talent loss during the season. 

    That number will continue to grow for the Texans as they lost one of their best playmakers in Week 16 to a gruesome left knee injury. Tank Dell has had a nice connection with QB C.J. Stroud since the two made their NFL debuts together last season. Dell missed the end of last season after breaking his fibula on that same leg in Week 13. 

    The Texans passing offense took a big hit when he wasn’t on the field last season. 

    Houston Texans in 2023 (Through Week 16)

    Dell On the Field Dell Off the Field
    EPA/60 Plays 4 -6
    EPA/60 Passing Plays 9 -4
    Completion % 65.6% 61.5%
    Yards per Attempt 9.2 6.7

    Among players with at least 50 targets, Dell ranked 15th in the league last season with 9.5 yards per target. The Texans were already dealing with the loss of Stefon Diggs and now losing Dell for the very end of the season again can make you wonder if their offense is going to have enough explosiveness to make a deep playoff run (they didn’t score on offense in Wednesday’s loss).

    On a more positive note let’s look at the teams that have been relatively healthy this season. 

    Fewest Total Points Missed Due To Injury

    Bottom 10 Total Points Missed due to Injury
    Ravens 33
    Commanders 34
    Falcons 45
    Eagles 46
    Chiefs 47
    Vikings 49
    Packers 50
    Patriots 50
    Chargers 52
    Bills 55

    Unsurprisingly, health might be one of the biggest indicators of playoff chances a team has in a season, as 9 of the 10 teams listed here are in the playoff chase. That the Patriots are not in playoff contention despite so few injuries shows the talent deficit that the team has been dealing with in 2024.

    There are plenty of examples of the teams on this list keeping key players on the field or getting them back from injury in a reasonable amount of time. For example, the Packers have benefited from their injured players being out for  recently welcomed back 2nd-round rookie linebacker Edgerrin Cooper in Week 15. He missed 3 games with a hamstring injury, but has been one of the most impactful players at his position the past two weeks. 

    The Packers will look to continue expanding his role and have him be an important piece of their defensive puzzle as they head into the playoffs.

    During Weeks 15 and 16 Cooper ranked 8th among all linebackers in Points Saved in pass coverage, 2nd in Points Saved per pass rush, and 17th in Points Saved during rushing plays. He’s shown his versatility these past few games and opposing offenses have felt his presence for the Packers defense all season.

    Green Bay Packers in 2024

    Cooper On the Field Cooper Off the Field
    EPA/60 Plays -6 -4
    EPA/60 Passing Plays -11 -1
    Sack % 9.5% 6.6%

    Cooper is an under-the-radar player who has a chance to make a name for himself in his first season as a pro as the Packers look to build off of their playoff success last season.

    Looking ahead to the playoffs, we can see what teams are going to be missing with the current players on injured reserve. We can also break that down into offensive and defensive players to see if teams are going to be hurting more on one side of the ball. Note where the Packers are:

    Bar graph showing a breakdown of which teams have missed the most Total Points on the offensive side and the defensive side. The point of emphasis is on the Lions, whose losses are overwhelmingly on the defensive side (Aidan Hutchinson).

    It’s been well documented that the Lions defense has been decimated, and that’s represented here. The Seahawks and Steelers are missing more on the offensive side, with most of that being tied to offensive linemen. The Broncos will continue to miss the services of tackling machine Alex Singleton, but the offensive side of the ball remains healthy at the right time of year. 

    Injuries can happen at any time, and we know losing key players can sometimes be too much to overcome. We wish every team a clean bill of health as we head towards the most exciting time of the NFL season. 

  • NFL Advanced Stat Leaders entering Week 16

    NFL Advanced Stat Leaders entering Week 16

    Photo: Jordon Kelly/Icon Sportswire

    Welcome to this week’s edition of the SIS StatPack, our weekly look at leaderboards for Total Points and some of our charting stats. 

    You can e-mail mark@ww2.sportsinfosolutions.com for a free one-week subscription to our DataHub Pro, which allows you access to a wealth of information about NFL team and player performance.
    Total Points Leaderboards
    Highlights from the leaderboards in our flagship stat, Total Points, which attempts to measure everything that happens on the field (full primer here):
    * There is basically a three-way tie for the top spot within the team Total Points Power Rankings. The Lions, Ravens, and Bills are separated by a fraction of a point.
    Perhaps the most interesting thing within those rankings is where the Cardinals stand (8th) relative to their division rivals, the Seahawks (10th) and Rams (21st). The Rams and Seahawks are currently tied for the division lead.
    * For those of you staring at our quarterback Total Points leaderboard and saying “What the heck is Bo Nix doing there?” we’ve got answers. Our Alex Vigderman looked into Nix’s numbers:
    In Nix’s case, there are a lot of plays where he does all right and something goes horribly wrong, or the play should have gone horribly wrong and he escapes with a kinda-bad outcome. He’s captaining a ship that absolutely should be sinking and somewhat surprisingly keeping it afloat, which Total Points gives him a ton of credit for
    Read the full article here.
    * Who’s the best cornerback in the NFL? This came up on this week’s Off the Charts Football Podcast after Derek Stingley Jr. had a particularly good game for the Texans in Week 15. Patrick Surtain II moved back into the top spot ahead of Christian Gonzalez, but it’s a tight leaderboard at the top.

    Total Points Power Rankings

    The Top 10 teams in the NFL when taking into account Total Points Per Play for offense, defense, and special teams.

    1. Lions
    2. Ravens
    3. Bills
    4. Packers
    5. Eagles
    6. Broncos
    7. Vikings
    8. Cardinals
    9. Chiefs
    10. Seahawks

    Top 5 Offenses

    1. Ravens
    2. Bills
    3. Lions
    4. Packers
    5. Bengals

    Top 5 Defenses

    1. Broncos
    2. Eagles
    3. Vikings
    4. Packers
    5. Chargers

    Total Points Leaders: Quarterbacks

    1. Joe Burrow
    2. Lamar Jackson
    3. Josh Allen
    4. Patrick Mahomes
    5. Bo Nix

    Total Points Leaders: Running Backs

    1. Jahmyr Gibbs
    2. Derrick Henry
    3. James Conner
    4. Bucky Irving
    5. Josh Jacobs

    Total Points Leaders: Wide Receivers

    1. Ja’Marr Chase
    2. A.J. Brown
    3. Jauan Jennings
    4. Puka Nacua
    5. Brian Thomas Jr.

    Total Points Leaders: Defensive Ends

    1. Myles Garrett
    2. T.J. Watt
    3. Jared Verse
    4. Jonathan Greenard
    5. Calais Campbell

    Total Points Leaders: Linebackers

    1. Brian Burns
    2. Zack Baun
    3. Nik Bonitto
    4. Fred Warner
    5. Zaire Franklin

     Total Points Leaders: Cornerbacks

    1. Pat Surtain II
    2. Christian Gonzalez
    3. Derek Stingley Jr.
    4. Keisean Nixon
    5. Jaylon Jones

     Total Points Leaders: Safeties

    1. Kerby Joseph
    2. Julian Love
    3. Amani Hooker
    4. Nick Cross
    5. DeShon Elliott


    Note: These rankings are based on unrounded totals which virtually eliminates ties between players or teams

    E-mail mark@ww2.sportsinfosolutions.com for a free one-week subscription to our DataHub Pro, which allows you access to a wealth of information about NFL team and player performance.

    Charting Leaderboards

    Leaderboards in various statistical categories based on video review by our staff, including long passes, yards after contact, and pressures.


    Leaderboards in various statistical categories based on video review by our staff, including long passes, yards after contact, and pressures.

    * The NFL’s most successful deep passer this season has been Sam Darnold. But the best deep passer has arguably been Justin Herbert. Herbert leads all quarterbacks with a 66% on-target percentage on passes at least 20 yards downfield. Darnold ranks just a little behind at 60%. That Darnold has 27 deep pass completions to Herbert’s 22 is a testament to the quality of Darnold’s receivers.
    * Shout-out to Osa Odighizuwa, who leads the NFL in pressures above expectation (+20.2). Odighizuwa had 7 pressures last week in the Cowboys’ win over the Panthers. He ranks tied for 13th with 50 pressures this season.
     

    Most Completions, Pass Attempts 20+ Yards Downfield

    1. Sam Darnold 27
    2. Jordan Love 23
    3. Josh Allen, Justin Herbert, Geno Smith 22

    Most Receptions, Targets 20+ Yards Downfield

    1. George Pickens 13
    2. Darnell Mooney, Justin Jefferson 12
    4. DK Metcalf 11
    5. Jordan Addison, Courtland Sutton, Alec Pierce 10

    Most Yards After Contact (Rushing)

    1. Saquon Barkley 852
    2. Derrick Henry 824
    3. Josh Jacobs 797
    4. Kyren Williams 739
    5. Bijan Robinson 727

    Most QB Pressures

    1. Maxx Crosby 68
    2. Trey Hendrickson 66
    3. Jared Verse, Will McDonald IV 59
    5. Myles Garrett 57

    Most Pressures Above Expectation

    1. Osa Odighizuwa 20.2
    2. Myles Garrett 16.6
    3. Micah Parsons 16.3
    4. Maxx Crosby 15.7
    5. Chris Jones 15.4

    Click here for our full Charting StatPack featuring deeper lists on these stats.

    E-mail mark@ww2.sportsinfosolutions.com for a free one-week subscription to our DataHub Pro, which allows you access to a wealth of information about NFL team and player performance.

    Matchups and Mismatches

    When we look at matchups by unit and compare the teams playing a particular game, there are intriguing matchups and mismatches each week.

    Find your own matchups and mismatches here. You can also find much of this information at the SIS DataHub Pro.

    Here are some we noticed:

    (All references to rankings are in the context of Total Points Per Play)

    * Two teams to watch that have top-end Pass Rush and Pass Coverage groups: the Texans (ranked 6th and 5th, respectively) against the Chiefs and (maybe) a hobbled Patrick Mahomes, and the Vikings (ranked 7th in both areas) against also-potentially hobbled Geno Smith and the Seahawks, whose Blocking ranks last in the NFL.

    * There’s one team that ranks in the top 10 in six of the seven groupings we measure (Passing, Rushing, Receiving, Blocking, Run Defense, Pass Rush, Pass Coverage).

    It’s not the Bills and not the Eagles. It’s actually the Packers, who face the Saints on Monday Night Football. The Saints rank in the bottom half of the NFL in four of those groupings, so Green Bay has a significant advantage.

  • Should Bo Nix be in the Rookie of the Year conversation?

    Should Bo Nix be in the Rookie of the Year conversation?

    The takes fly fast when it comes to young quarterbacks, because the draft cost is so high and the value proposition of a rookie-deal stud is so enticing (not to mention fans of the teams have seen some rough football and want to hope for better). Jayden Daniels came out to such a great start and stood out so starkly from his peers in the first month-plus of the 2024 season that there really wasn’t a Rookie of the Year argument.

    But with Daniels playing through injury and the Commanders fading to some extent over the second half of the year, there has been at least a little daylight for someone else to stake a claim over the final few weeks of the season.

    If Sports Info Solutions’ Total Points system is to be believed, Bo Nix should be in the conversation. And I think his statistical profile offers a pretty interesting case study for the kind of evaluation Total Points does.

    Here’s the current leaderboard among rookie quarterbacks.

     (Note that the Total here can include some other categories beyond the sum of Passing and Rushing.)

    Passing Rushing Total
    Bo Nix 80 13 94
    Jayden Daniels 66 25 91
    Caleb Williams 33 17 51
    Drake Maye 31 16 47

    If you were to consult other analytics-based measures of quarterback play, like ESPN’s Total QBR or rbsdm.com’s EPA+CPOE composite, Daniels sits as a top five-ish quarterback and Nix is somewhere in the middle of the pack. And I think that probably sits well with most film evaluators too. So what’s going on with our measure of what Nix has done?

    The baseline stats

    For those who haven’t followed Nix’s season, it’s useful to set a baseline. Here are his ranks among the 42 quarterbacks with at least 100 attempts in a handful of different categories. They tell a pretty consistent story.

    Completion Percentage 29th
    Catchable Percentage 30th
    On-Target Percentage 26th
    Adjusted Net Yards per Attempt 24th
    Independent Quarterback Rating* 23rd
    Passing EPA 32nd
    Passing Success Rate 31st

    * Independent Quarterback Rating is SIS’s adjustment to the Passer Rating formula that isolates competitive throws and factors within the passer’s control, ignoring things like drops and throwaways.

    The overall production as a passer has been below average, although if we started counting a bit after the start of the season we’d be more charitable. The first few weeks of the Nix era were extremely concerning, punctuated by a 60-passing-yard showing against the Jets in Week 4. Since then his ranks are more in the 15-20 range across the board. And that includes a pretty horrible effort in Week 15 against the Colts, which Total Points puts right up next to that Jets game.

    He has added some value with his legs, with the 6th-most carries by a quarterback this season. He was on quite a run (pun intended) in Weeks 6-7 against the Chargers and Saints, combining for 16 carries for 136 yards and 9 first downs. Those carries haven’t been super-valuable on average, though, as he’s only 15th in rushing EPA among quarterbacks.

    So if Nix has had generally poor overall production and doesn’t have a secret stash of rushing value, where is Total Points finding the value?

    Total Points and team context

    The Total Points system takes what each player does on the field from a charting data perspective and credits or debits them accordingly. Because of that, there are plenty of opportunities for a player to be evaluated positively on a negative play or vice versa.

    In Nix’s case, there are a lot of plays where he does alright and something goes horribly wrong, or the play should have gone horribly wrong and he escapes with a kinda-bad outcome. He’s captaining a ship that absolutely should be sinking and somewhat surprisingly keeping it afloat, which Total Points gives him a ton of credit for. As for whether it’s too much credit…let’s dig deeper.

    Sacks—and what you replace them with—are a quarterback stat

    It’s well established at this point that pressure, especially sacks, is largely driven by the quarterback’s tendencies. Nix seems to do a great job of avoiding them, and he’s had a decent amount of practice, if you’ve seen highlights of him running around in the backfield.

    Nix has the 5th-lowest sack rate in the NFL this year, which is great. The guy with the lowest rate in the league is the likely NFL MVP (Josh Allen), and the players at the other end of the list are generally not the names you want to be around. And this isn’t a scheme-driven thing either, as you might expect from players like Tua Tagovailoa. Nix is 26th in 1-and-3-step dropbacks and 12th in 5-and-7-step dropbacks, if you count being in shotgun as counting for a couple extra steps. 

    Sacks are very bad, so Total Points wants to give a lot of credit for avoiding them. The average high-volume quarterback has lost about 40 points of value on sacks this year, while Nix is right around 25. (For what it’s worth, Daniels is right in that median range, so the sack value basically covers Nix’s advantage in Total Points.)

    When he avoids a sack, though, Nix often kinda chucks it up, generally in a throwaway-type effort, which is evidenced by his league-low on-target rate on pressured throws at least 10 yards downfield.

    From a Total Points perspective, getting a catchable throw out there on such a play is a pretty big deal, because you’re at least presenting the possibility of a positive play in a spot where the expectation is pretty solidly negative. Nix doesn’t do a great job of doing any more than that, but the system gives him credit for pushing for more than a checkdown first, and then adjusts based on the accuracy. I don’t have evidence right now to suggest that the initial throw value is out of whack, but it’s worth digging into in the offseason.

    Receiving…talent?

    The Broncos are basically a Courtland Sutton operation on the outside. He has more than double the receiving production of anyone else on the team, and non-degenerates probably haven’t heard of anyone else. 

    Here’s what Nix has dealt with this year:

    • 6th-worst On-Target Catch Rate
    • 9th-worst Broken+Missed Tackles per Reception
    • 4 lost fumbles on completions (tied for the NFL lead)

    Only the Colts have bottom-10 rates in the first two metrics, and they can’t compete on the fumble front. As a result, the Broncos are sitting on the worst receiving corps in the NFL by Total Points. They’ve been worth about 3 points per game below average over the course of the whole season.

    Nix has not set the world on fire with his accuracy as Sean Payton suggested he might, but he’s done plenty to get this offense in position to succeed, and in large part his teammates haven’t held up their end of the bargain. 

    Where we stand

    I am not trying to sell anyone on “Bo Nix, top 5 quarterback” as the Total Points leaderboard would suggest, but I do think that he’s doing some important things well and working through a pretty difficult team situation, and his overall performance has been way better than the gap in Offensive Rookie of the Year odds would suggest. 

    His improvement after the first month of the season has been encouraging, although it’s reasonable not to have too much patience with a 24-year-old rookie. But I’ll be keeping an eye on potential skill position improvements in the offseason that might buoy a signal caller who has shown signs of being a capable starting quarterback.

  • 2024 SIS College Football All-American Team

    2024 SIS College Football All-American Team

    Photos: Jeffrey Brown and Scott Winters/Icon Sportswire

    It’s time once again to announce our SIS College Football All-American Team. We used our all-encompassing player value stat, Total Points, along with other metrics and our scouting work as leading references in putting together our selections.

    A brief explanation of Total Points:

    Total Points takes nearly everything that SIS measures about a play and uses it to evaluate each player on a scale that allows you to compare them more easily. It’s always useful to be able to understand the different ways in which players can be valuable. Does he break a lot of tackles? Does he get a lot of yards after the catch? Does he make the best out of a poor offensive line? Does he get more pressures than expected? Does he break up a lot of passes? Total Points offers the opportunity to take all of those elements and get a quick picture of how well a player is performing overall.

    You can learn more about Total Points and the statistics referenced within this piece here.

    Here are this year’s selections:

    1st Team Offense

    Position Name School
    QB Dillon Gabriel Oregon
    RB Ashton Jeanty Boise State
    RB Cam Skattebo Arizona State
    WR Travis Hunter Colorado
    WR Xavier Restrepo Miami
    WR Tetairoa McMillan Arizona
    TE Harold Fannin Jr. Bowling Green
    T Isaiah World Nevada
    T Josh Conerly Jr. Oregon
    G Keylan Rutledge Georgia Tech
    G Baraka Beckett New Mexico
    C Brady Small Army

    QB – Dillon Gabriel – Oregon

    Gabriel led all quarterbacks in Total Points and Points Above Average, passing for 3,558 yards and 28 touchdowns. Accuracy is his calling card. Gabriel finished Top 5 among quarterbacks in completion percentage, catchable pass percentage, and on-target percentage.

    RB – Ashton Jeanty – Boise State 

    Jeanty led all running backs in Total Points and Points Above Average, thanks to his 2,497 rushing yards and 29 touchdowns. His 1,665 yards after contact was more than the next best running back had in yards alone.

    RB – Cam Skattebo – Arizona State

    Skattebo led all running backs in Total Points Per Play, while gaining 2,074 yards from scrimmage and scoring 22 total touchdowns. A total of 1,024 of his 1,568 rushing yards came after contact, and he forced a broken and/or missed tackle on 30.7% of his attempts (7th-best, minimum 150 carries).

    WR – Xavier Restrepo – Miami 

    Restrepo had a dominant final season in college, leading all wide receivers in Total Points and Points Above Average. The sure-handed receiver was one of two Power-4 wide receivers to eclipse 1,000 receiving yards and 10 receiving touchdowns. 

    WR – Tetairoa McMillan – Arizona

    McMillan solidified himself as one of the most dominant receivers in the sport as a true junior. In addition to being Top 5 in Receiving Total Points, he posted the second-most air yards this season (881), while also being in the Top 5 in broken and missed forced tackles among receivers with 27.

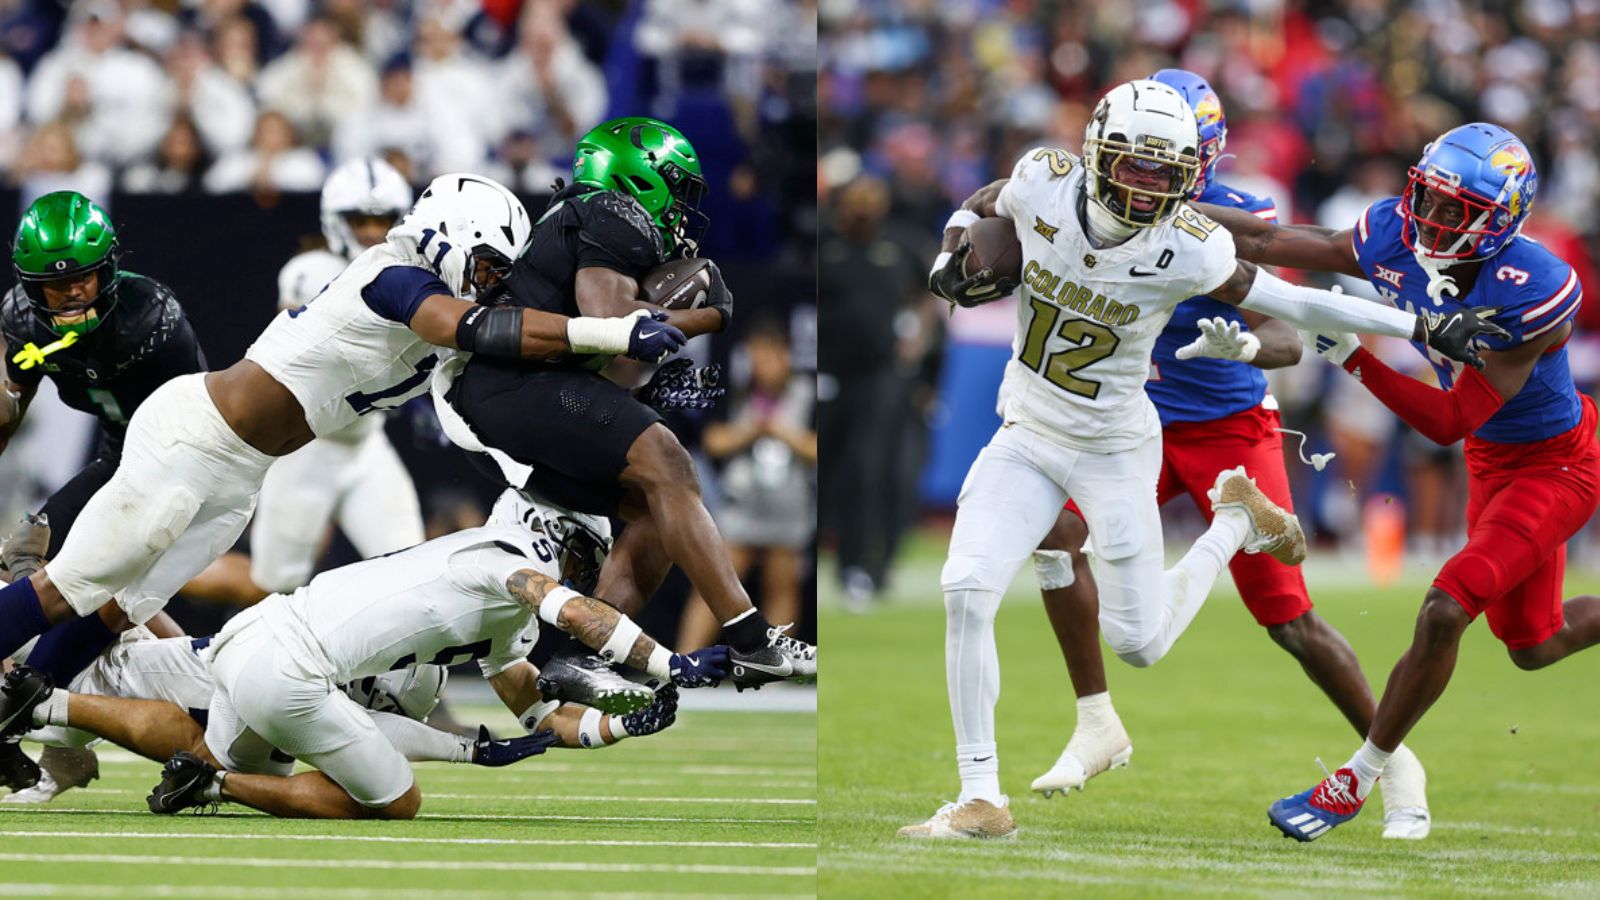
    WR – Travis Hunter – Colorado

    Hunter was so good that we added an extra spot on both the 1st Team Offense AND 1st Team Defense so he could get his due. He finished the season Top 10 in Total Points among non-quarterbacks. The 2024 Biletnikoff Award winner finished 2nd in the FBS with 14 receiving touchdowns.

    TE – Harold Fannin Jr. – Bowling Green 

    Fannin Jr. led all Tight Ends in Total Points and Points Above Average, hauling in 1,332 receiving yards and 10 touchdowns. Perhaps his most impressive stat was that despite 133 targets this season, he dropped only 1 pass.

    T – Isaiah World – Nevada

    World’s all-around, stellar play earned him a spot on the 1st team. He finished 7th in the FBS in Run Block Total Points among tackles and tied for 1st in Total Points among all FBS offensive linemen this year. 

    T – Josh Conerly Jr. – Oregon 

    Conerly Jr. had a dominant season en route to Oregon’s undefeated regular season. He finished 3rd among all offensive linemen in Total Points and Points Above Average. He was very well balanced as he was the only tackle in the FBS to finish in the Top 10 of both Pass Block Total Points and Run Block Total Points.

    G – Keylan Rutledge – Georgia Tech

    Rutledge finished Top 10 in Total Points among offensive linemen, particularly shining in run blocking where he finished Top 5 in Run Blocking Total Points. His pass blocking accomplishments were also impressive, as with roughly 400 pass block attempts, he gave up only 2 blown blocks.

    G – Baraka Beckett – New Mexico

    Beckett was one of three Lobos to rank within the top-20 interior linemen in terms of Total Points, alongside teammates Richard Pearce and Lajuan Owens. The seventh-year senior played a key role in New Mexico’s offense, which had the highest yards per rush in the country (6.7).

    C – Brady Small – Army 

    Small was the middle man on the dominant, Joe Moore Award-winning, Army offensive line this season. He led all centers in Total Points, and made a statement in the run game by leading all offensive linemen in Run Blocking Total Points.

    1st Team Defense

    Position Name School
    DT Mason Graham Michigan
    DT TJ Sanders South Carolina
    EDGE Donovan Ezeiruaku Boston College
    EDGE Abdul Carter Penn State
    LB Shaun Dolac Buffalo
    LB Jackson Woodard UNLV
    LB Carson Schwesinger UCLA
    CB Nohl Williams California
    CB Jahdae Barron Texas
    CB Travis Hunter Colorado
    S Nick Emmanwori South Carolina
    S Xavier Watts Notre Dame

    DT – Mason Graham – Michigan 

    Graham capped off a highly-decorated career by leading all defensive tackles in Total Points and Points Above Average. He was a force against the run and the pass, leading all defensive tackles in Run Defense Total Points and finishing 7th in Pass Rush Total Points. 

    DT – TJ Sanders – South Carolina  

    Sanders was nearly unblockable for the Gamecocks this past season. He finished Top 10 among all defensive tackles in Pass Defense Total Points Per Play, Run Defense Total Points, Run Defense Total Points Per Play, and ended up with 41 Total Points, which ranked 2nd among all players at his position.

    ED – Donovan Ezeiruaku – Boston College

    Ezeiruaku was a dominant force as a pass rusher where he led all Edges in Total Points and pressures generated. He also ended the season 3rd in sacks with 15.5. Not only was he one of the dominant forces as a pass rusher, but he was just as dominant in the run game where he led all Edges in Total Points against the run, tackles per game, and tackles for loss.

    ED – Abdul Carter – Penn State

    Carter finished 5th in Pass Defense Total Points and 7th in Run Defense Total Points, proving his dynamic ability that made him a top-3 edge defender in the nation with 61 Total Points. His Big 10-leading 19.5 tackles for loss, coupled with his double digit sack total, has put him into the national spotlight as a premier rusher in this upcoming draft. 

    LB – Shaun Dolac – Buffalo

    Dolac led all linebackers this season with 88 Total Points. He was impactful against the run and pass game, having the most Pass Defense Total Points among linebackers as well as the 2nd-most Run Defense Total Points.

    LB – Jackson Woodard – UNLV

    Woodard was everywhere this season for the Rebels defense. He was Top 5 in Total Points, Total Points per Play, tackles, and tackles for loss among defenders on run defense. He also contributed 6 turnovers forced (4 INTs and 2 forced fumbles) and 3.5 sacks.

    LB – Carson Schwesinger – UCLA 

    Schwesinger led all linebackers in Run Defense Total Points after finishing the season as the leading tackler among all Power-4 linebackers with 134. His 2.9% broken and missed tackle percentage led the nation. He ranked 6th in Pass Defense Total Points as he also picked off 2 passes this year. 

    CB – Nohl Williams – California

    Williams led the NCAA with 7 interceptions, 2 of which he returned for touchdowns. He has also played the most coverage snaps (494) and allowed only a 41.6 QB Rating and 42.6% completion percentage when targeted. He led all FBS cornerbacks in Total Points.

    CB – Jahdae Barron – Texas

    Barron put together an excellent season out on the boundary for the Longhorns. He finished 3rd in Total Points among all cornerbacks while posting a 25.7 QB Rating Against, a 37.1% completion percentage against and only 10 yards allowed per game. He also had 5 interceptions.

    CB – Travis Hunter – Colorado

    Hunter was so good that we added an extra spot on both the 1st Team Offense AND 1st Team Defense so he could get his due. He finished the season Top 10 in Total Points among non-quarterbacks. The 2024 Bednarik Award winner led all FBS cornerbacks in Total Points.

    S – Nick Emmanwori – South Carolina 

    Emmanwori was a force in the secondary for the Gamecocks this season. He led all safeties in Total Points and Points Above Average. He finished 9th with a 27.8 QB Rating Against when targeted.

    S – Xavier Watts – Notre Dame

    Watts ranks 2nd in Total Points for safeties and followed up his 7-interception campaign in 2023 with 5 more picks in 2024. Notre Dame is the only team in the NCAA to allow a completion percentage under 50%, with Watts leading the charge.

    1st Team Specialists

    Position Name School
    K Kenneth Almendares Louisiana
    P Alex Mastromanno Florida State
    Returner Kaden Wetjen Iowa

    K – Kenneth Almendares – Louisiana

    Almendares was Mr. Reliable for the Ragin’ Cajuns this season. He made 27 of his 29 field goal attempts with his only two misses coming from beyond 50 yards. He also made 46 of 47 PAT attempts. It should come as no surprise that these accomplishments contributed to Almendares finishing first among all FBS kickers in Total Points. 

    P – Alex Mastromanno – Florida State

    Mastromanno led the nation with 49.3 yards per punt, making him the top punter with 24 Total Points. His accuracy was key as he placed 17 punts inside the 20 with only 2 touchbacks all season.

    RET – Kaden Wetjen – Iowa 

    Wetjen was the dominant returner on both punts and kicks this season as he posted 937 total return yards on the season. He was also one of only two players to have multiple punt return touchdowns.

    2nd Team Offense

    Position Name School
    QB Cam Ward Miami
    RB Corey Kiner Cincinnati
    RB Ahmad Hardy UL-Monroe
    WR Jack Bech TCU
    WR Andrew Armstrong Arkansas
    TE Tyler Warren Penn State
    T Paul Rubelt UCF
    T Lucas Scott Army
    G Adrian Medley UCF
    G Michael Ford Jr. Kansas
    C Mike Katic Indiana

    QB – Cam Ward – Miami 

    Ward excelled this season after transferring to Miami, finishing 3rd in Total Points among quarterbacks. He was the only quarterback to throw for at least 4,000 yards and 30 touchdowns this season despite being outside of the Top 10 in the total number of dropbacks. 

    RB – Corey Kiner – Cincinnati

    Kiner finished 3rd this year in Rushing Total Points this year behind Heisman contenders Ashton Jeanty and Cam Skattebo. He was top-3 in broken tackles forced this season with 46, and he also placed Top 5 in broken and missed tackles forced per attempt (minimum 150 attempts).

    RB – Ahmad Hardy – UL-Monroe

    Hardy burst onto the scene as a true freshman to finish the season 4th among FBS running backs in Total Points. He didn’t need to rely on volume either as he was also 3rd in Total Points Per Play.

    WR – Jack Bech – TCU

    Bech finished 4th in Receiving Total Points and was 2nd in EPA generated when targeted. Relative to his peers in the Top 10 for Receiving Total Points, Bech had the lowest Bust Percentage at 4.3% (that stat is explained further here).

    WR – Andrew Armstrong – Arkansas

    Armstrong, who finished 3rd in Receiving Total Points, was everything to the Arkansas passing game. His 1,140 receiving yards were 35% of the Arkansas receiving yardage total this season, and his 78 receptions were 32% of the team’s receptions.  

    TE – Tyler Warren – Penn State 

    Warren was truly a swiss army knife for Penn State, taking snaps all over the field, including at center. His 88 receptions for 1,062 yards, 191 rushing yards and 11 total touchdowns were a major reason for his 35 Total Points, good for 4th among FBS tight ends.

    T – Paul Rubelt – UCF  

    Rubelt finished the season tied for the lead in Total Points among FBS tackles due to his dominance in the run game. He was the only tackle to finish inside the Top 5 in Run Block Total Points that did not play for a service academy. 

    T – Lucas Scott – Army

    Scott led the AAC in Total Points for tackles, and was also the leading run blocker in the FBS. The senior helped Army average nearly 300 rushing yards per game. He had only 3 total blown blocks in 718 snaps.

    G – Adrian Medley – UCF

    Medley was a prominent piece on UCF’s offensive line this year. He led all FBS guards in Total Point and finished 2nd in Total Points Above Average. The powerhouse finished 4th among all FBS guards in Run Blocking Total Points.

    G – Michael Ford Jr. – Kansas

    Ford was a consistent presence for Kansas this year. He finished Top 10 among FBS guards in Total Points and Total Points Per Play. His 0.8% Blown Block Rate was also 2nd among Big 12 offensive linemen (minimum 400 snaps).

    C – Mike Katic – Indiana

    Katic was a stalwart on the interior of the Indiana offensive line that led the way to the team’s best season in school history. The sixth-year senior excelled specifically as a pass blocker and earned 35 Total Points, which tied for 2nd among all FBS centers this season. 

    2nd Team Defense

    Position Name School
    DT Walter Nolen Ole Miss
    DT Ty Robinson Nebraska
    EDGE T.J. Parker Clemson
    EDGE Mike Green Marshall
    LB Jay Higgins Iowa
    LB Whit Weeks LSU
    CB Ethan Robinson Minnesota
    CB D’Angelo Ponds Indiana
    S Jaylen Reed Penn State
    S Malaki Starks Georgia
    S Kerry Brown Minnesota

    DT – Walter Nolen – Ole Miss

    Nolen had a fantastic season in the middle of the Rebels’ defensive line this year. He was especially stout against the run, where he finished 4th among all defensive tackles in Run Defense Total Points and third in the FBS in Total Points (39) at his position. 

    DT – Ty Robinson – Nebraska

    Robinson was outstanding for the Cornhuskers, landing him 4th in Pass Defense Total Points among defensive tackles. His 6 sacks and 11 tackles for loss makes him an all-around force along the defensive line, which allowed him to finish tied for 3rd in Total Points.

    ED – T.J. Parker – Clemson 

    Parker put together a great season out on the edge of Clemson’s defensive front. He finished 4th in Total Points among all edge rushers where he accumulated 12 sacks and tied for the most forced fumbles in all FBS with 5, while also recovering 2. 

    ED – Mike Green – Marshall

    Green burst onto the scene this year by leading the country in sacks this year with 17. He had the most Pass Rush Total Points of all qualifiers and was top-3 in Pass Rush Total Points Per Play. He also placed Top 5 in pressures with 54.

    LB – Jay Higgins – Iowa

    Higgins did his best work against the pass this season while leading the always stingy Hawkeye defense to another solid year. Among FBS linebackers, he finished 2nd in Pass Coverage Total Points, 3rd in overall Pass Defense Total Points, and 6th in Pass Rush Total Points Per Play en route to amassing the 4th-most Total Points at his position. 

    LB – Whit Weeks – LSU 

    Weeks put together an outstanding sophomore season in the Tigers defense where he finished 5th in Total Points and 4th in Pass Rush Total Points among all linebackers. He also finished in the Top 10 for all linebackers in tackles per game with 9.6.

    CB – Ethan Robinson – Minnesota

    Robinson flew under the radar for an impressive Minnesota defense. He finished 3rd among FBS cornerbacks in Total Points. His balance was also impressive as he was the only FBS cornerback to earn at least 30 Pass Defense Total Points and 20 Run Defense Total Points.

    CB – D’Angelo Ponds – Indiana

    Ponds was a big part of Indiana’s unexpected run this season. He was Top 5 in Total Points and was ranked 5th in Pass Defense Total Points out of all defenders in the country. Among players targeted at least 30 times, Ponds ranked in the Top 25 in yards allowed with 166.

    S – Jaylen Reed – Penn State

    Reed performed well against both the run and pass, finishing in the top-25 on both fronts (24th and 13th, respectively). He was all over the field for the Nittany Lions, as he accumulated 79 tackles, one forced fumble and three interceptions, even taking one back to the house. He finished the season in the Top 5 among all safeties in Total Points, with 54. 

    S – Malaki Starks – Georgia

    Starks has been a chess piece for Georgia’s defense, moving all over the field. He was Top 5 in Total Points among safeties and ranked 8th in Pass Defense Total Points. He was a sure tackler too, ranking 2nd among safeties in one of our key stats, Broken and Missed tackle percentage per run defense snap.

    S – Kerry Brown – Minnesota

    Brown was half of the dynamic freshman safety pairing for Minnesota. He led all FBS safeties in Total Points Per Play. Similar to his teammate, he was also remarkably balanced, finishing 5th in Pass Defense Total Points Per Play and 1st in Run Defense Total Points Per Play.

    2nd Team Specialists

    Position Name School
    K Peyton Woodring Georgia
    P Eddie Czaplicki USC
    Returner Jalen Moss Fresno State

    K – Peyton Woodring – Georgia

    Woodring, on the heels of a Lou Groza award semifinalist freshman season, connected on 91% of his kicks in the 2024 season. His only two misses on the season came on attempts of at least 50 yards.

    P – Eddie Czaplicki – USC

    Czaplicki won the Ray Guy Award due to his excellent punting prowess this season. Not only was his 48.5-yard Punt Average impressive, but his accuracy was outstanding. He had 24 punts inside the 20 with only a single touchback all season.

    RET – Jalen Moss – Fresno State 

    Moss, despite an injury-shortened season, finished in the Top-15 for Punt Return Yards highlighted by an 85 yard TD. He was also one of only four players in the FBS with at least 15 kickoff returns and 15 punt returns.

  • NFL Advanced Statistical Leaders Entering Week 15

    NFL Advanced Statistical Leaders Entering Week 15

    Photo: David Rosenblum/Icon Sportswire

    Hi!

    Welcome to this week’s edition of the SIS StatPack, our weekly look at leaderboards for Total Points and some of our charting stats.

    You can e-mail mark@ww2.sportsinfosolutions.com for a free one-week subscription to our DataHub Pro, which allows you access to a wealth of information about NFL team and player performance.

    Total Points Leaderboards

    Highlights from the leaderboards in our flagship stat, Total Points, which attempts to measure everything that happens on the field (full primer here):

    * The teams with the top four offenses in Total Points Per Play rank within the top four teams overall (Ravens, Bills, Lions, Packers). The teams with the top four defenses in Total Points per play rank 5th, 10th, 11th, and 7th overall (Broncos, Chargers, Steelers, Eagles).

    * There is considerable parity among the top NFL defenses.

    The No. 1 defense (Broncos) and No. 10 defense (Packers) are separated by 2 Total Points Per Play.

    The No. 1 offense (Ravens) and No. 10 offense (Chiefs) are separated by 9 Total Points Per Play.

    Derek Carr took advantage of matchups against the Panthers and Cowboys and locked in his per-play production to move up the Total Points ranks. Carr ranks 8th among quarterbacks in Total Points this season and 4th at the position in Total Points Per Play.

    Christian Gonzalez might seem like an odd name atop the list of top cornerbacks in Total Points given where the Patriots rank in Pass Defense. But he’s proven his worth as a 2023 1st-round pick. Gonzalez ranks 8th at the position in Pass Defense Points Saved but where he makes up for that is in Run Defense Points Saved, where he ranks 2nd.

    Click here for the full Total Points StatPack

    Total Points Power Rankings

    The Top 10 teams in the NFL when taking into account Total Points Per Play for offense, defense, and special teams.

    1. Lions
      2. Bills
      3. Ravens
      4. Packers
      5. Broncos
      6. Seahawks
      7. Eagles
      8. Vikings
      9. 49ers
      10. Chargers

    Top 5 Offenses

    1. Ravens
      2. Bills
      3. Lions
      4. Packers
      5. Bengals

    Top 5 Defenses

    1. Broncos
      2. Chargers
      3. Steelers
      4. Eagles
      5. Vikings

    Total Points Leaders: Quarterbacks

    1. Joe Burrow
      2. Lamar Jackson
      3. Patrick Mahomes
      4. Josh Allen
      5. Bo Nix

    Total Points Leaders: Running Backs

    1. Derrick Henry
      2. Josh Jacobs
      3. Jahmyr Gibbs
      4. Najee Harris
      5. Bucky Irving

    Total Points Leaders: Wide Receivers

    1. Ja’Marr Chase
      2. Jauan Jennings
      3. A.J. Brown
      4. Justin Jefferson
      5. Puka Nacua

    Total Points Leaders: Defensive Ends

    1. Jared Verse
      2. Jonathan Greenard
      3. Myles Garrett
      4. T.J. Watt
      5. Greg Rousseau

    Total Points Leaders: Linebackers

    1. Zack Baun
      2. Brian Burns
      3. Andrew Van Ginkel
      4. Bobby Wagner
      5. Fred Warner

    Total Points Leaders: Cornerbacks

    1. Christian Gonzalez
      2. Pat Surtain II
      3. Keisean Nixon
      4. Kamari Lassiter
      5. Jaylon Jones

    Total Points Leaders: Safeties

    1. Kerby Joseph
      2. Amani Hooker
      3. DeShon Elliott
      4. Julian Love
      5. Taylor Rapp

    Note: These rankings are based on unrounded totals which virtually eliminates ties between players or teams

    Click here for the full Total Points StatPack, which features deeper lists and more stats.

    Charting Leaderboards

    Leaderboards in various statistical categories based on video review by our staff, including long passes, yards after contact, and pressures.

    E-mail mark@ww2.sportsinfosolutions.com for a free one-week subscription to our DataHub Pro, which allows you access to a wealth of information about NFL team and player performance.

    Click here for our full Charting StatPack

    Leaderboards in various statistical categories based on video review by our staff, including long passes, yards after contact, and pressures.

    Saquon Barkley, Derrick Henry, and Josh Jacobs rank 1-2-3 in rushing yards after contact this season. Henry and Jacobs are 1-2 in Total Points among running backs with Barkley 10th.

    Why does Barkley rank so low? James Weaver explained in an article on our website this week.

    “Part of this low total can be attributed to his low broken and missed tackle rate which sits at only 10%, the 5th-lowest among RB’s with 100 carries. The other factor contributing is how good his offensive line is. The Eagles O-line has accumulated the most run blocking Total Points and has the 3rd-lowest blown block percentage on run plays.”

    Most Completions, Pass Attempts 20+ Yards Downfield

    1. Sam Darnold 27
      2. Justin Herbert 21
      3. Geno Smith, Jordan Love, Bo Nix 20 

    Most Receptions, Targets 20+ Yards Downfield

    1. George Pickens 13
      2. Justin Jefferson, Darnell Mooney 12
      4. DK Metcalf 11
      5. Alec Pierce, Jordan Addison 10

    Most Yards After Contact (Rushing)

    1. Saquon Barkley 799
      2. Derrick Henry 770
      3. Josh Jacobs 717
      4. Kyren Williams 666
      5. Bijan Robinson 658

    Most QB Pressures

    1. Maxx Crosby 68
      2. Trey Hendrickson 64
      3. Jared Verse 55
      4. Will McDonald IV 54
      5. Brian Burns 51

    Most Pressures Above Expectation

    1. Trey Hendrickson 16.6
      2. Maxx Crosby 15.7
      3. Osa Odighizuwa 15.4
      4. Micah Parsons 13.2
      5. Chris Jones 13.2

    Click here for our full Charting StatPack featuring deeper lists on these stats.

    E-mail mark@ww2.sportsinfosolutions.com for a free one-week subscription to our DataHub Pro, which allows you access to a wealth of information about NFL team and player performance.

    Matchups and Mismatches

    When we look at matchups by unit and compare the teams playing a particular game, there are intriguing matchups and mismatches each week.

    Find your own matchups and mismatches here. You can also find much of this information at the SIS DataHub.

    Here are some we noticed:

    (All references to rankings are in the context of Total Points Per Play)

    * Good matchups abound in Eagles vs Steelers (aka Wawa vs Sheetz). The Steelers have the 3rd-ranked Rush Defense to try to stop Saquon Barkley and the No. 1 pass rush to thwart Jalen Hurts. But they’ll be going against a No. 1 Eagles Blocking unit (for more on this game … and Wawa vs Sheetz, check out The SIS Off The Charts Football Podcast)

    * The Lions have some defense vulnerabilities heading into their game against the Bills. They rank 18th in Run Defense and 16th in Pass Rush. The Bills rank 6th or better in Passing, Rushing, Receiving, and Blocking.

    And check out our new account on Bluesky, where we go beyond what’s in the StatPack to bring you even more football insights.

    For example, this week we put the spotlight on an area where the Lions have a big edge against the Bills.

    Something to watch this weekend: Lions have a huge edge on the Bills specifically when they pass out of 11 personnel Lions rank 2nd in success rate on those plays Bills rank 28th in defending against it

  • We’ve Seen This Before From Kliff Kingsbury

    We’ve Seen This Before From Kliff Kingsbury

    Photo: Andy Lewis, Kevin Abele/Icon Sportswire

    With the constant influx of athletic quarterbacks into the NFL, offensive coaches have slowly incorporated more QB designed runs into their schemes. We’ve seen these concepts plenty in college football with the likes of Urban Meyer, Chip Kelly, and Rich Rodriguez starting the revolution of the spread option offense. 

    It is fitting that Kliff Kingsbury, who spent time in college before coaching the Cardinals and Commanders, has created an offensive scheme that utilizes plenty of Air Raid and Spread Option principles. It’s also fitting that Kingsbury has been tasked with developing two Heisman winning quarterbacks who possess the athleticism to be a successful rusher in the NFL, but who have had to manage in-season injuries that limit how much they can use that athleticism.

    In this article, we are going to look at how Kingsbury has utilized the running ability of Jayden Daniels and Kyler Murray before and after lingering in-season injuries. 

    Daniels and the Commanders offense were off to a roaring start before Daniels suffered a rib injury in Week 7 against the Panthers that forced him to leave the game. The Commanders were 5-2 and ended that game having scored 30 points or more in four of five games. Since Week 8, the Commanders are 3-3 and have scored 30 points just once, in their Week 13 game against the Titans.

    The table below shows team rushing stats for the Commanders before and after Daniels suffered his rib injury: 

    Pre-Rib Injury Post-Rib Injury
    Rush Attempts / Game 32 32
    Rush Yards / Game 165 147
    EPA/Rush 0.16 0.06
    Total Points / Rush 0.19 0.05

    The Commanders rushing offense has been less effective since Daniels was injured. Although the EPA per Rush has decreased by a tenth of a point since the injury, the Commanders have still been successful running the football compared to the rest of the league. From Week 8 on, the Commanders are tied for third with the Giants in EPA per Rush. 

    However, there is more to this story. The table below shows rushing stats for Jayden Daniels on designed QB runs. For the purpose of this article, we are not going to include QB sneaks and kneels. 

    Pre-Rib Injury Post-Rib Injury
    Designed Runs / Game 4.2 2.8
    Rush Yards / Game 18 14
    EPA/Rush 0.16 0.02
    Total Points / Rush 0.22 0.03

    The Commanders have run Daniels less frequently since the injury. His effectiveness has also dropped off. Now, when we look at his rushing stats in the Red Zone only, a clearer picture starts to emerge:

    Pre-Rib Injury Post-Rib Injury
    Designed Runs 13 5
    Touchdowns 4 1
    EPA/Rush 0.15 -0.07
    Total Points / Rush 0.29 -0.27

    This paints a clear picture of where the Daniels injury has impacted the Commanders rushing offense the most: in the red zone. His ability to run the Read Option in the red zone puts a lot of pressure on the defense. Kingsbury is running his quarterback less in general, but especially in key situations in tight quarters, and he’s done worse with those attempts (albeit in a small sample). 

    Defenses can pick up on this trend, as well. To make a baseball analogy, using the quarterback in the option run game is like having a great changeup to complement your fastball. It is pretty much impossible to sit on a great fastball and changeup, similar to defending the option in football. If you can eliminate one of the options pre-snap or pre-pitch, you have a much greater chance of success. This is where Kingsbury has run into problems during his tenure as a playcaller not only in Washington, but Arizona as well. 

    Kingsbury has caught a lot of flak for his offenses struggling in the second half of the season since his days in Arizona with Kyler Murray. There does appear to be some truth to that logic, although he has had unfortunate injury luck at quarterback dating back to the 2020 season.

    The 2020 Cardinals started the season 5-3 before a Kyler Murray shoulder injury in Week 9 that lingered for the rest of the season. The 2021 Cardinals started 7-1 before Murray suffered a sprained ankle that caused him to miss 3 games and limped to the end of the season with a 11-6 record and a playoff berth. The two tables below highlight the similarities between the 2020 Cardinals and 2024 Commanders offenses pre- and post-injury for their franchise quarterback. 

    2020 Cardinals Pre-QB Injury Post-QB Injury
    Rush Attempts / Game 32 28
    Rush Yards / Game 163 117
    Rush Touchdowns / Game 1.75 1.13
    EPA/Rush 0.16 -0.04
    Total Points / Rush 0.07 -0.05

    2024 Commanders Pre-QB Injury Post-QB Injury
    Rush Attempts / Game 32 32
    Rush Yards / Game 165 147
    Rush Touchdowns / Game 2.0 1.3
    EPA/Rush 0.16 0.06
    Total Points / Rush 0.19 0.05

    The numbers are astonishingly similar, especially pre-injury for both seasons. As you can see, Kingsbury has tweaked his offense to his personnel in Washington to form one of the most potent rushing attacks in the NFL this season. 

    Kingsbury’s rushing offense has not cratered like it has in the 2020 and 2021 seasons after Murray was injured. Part of that should be attributed to personnel differences, but another part of it should be attributed to schematic changes.

    Kingsbury has adapted from a zone-run heavy run scheme in Arizona to a more balanced approach to gap and zone run schemes in 2024 with Washington. He is calling gap scheme running plays 47% of the time this year, compared to 28% and 38% in 2021 and 2022, respectively. In terms of running the ball, not much else has changed. He still runs an up-tempo, shotgun heavy offense that uses motions at a lower rate than most of the league, where his offenses have always ranked in the bottom 5 in motion percentage.  

    Some of this is unfortunate injury luck, some of this is also just the reality of consistently running your quarterback in the NFL. In 2020 Kyler Murray had 73 designed runs and in 2024 Jayden Daniels is currently at 47 with four games left to play. 

    Murray’s 68 runs are tied for 6th most for a quarterback in a season since 2020, while Daniels comes in tied for 16th. Ahead of these players on that list include the likes of Lamar Jackson, Jalen Hurts, Josh Allen, and Cam Newton. Besides Lamar, the three other quarterbacks have a much better body composition to sustain hits throughout the season compared to Murray and Daniels. Even then, there were discussions held within each franchise to lessen the workload for their franchise quarterback to make sure they were fully healthy going into the playoffs. 

    This is the conundrum that Kingsbury seems to keep getting stuck in, year in and year out. His offenses seem to peak too early in the regular season before waning off come crunch time. It could be the case of getting figured out by defensive coordinators or it could also be because of lingering injuries to his quarterbacks that affect how he calls plays. More than likely, both are true, but either way, Kingsbury needs to find an answer to this problem, especially if he is interviewing for head coaching positions in the off-season. 

    Luckily for the Commanders, the bye week came much later and that might just be a blessing in disguise. In future seasons, Kingsbury will need to find the perfect balance between keeping his quarterback fresh for the playoffs and finding success during the regular season or his offenses will continue to limp into the playoffs, literally and figuratively, alongside their quarterback.

  • Running Backs Matter … Again?

    Running Backs Matter … Again?

    Photos: Andy Lewis, Charles Brock/Icon Sportswire

    Year after year, the narrative gets louder and louder about the diminishing value of running backs in today’s NFL. This has led to diminishing contract values across the position as teams have been convinced that granting a running back a second contract with significant value is unadvisable.

    In an attempt to slay the dragon, over the offseason Derrick Henry, Saquon Barkley, Josh Jacobs, Austin Ekeler, Nick Chubb, and Christian McCaffrey met to discuss this suppressed market and potential solutions on fixing this. Not much, other than supporting one another, staying healthy, and increasing the level of play came out of the meeting, but Henry, Barkley, Jacobs, and Ekeler all signed with new teams and were looking to prove their worth elsewhere. 

    On average, running back production does drop with age. This isn’t unique to running backs, but the aging curve is most clear at that position.

    A graph showing the decline in performance of running backs as they age

    From a Total Points perspective, this drop-off is apparent at the start of a running back’s second contract. At the age 26 season, running backs start to dip below 0 in Rusher Points Above Average and never get above the mark throughout the duration of their career. And this doesn’t account at all for the attrition of players leaving the player pool, who do so generally as below-average players.

    On average, the production drops over time. This year, the problem is that we aren’t looking at average at the top of the running back totem pole.

    Barkley (27), Henry (30), and Jacobs (26) are all having career years with Barkley on pace to surpass Eric Dickerson’s rushing record (with an extra game). All three signed with new teams over the offseason and are all focal points to their new offenses, a rare occurrence for free agent running backs.

    How have these three made such a massive impact on their new teams? Let’s take a look!

    An MVP…Running Back?

    Not only has Saquon come to the Eagles and led the league in rushing thus far at 1,623 yards, but he is getting serious consideration for league MVP from the betting market. He currently sits as the second favorite behind only Josh Allen at +550 odds on FanDuel. He is also the odds-on favorite for Offensive Player of the Year at -450.

    At this rate, Barkley is on pace for 2,122 yards, which would break Dickerson’s single season rushing record*. He has the most attempts in the league with 266 and also leads the league in yards per attempt at 6.1 (minimum 100 attempts).

    In regards to Total Points, however, Saquon finds himself sitting at 14th in Rusher Points Above Average. Part of this low total can be attributed to his low broken and missed tackle rate which sits at only 10%, the 5th-lowest among RB’s with 100 carries.

    The other factor contributing is how good his offensive line is. The Eagles O-line has accumulated the most run blocking Total Points and has the 3rd-lowest blown block percentage on run plays.

    Saquon has accumulated outstanding production this season, and a lot of that has to do with the team around him. MVP will be tough with Allen playing as well as he is, but Offensive Player of the Year is well within his grasp.

    King Henry

    Somehow, someway, Derrick Henry might be having the best year of his career at age 30. He is averaging a career-best 5.9 yards per carry and is 3rd in the league in positive run percentage at 50%.

    Additionally, Henry is 1st in Rushing Total Points and has proved his individual value beyond team success. The Ravens are a top 3 team when it comes to Run Blocking Total Points as well, but Henry’s 3.2 yards after contact per attempt and 19% broken and missed tackles per attempt percentage prove that he is still one of the best running backs in the league. He has also carried the ball about twice as often into a heavy box than into a light box, which is a much higher ratio than others we’re talking about.

    He is not on pace to break Dickerson’s record like Saquon is, but he is on pace for an 1,800-yard season which would be the second-most yards gained of his career. He also leads the league with 13 rushing touchdowns and can tie his career high if he can get one per game the rest of the season.

    It is no secret what King Henry is all about, but the mystery remains how he can produce at such a high level at this stage of his career. Hopefully, cutting the signature dreads does not have any biblical effects on his powers.

    Run Pack Run!

    Josh Jacobs has come to Green Bay and provided stability and power to the Packers backfield, producing the 3rd-most rushing yards and 2nd-most Rushing Total Points so far this season. His elusiveness and power are also on display regularly, as he is in the Top 10 in yards after contact per attempt and broken and missed tackle rate.

    The offense he is working in has also contributed to his success. His offensive line has been solid, ranking in the Top 10 in Run Blocking Total Points. The passing attack is also potent enough (Top 10 in EPA) to allow for more light boxes, and the Packers have the best rushing success rate against light boxes this year.

    Jacobs will be an important piece of a potential Super Bowl push for the Packers down the stretch, ensuring balance and power from an offense that still has room to improve.

    Honorable Mentions

    Two other players worth noting:

    James Conner is still humming at age 29 for the Cardinals. He is 7th in Rushing Total Points and is 2nd among running backs with a 25% broken and missed tackle rate.

    David Montgomery, in his age 27 season, has fit into a prominent role with his second team in the Lions. “Knuckles” is tied for the 2nd-most rushing touchdowns and leads the league in positive run percentage.

    Conclusion

    The running-backs-don’t-matter crowd is really having a rough go of things in 2024. The three top rushers are all guys on their second contracts and one of them is looking to break the rushing record. There are plenty more that are making significant impacts on their respective teams as well.

    Can we expect this phenomenon to happen in future years? If there is a focal point to add a talented running back when the rest of the roster is in place, then – as proven this year – there can be success. The fight against father time is always against us, and even more so for running backs. 

    However, they are beginning to fight back.

  • Chaos Manifest: Measuring How QBs Behave as Passing Plays Break Down

    Chaos Manifest: Measuring How QBs Behave as Passing Plays Break Down

    In the past five years or so, expectation-based metrics have gained traction in the football space as a way to standardize performance across different contexts. An even more recent development is the fixation on anticipation which has largely emerged as a way to sensationalize pedestrian quarterback play under favorable conditions (Tua Tagovailoa’s quick releases come to mind). 

    Expected Snap to Throw +/- (xSTT+/-) fits neatly into this intersection, and I’d like to use it to reframe how we think about dropback outcomes.

    Some passing plays take longer to develop than others. A quick-game concept like double slants-stick develops faster than a play action shot play – at least in theory. And xSTT+/- takes factors like shotgun, drop depth and play action to roughly approximate when the ball should come out, and then compares this baseline to the actual snap to throw time on a play.

    But, once the quarterback crosses the threshold of when the ball is supposed to be thrown, negative outcomes become more likely as the play unfolds. As the structure disintegrates into good, old-fashioned, backyard football, rushers come unblocked, the pocket collapses, and receivers begin to improvise their routes. This seems fairly intuitive and is borne out in the data:

    What is more interesting is what’s occurring within these buckets on a player level. On the front end, when the play still resembles ‘how it’s drawn up,’ quarterbacks do not deviate too much from each other in terms of the rate at which they throw the ball downfield (as outlined in the graph above). Within a quarter of a second – which is a long time in the NFL – on either side of the expected snap to throw time, the middle 80 percent of players (i.e. non-outliers) only deviate from average by about five percent, give or take. 

    And this speaks to the level of automation NFL quarterbacks have trained towards: in neutral conditions, they all consistently perform the same general task (throwing the ball downfield without putting it in harm’s way).

    But, things start to get really weird at a half second beyond the expected snap to throw time. This is when the clock strikes midnight, where deviations ranging from -15% to +25% can be seen even after removing these outliers. And this is where players really begin to differentiate themselves from one another. Let us examine some of these profiles further.

    A ready-made comparison is Joe Burrow and Tua Tagovailoa, who will forever be linked to each other as the first two quarterbacks selected in the 2020 NFL Draft. These are players who throw downfield at pretty similar rates, until the tipping point of 0.5 xSTT+/- is reached:

    Burrow and Tua diverge sharply once we hit the twilight zone, with Burrow suddenly becoming extremely gunshy. On the one hand, Tua is ‘putting the ball into play’ more often than his counterpart; on the other, Burrow has not made a turnover-worthy throw in this range and Tua has a 5% turnover-worthy throw rate.

    This is not the only way players differentiate themselves later in downs. Take, for example, Justin Herbert and CJ Stroud, two players who are very close in terms of the rate at which they make non-turnover-worthy attempts downfield in this 0.5s xSTT+/- range. Outside of that, the composition of other outcomes is different, with Herbert scrambling less frequently, taking fewer sacks, and putting the ball in harm’s way less often, largely as a result of throwing the ball away more:

    Herbert averages 0.09 Total Points/dropback here, as opposed to Stroud’s -0.2 Total Points/dropback, largely as a consequence of avoiding bad plays more frequently.

    We can also observe this phenomenon in quarterbacks who are considered to be scramblers. Kyler Murray and Russell Wilson both throw the ball downfield at nearly identical rates but behave rather differently otherwise. Murray tends to hold out hope for the big play (and takes a lot of sacks), whereas the aging Wilson simply opts for checkdowns and scrambles:

    It should not be surprising, then, that Murray’s Total Points/Play of -0.05 here is much lower than Russ’s (0.33). That puts Wilson among the best in the NFL late in the play, while Murray is in the bottom half of the league.

    Ultimately, we’re still talking about a relatively small sample of plays and, therefore, this is subject to variance. These plays could perhaps be bucketed on a more empirical basis – the quarter-second buckets are admittedly a bit arbitrary – in a future study this offseason. There is also an opportunity to examine within-player trends: how behavior at one point in time relates to behavior earlier or later in the play. 

    Furthermore, attempting to control for external variables, like pressures, is likely needed for a more conclusive affirmation of the preliminary findings outlined here. A play with average snap to throw time when there was early pressure might be similar to a late throw with no pressure, for example. Lastly, it might be prudent to take a more longitudinal approach in future studies.

    With few exceptions, quarterbacks in the NFL are too good to be allowed to play under optimal conditions on a down-to-down basis. Efficiency under pressure is crucial, but also has been shown in the past to be noisy. That said, football analytics has come a long way in a short time, and the notion that players can be good or bad under pressure – or even that their behavior under such conditions is somewhat predictable – should be periodically reexamined with newly developed metrics such as xSTT+/-.

  • NFL Statistical Leaders Entering Week 14

    NFL Statistical Leaders Entering Week 14

    Welcome to this week’s edition of the SIS StatPack, our weekly look at leaderboards for Total Points and some of our charting stats. 

    You can e-mail mark@ww2.sportsinfosolutions.com for a free one-week subscription to our DataHub Pro, which allows you access to a wealth of information about NFL team and player performance.
    Total Points Leaderboards
    Highlights from the leaderboards in our flagship stat, Total Points, which attempts to measure everything that happens on the field (full primer here):
    * The five teams listed below as the top defenses in Total Points Per Play are all basically even. The Chargers rank No. 1 by virtue of their top ranking in Pass Coverage. That offsets their ranking 25th in Run Defense and 16th in Pass Coverage.
    * Four teams currently have a 6-6 record but they vastly differ in overall ranking. The Cardinals come in 12th overall, the Falcons are 16th, the Buccaneers are 21st, and the Rams are 22nd. 

    * On the strength of three straight good games, including 152 rushing yards against the Panthers last week, Buccaneers rookie running back Bucky Irving now ranks 3rd among running backs. He leads all rookies in rushing yards and all rookie running backs in receiving yards. 

    Other rookies ranking in the top 5 at a position include Bo Nix (3rd, QB), Jayden Daniels (5th, QB), Brock Bowers (3rd, TE), Jared Verse (1st, DE), and Kamari Lassiter (4th, CB).

    * Lions safety Kerby Joseph is the runaway leader in Total Points not just at his position, but among all defensive players. Joseph’s 7 interceptions in 2024 are tied for the NFL lead. He has allowed 8 completions and no touchdown passes as a primary defender.


    Total Points Power Rankings

    The Top 10 teams in the NFL when taking into account Total Points Per Play for offense, defense, and special teams.

    1. Lions
    2. Bills
    3. Packers
    4. Ravens
    5. Broncos
    6. Eagles
    7. Vikings
    8. Seahawks
    9. Chargers
    10. Chiefs

    Top 5 Offenses

    1. Ravens
    2. Lions
    3. Bills
    4. Packers
    5. Bengals

    Top 5 Defenses

    1. Chargers
    2. Broncos
    3. Vikings
    4. Bills
    5. Eagles

    Total Points Leaders: Quarterbacks

    1. Lamar Jackson
    2. Joe Burrow
    3. Bo Nix
    4. Patrick Mahomes
    5. Jayden Daniels

    Total Points Leaders: Running Backs

    1. Derrick Henry
    2. James Conner
    3. Bucky Irving
    4. Jahmyr Gibbs
    5. Najee Harris

    Total Points Leaders: Wide Receivers

    1. Jauan Jennings
    2. Ja’Marr Chase
    3. A.J. Brown
    4. Nico Collins
    5. Amon-Ra St. Brown

    Total Points Leaders: Defensive Ends

    1. Jared Verse
    2. T.J. Watt
    3. Jonathan Greenard
    4. Myles Garrett
    5. Greg Rousseau

    Total Points Leaders: Linebackers

    1. Bobby Wagner
    2. Andrew Van Ginkel
    3. Zack Baun
    4. Brian Burns
    5. Fred Warner

     Total Points Leaders: Cornerbacks

    1. Christian Gonzalez
    2. Pat Surtain II
    3. Marlon Humphrey
    4. Kamari Lassiter
    5. Jaylon Jones

     Total Points Leaders: Safeties

    1. Kerby Joseph
    2. Amani Hooker
    3. Julian Love
    4. Nick Cross
    5. Taylor Rapp


    Note: These rankings are based on unrounded totals which virtually eliminates ties between players or teams

    Charting Leaderboards

    Leaderboards in various statistical categories based on video review by our staff, including long passes, yards after contact, and pressures.

    E-mail mark@ww2.sportsinfosolutions.com for a free one-week subscription to our DataHub Pro, which allows you access to a wealth of information about NFL team and player performance.


    Leaderboards in various statistical categories based on video review by our staff, including long passes, yards after contact, and pressures.

    * Josh Allen isn’t listed among the leaders in completion percentage on 20-yard passes, but that’s not his fault, as 75% of his passes have been catchable, the fourth-highest rate in the NFL. Allen actually ranks 1st in terms of Points Earned on deep throws. He’s recorded 45 attempts with 17 completions and no interceptions.
    * Check out our new account on Bluesky, where we go beyond what’s in the StatPack to bring you even more football insights.
    For example, this week we put the spotlight on Derek Stingley Jr. Stingley ranks 6th among cornerbacks in Total Points and in terms of charting stats, a primary reason why is that opponents are 5-of-35 on passes thrown at least 10 yards downfield when he is the targeted defensive back.


    Most Completions, Pass Attempts 20+ Yards Downfield

    1. Sam Darnold 23
    2. Bo Nix, Justin Herbert, Geno Smith 20
    5. Jordan Love 19

    Most Receptions, Targets 20+ Yards Downfield

    1. George Pickens 13
    2. DK Metcalf 11
    3. Alec Pierce, Justin Jefferson 10
    5. Courtland Sutton, Darnell Mooney 9

    Most Yards After Contact (Rushing)

    1. Derrick Henry 759
    2. Saquon Barkley 727
    3. Josh Jacobs 675
    4. Kyren Williams 594
    5. Bijan Robinson 586

    Most QB Pressures

    1. Maxx Crosby 61
    2. Trey Hendrickson 57
    3. Jared Verse 52
    4. Will McDonald IV 51
    5. Zach Allen 50

    Most Pressures Above Expectation

    1. Trey Hendrickson 15.6
    2. Will McDonald IV 13.6
    3. Osa Odighizuwa 13.6
    4. Micah Parsons 13.0
    5. Maxx Crosby 12.4

    Click here for our full Charting StatPack, which features deeper lists on these stats.

    E-mail mark@ww2.sportsinfosolutions.com for a free one-week subscription to our DataHub Pro, which allows you access to a wealth of information about NFL team and player performance.

    Matchups and Mismatches

    When we look at matchups by unit and compare the teams playing a particular game, there are intriguing matchups and mismatches each week.

    Here are some we noticed:

    (All references to rankings are in the context of Total Points Per Play)

    * The Bills rank in the top eight in the NFL in every facet (Passing, Rushing, Receiving, Blocking, Run Defense, Pass Rush, Pass Coverage). Their opponent, the Rams do so in only one area (Pass Rush).

    * Check out this week’s Off the Charts Football Podcast for an in-depth dissection of Sunday night’s Chargers-Chiefs matchup, in which the Chargers top-ranked Pass Coverage takes on a Chiefs offense that may not rank as high as you would think (currently 10th overall).

    * The Raiders and Buccaneers matchup is amusing in that it pits the teams with the two worst pass coverage units in the NFL against each other. Both teams rank in the top 10 in Receiving but in the bottom 10 in Passing, so it’s anyone’s guess whether the offenses will be able to take advantage.

    Find your own matchups and mismatches here. You can also find much of this information at the SIS DataHub.