Sports Info Solutions
Category: NFL Draft
-
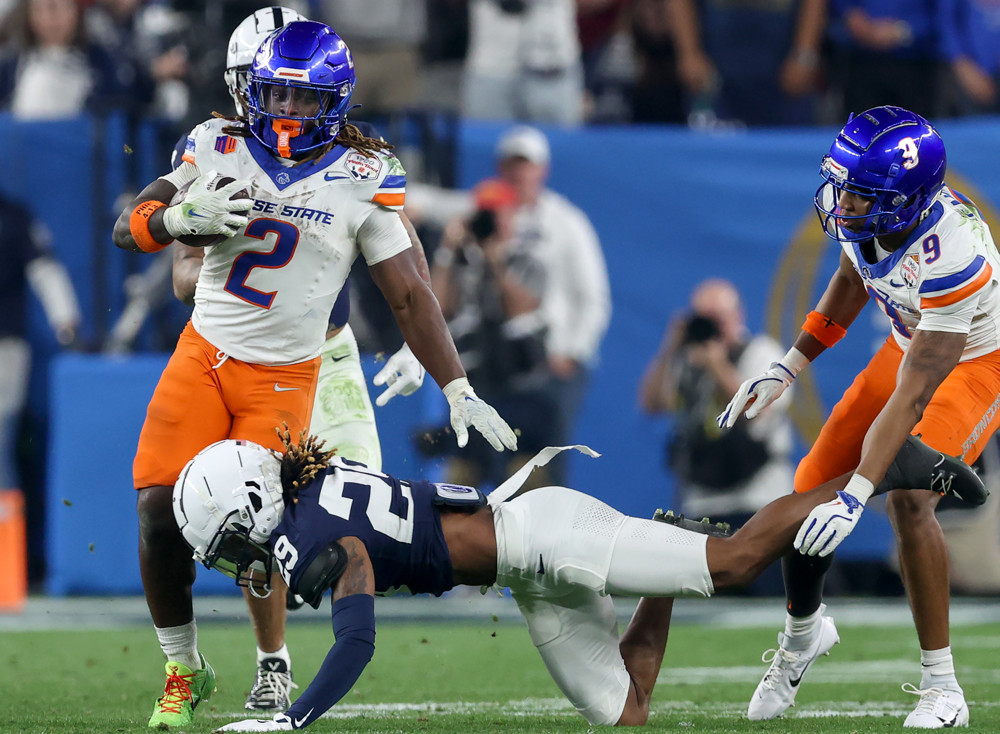
Analyzing Ashton Jeanty’s Eye-Popping & Head-Scratching Stats
By
“I’m here to offer just a little dab, a splash, of cold water based on how others with his rushing profile have performed at the next level.”
-
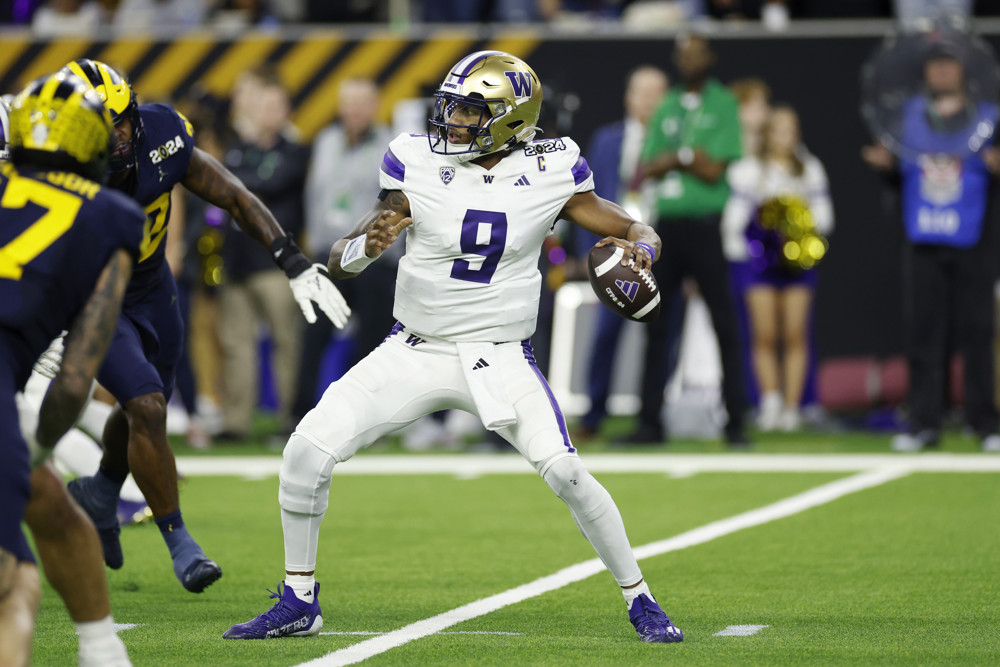
NFL Scouting Report: Michael Penix Jr.
By
Michael Penix has had a ton of time to develop in college but has spent a good amount of that time rehabbing from injuries, so he may not yet be at his full ceiling.
-
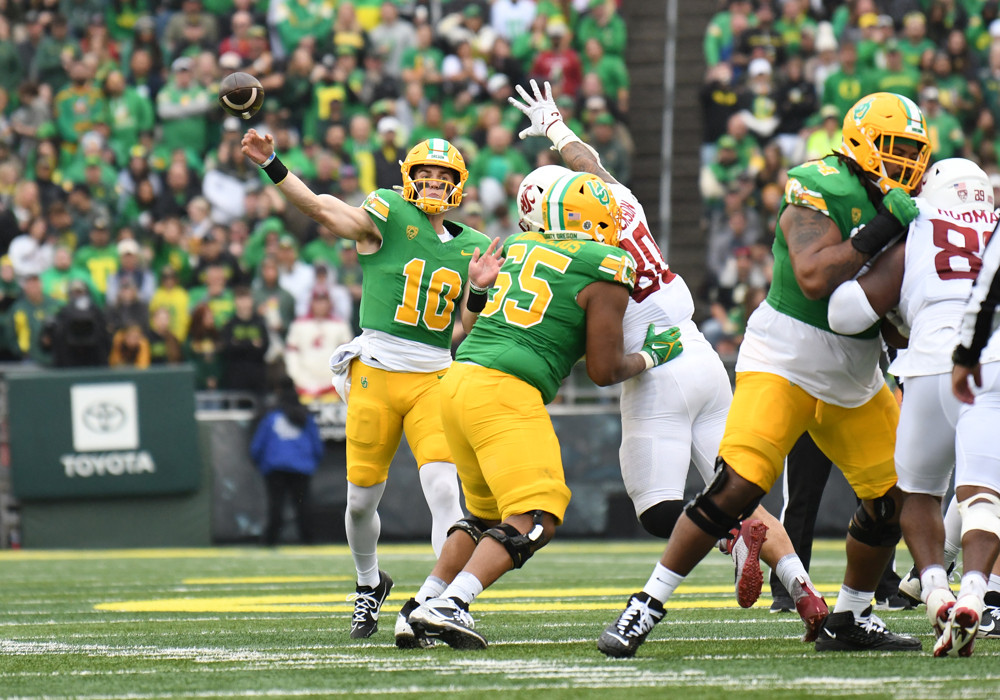
NFL Scouting Report: Bo Nix
By
Nix projects as a quality backup at the next level who has enough ability to be an effective quarterback in standard down-and-distance situations.
-
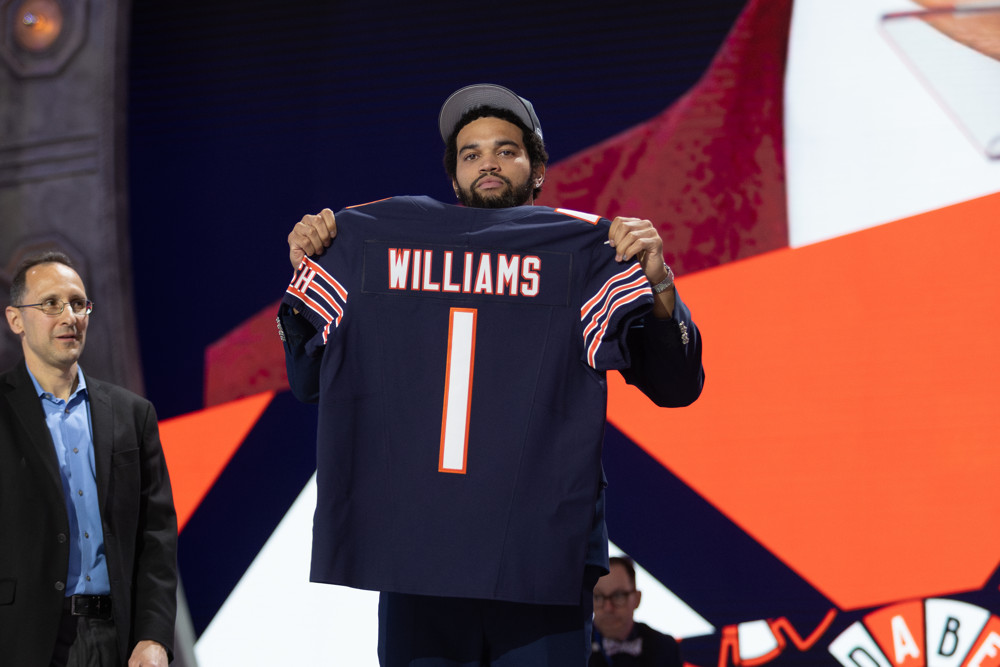
NFL Scouting Report: Caleb Williams
By
Williams projects as a ”win because of” franchise quarterback who can thrive in an offense that blends RPOs with traditional dropbacks and will utilize his athleticism
-
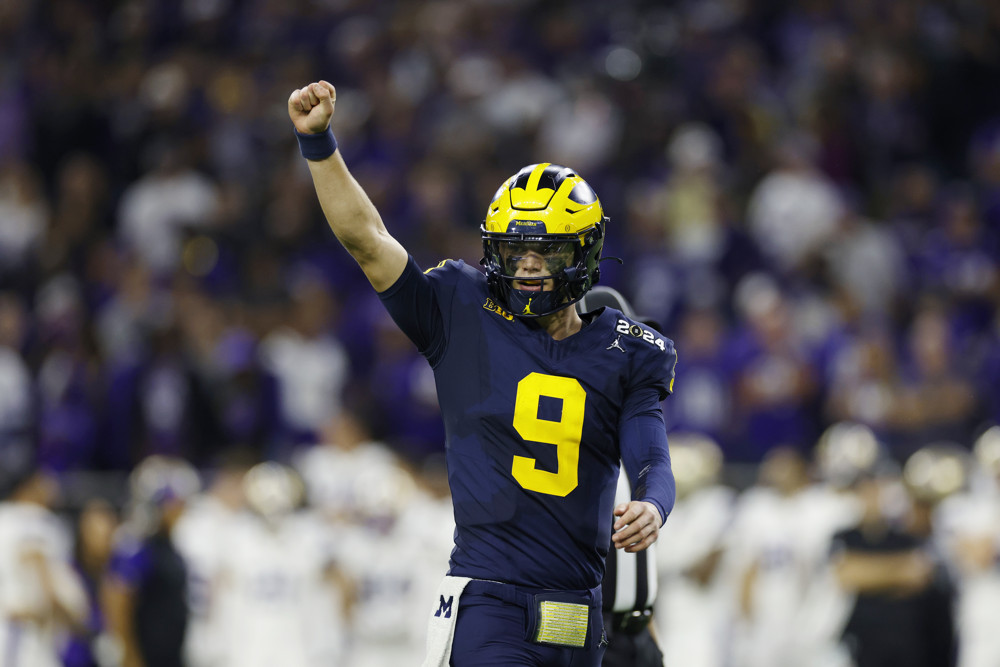
NFL Scouting Report: J.J. McCarthy
By
McCarthy projects to be a circumstantial starting quarterback with the potential of developing into a “win-with” level quarterback
-
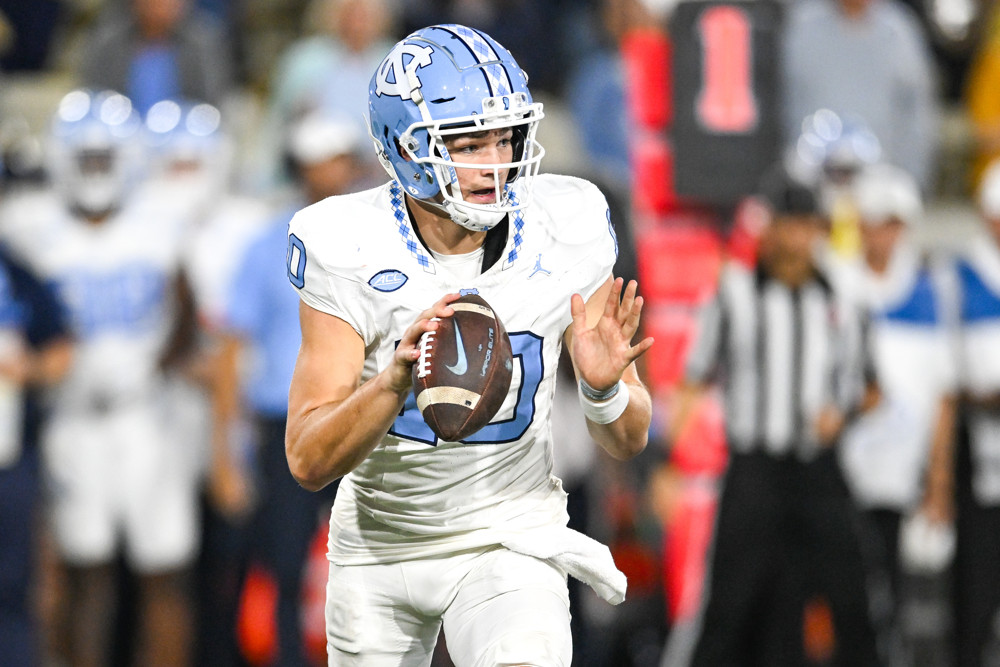
NFL Scouting Report: Drake Maye
By
Overall, Drake Maye projects to become a strong starting quarterback with “win with” ability
-
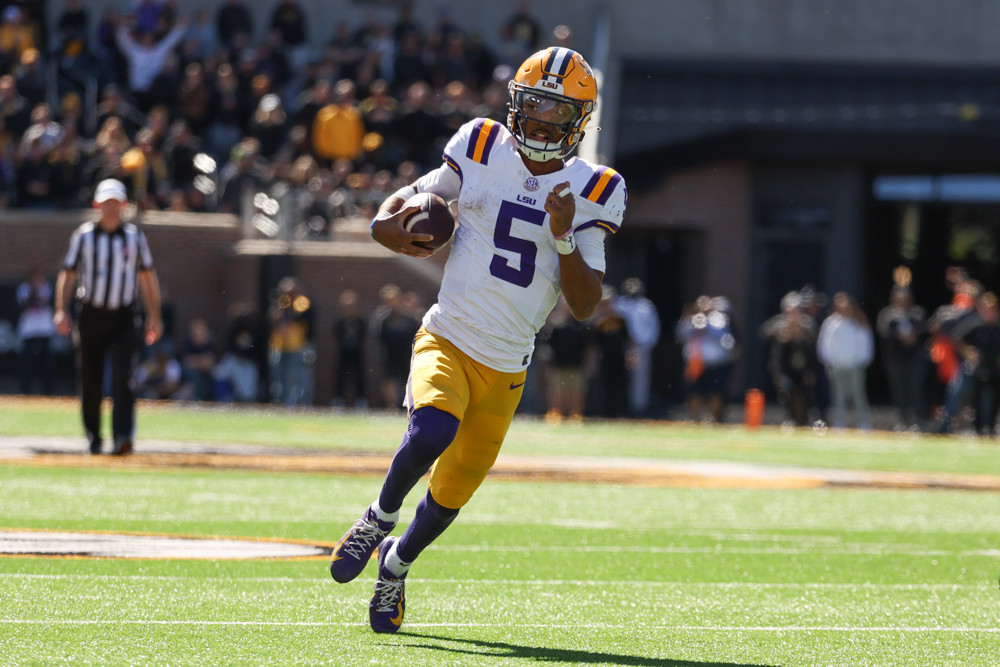
NFL Scouting Report: Jayden Daniels
By
Jayden Daniels is impressive as a passer but is a potential game-changer as a runner.
-
Reviewing Our Grades for the 2021 NFL Draft Class
By
It’s not fair to review a draft class immediately after the picks are made. You have to do what we do – go back and review it 3 years later.
-

2024 SIS NFL Draft Team Grades
By
The Bears had the No. 1 overall pick in Caleb Williams and the No. 1 overall draft class.
-
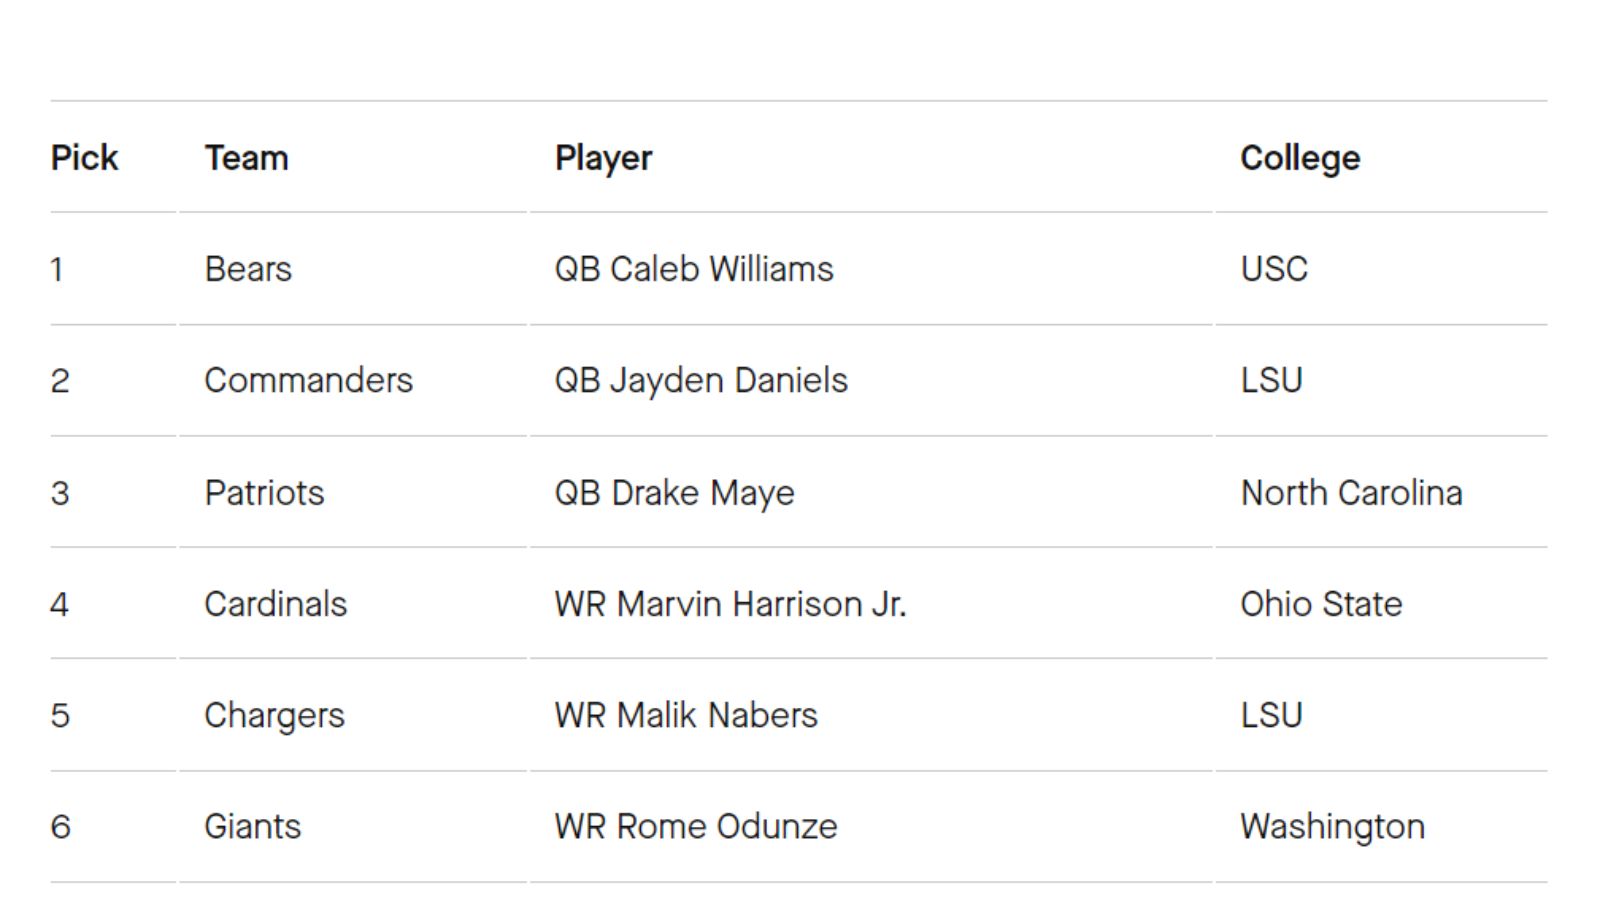
Nathan Cooper’s First & Final 2024 7-Round Mock Draft
By
Which way will this draft go? One of SIS’ experts weighs in.