Category: NFL

  • Which NFL teams Would Be Most Justified In Drafting For Need?

    Which NFL teams Would Be Most Justified In Drafting For Need?

    We’re going rogue in the SIS Football Research department, and we’re going to do something that our fearless leader Matt Manocherian would almost certainly not approve of: we’re going to analyze the NFL Draft from the perspective of team needs.

    While we acknowledge that every team is always an injury away from having a brand new need, there must be some teams for whom need-based drafting would make more sense than others. Here’s our attempt at sorting that out:

    Separating “Wants” from “Needs”

    To evaluate each team’s roster, we used the Sonar Depth Chart that we publish on the SIS draft site and the 33rd Team site. For this visualization, each starter on the depth chart is evaluated relative to the rest of the league using their Total Points per game in their most recent season’s worth of games.

    Using Sonar, we thought of teams as having “wants”—starters that are below the 50th percentile—and “needs”—positions that are below the 25th percentile. We then determined the extent of a team’s wants and needs by how far off each position was from no longer being a want. 

    To identify teams with the most specific needs, for each team we compared the total extent of their needs to the total extent of their wants, simply by subtracting them. 

    For example, a team that’s middle-of-the-road across the board with the exception of three players who are in the 20th percentile would have the highest possible rating, because all of their sub-par positions are positions of need. A team that’s full of 33rd percentile players would probably be rated as worse overall, but they wouldn’t have any specific needs. 

    So, here is every team in the league ordered by this metric, with links to the team pages on the SIS draft site. A handful of teams are spelled out in more detail, but you can evaluate all of the rosters yourself by following each link.

    And for reference, here is the color scale used to illustrate the quality of each starter:

    Color scale for the Sonar depth chart visual. Blue is low and orange is high.

    1. Eagles

    Sonar depth chart visualization for the Eagles. They have low-quality starters at two linebacker positions, right guard, and third wide receiver, a couple of below-average positions, and mostly good players otherwise.

    Just look at this depth chart and you know we’ve nailed the goal of identifying teams with specific needs. For a team coming off an excellent season they aren’t as well-positioned to take “luxury picks” as you might think, especially after losing multiple defensive starters to free agency. They have multiple first rounders, so they could have an opportunity to go for both a position of need and a best-player-available selection.

    2. Seahawks

    3. Chargers

    Chargers Sonar depth chart visual. Their worst position is slot cornerback, they have below average players at S, DT, RT, and WR3, as well.

    The Chargers might need to look at a cornerback early on after struggling to solidify the opposite side of Asante Samuel Jr. with a struggling and injured J.C. Jackson. Adding a defensive tackle would fill one of their biggest needs too. Filling these major needs can make this one of the most complete rosters in the NFL.

    4. Raiders

    Raiders Sonar depth chart visualization. They have very bad starters at all but three defensive positions, as well as below average players at both guard positions and quarterback.

    The Raiders have many more holes than the teams ahead of them on this list, but they are almost all strong needs. Their struggles primarily fall on the defensive side of the ball, with a back seven that Sonar makes look like the cast of the next Avatar movie. They finished the season 2nd to last in Pass Defense Total Points and allowed the highest EPA/play on passes. In addition to the backend, their linebacking corps can use improvement after losing Denzel Perryman to the Texans. Sitting at pick No. 7, they are in a good spot to address one of these defensive holes.

    5. Titans

    Titans Sonar depth chart visualization. They have poor players all along the offensive line, at two of three wide receiver slots, at LB and at CB, with several players just above or below average.

    The Titans have major needs on the offensive side of the ball. After presumably losing Taylor Lewan to free agency, the Titans need to address their offensive line that already was in the bottom third in production a season ago in terms of Total Points. On top of that, another receiver would be welcomed after finishing in the bottom tier of Receiving Total Points. If the Titans end up taking a QB in the first round, it might be an unenviable position to be in for the young signal-caller.

    6. Bengals

    7. Vikings

    8. Saints

    9. Ravens

    10. Jaguars

    Jaguars Sonar depth chart visualization. They have poor starters at slot cornerback and right tackle, several average players on the offense and defense, and a handful of strong starters across both sides of the ball.

    It might not look it based on the Sonar visual, but the Jaguars actually rated as the team with the smallest total value of their wants. There are opportunities for improvement on the offensive line and in the back seven defensively, but they’ve established solid starters on both sides of the ball. They won’t have as good of an opportunity to improve through the draft as they have in recent seasons because they were actually pretty good in 2022, but that’s a problem they’d accept.

    11. Texans

    12. Dolphins

    13. Cardinals

    Cardinals Sonar depth chart visualization. They have poor starters at several positions on each side of the ball, with strong starters at S and WR (both of whom have requested trades).

    And here we have the neediest team, but one with enough wants to go with them that they don’t top this list. The Cardinals could use the most help in their front seven after a couple of key departures, and their depth at receiver could look a lot better if Marquise Brown and Rondale Moore take steps forward in 2023 (or a lot worse if DeAndre Hopkins departs). Kyler Murray has his faults, but he’s not going to be replaced with the No. 3 pick in this year’s draft, so they have a great opportunity to start filling in these gaps.

    14. Packers

    15. 49ers

    16. Jets

    17. Broncos

    18. Browns

    19. Chiefs

    20. Commanders

    21. Bills

    Bills Sonar depth chart visualization. They have poor starters at LB and WR3, two strong starters on each side of the ball, and a bunch of players in the middle.

    The Bills roster is balanced and strong. Wide receiver and linebacker are their biggest needs, but they could also stand to bolster the offensive tackle position as well. Sitting at pick No. 27, they certainly won’t have a first choice of who they want, so it would be wise to take the best player available.

    22. Patriots

    23. Steelers

    24. Lions

    25. Giants

    26. Buccaneers

    27. Colts

    28. Falcons

    29. Cowboys

    30. Bears

    31. Rams

    Rams Sonar depth chart visualization. They have below-average players at nearly all defensive positions and just three solidly above average players.

    How things have changed in the span of two years! The Rams look like a bare cupboard after several post-Super-Bowl departures, and one of the better positions listed on their Sonar is headed up by tight end Tyler Higbee, whose usage and hands performance in 2022 suggest he’ll be more valuable as a blocker than receiver going forward. They have the most wants in the league, but, because there are so many of them, their targets shouldn’t be as defined as the teams above them.

    32. Panthers

    Panthers Sonar depth chart visualization. They have average-to-better players at all but one defensive position, but below-average players at most offensive positions (with no poor starters, however).
    The Panthers are a great example of what we’re trying to do here. They have zero needs by this measure, but have several wants (primarily on the offensive side of the ball). Establishing a franchise QB with the first pick in the draft will help, but there is definitely some work to be done across the skill positions with DJ Moore out of the picture. The Miles Sanders signing isn’t viewed too positively through the Total Points lens, but there’s no doubt they’re in a better spot at running back than they were without him.

  • 2023 NFL Draft AnalySIS: Las Vegas Raiders

    2023 NFL Draft AnalySIS: Las Vegas Raiders

    Leading up to the NFL Draft, SIS will be publishing team previews for those with Top 10 picks in the draft. Each preview will look at the players who most make sense for that team at that selection based on stats and scouting factors and will include quotes from that player’s scouting report.

    You can find more than 300 scouting reports and much more team analysis at our NFL Draft website.

    The State of the Raiders:

    The Raiders and 2nd year head coach Josh McDaniels move into the 2023 season without their long-time QB Derek Carr. They have, for the time being, filled that hole with the signing of Jimmy Garoppolo. However a long term answer at the position is still looming and could be addressed here in the draft. 

    The Raiders are also looking to rebuild defensively in a highly-challenging division with the likes of Patrick Mahomes, Justin Herbert, and Russel Wilson. The free agent signings of Marcus Epps, Robert Spillane, Duke Shelley, and Brandon Facyson will help but they may not be done bolstering their defense with their plethora of 2023 draft picks.

    #7 Overall

    Devon Witherspoon – CB – Illinois

    Witherspoon has the press-man coverage and ball skills to be a solid starter in any NFL defense, but he will need to improve his open-field tackling and off-man ability to hit his ceiling as a true No. 1 shutdown corner.

    The Raiders need plenty of help on the defensive side of the ball and Witherspoon, with his high-end ball skills, can provide immediate help to their secondary. 

    Christian Gonzalez – CB – Oregon

    Gonzalez is a versatile corner with the reactive athleticism, speed, and ball skills to make a huge impact in the NFL, but he may struggle with bigger targets at times.

    Gonzalez’s speed and versatility can be of great value to the Raiders’ secondary and position him to be a Day 1 starter. 

    Tyree Wilson – ED – Texas Tech

    Wilson is a long, strong power rusher who can rush the quarterback and defend the run, but a lack of speed and agility may be traits that hold him back early in his career.

    Wilson’s power and proven production at the college level allows him to be a good complement opposite Maxx Crosby to get after the QB.

    Anthony Richardson – QB – Florida

    Richardson is the full package talent wise with the dual-threat ability and arm strength coveted at the next level, but he will need to refine his mechanics and simplify his decision-making to be a more consistent player.

    If Richardson is still available, the Raiders can take a shot at a very talented QB that can learn and develop in an NFL system. 

    Will Levis – QB – Kentucky

    Levis is a boom-or-bust prospect who has high-end physical traits and upside to be an All-Pro, but he needs massive improvements to his decision making and accuracy in order to achieve his potential.

    Levis has plenty of high-end traits to make him a quality pickup who can grow as a part of the Raiders future plans at QB.

    To learn more about the Raiders and their needs, visit their team page on our NFL Draft website here


  • 2023 NFL Draft AnalySIS: Atlanta Falcons

    2023 NFL Draft AnalySIS: Atlanta Falcons

    Leading up to the NFL Draft, SIS will be publishing team previews for those with Top 10 picks in the draft. Each preview will look at the players who most make sense for that team at that selection based on stats and scouting factors and will include quotes from that player’s scouting report.

    You can find more than 300 scouting reports and much more team analysis at our NFL Draft website.

    The State of the Falcons:

    The Falcons are entering into year three of the Terry Fontenot and Arthur Smith General Manager-Head Coach pairing. Year 3 is often a make it or break it season for an NFL Head Coach, as the average tenure for a NFL coach is 3.2 seasons, according to Guiding Metrics. With the NFC South perceived to be wide open, this could be a window of opportunity for the Falcons to reach the playoffs for the first time since 2017.

    The Falcons have added some valuable weapons to the offensive side of the ball through the draft the last two seasons in Kyle Pitts, Drake London and Tyler Allgeier. Even with the Falcons success on offense, the defensive side of the ball has been less than stellar. They did add some key veterans in safety Jesse Bates, and defensive lineman Calais Campbell and David Onyemata, but could benefit even more by adding some young elite defensive prospects as well. 

    #8 Overall

    The Falcons are entering into year three of the Terry Fontenot and Arthur Smith General Manager-Head Coach pairing. Year three is often a make it or break it season for an NFL Head Coach, as the average tenure for a NFL coach is 3.2 seasons, according to Guiding Metrics. With the NFC South perceived to be wide open, this could be a window of opportunity for the Falcons to reach the playoffs for the first time since 2017.

    The Falcons have added some valuable weapons to the offensive side of the ball through the draft the last two seasons in Kyle Pitts, Drake London and Tyler Allgeier. Even with the Falcons success on offense the defensive side of the ball has been less than stellar to say the least. They did add some key veterans in safety Jesse Bates, and defensive lineman Calais Campbell and David Onyemata, but could benefit even more by adding some young elite defensive prospects as well. 

    #8 Overall

    Jalen Carter – Edge – Georgia

    There are almost no flaws in Carter’s on-field play and with an increased effort and professionalism combined with his ability to force teams to change gameplans, he can put himself in the NFL DPOY discussion every year.

    The off the field concerns have started to lower Carter’s floor to be selected in this draft, and if he makes it down to the 8th pick it would be difficult for Atlanta to pass up. Carter’s combination of explosiveness and power would immediately strengthen the interior of the Falcons defensive front.

    Nolan Smith – Edge – Georgia

    Smith is a supremely athletic prospect with elite speed and explosive ability to go with eye-opening strength held together by good football intelligence and a very disciplined game overall.

    Terry Fontenot and the Falcons value elite athletes in the first round, and there aren’t many more in this class outside of Smith. The Georgia native would bring a different body type and skill set to a subpar edge group. 

    Tyree Wilson – Edge – Texas Tech

    Wilson is a long, strong power rusher who can rush the quarterback and defend the run, but a lack of speed and agility may be traits that hold him back early in his career.

    Wilson has a towering frame with a long wingspan to match. The Falcons recently signed seasoned veteran Calais Campbell who has a similar size and athletic profile to Wilson, and Campbell could serve as a mentor to the young athletic edge rusher. 

    Anthony Richardson – Quarterback – Florida

    Richardson is the full package talent wise with the dual-threat ability and arm strength coveted at the next level, but he will need to refine his mechanics and simplify his decision-making to be a more consistent player.

    This is the offensive wild-card selection of the group the Falcons could target. Continuing the theme of elite athletes, Richardson is one of the most athletic quarterback prospects in draft history. While the Falcons did just draft Desmond Ridder in the 3rd round a season ago, Richardson’s athleticism would be a match made in heaven in Arthur Smith’s offense. 

    To learn more about the Falcons and their needs, visit their team page on our NFL Draft website here. (https://nfldraft.sportsinfosolutions.com/nfl-draft/teams/atlanta-falcons)

  • Revisiting Our Draft Pick Value Curve

    Revisiting Our Draft Pick Value Curve

    Last year we dipped our toes into the conversation about draft pick value. Stephen Polacheck took two-year Total Points as the measure of performance and computed a curve that represents what you can expect from a selection throughout the draft.

    This year we’ll take that work and extend it to two particular lines of inquiry: the potential value over a full contract, and the value teams are ascribing to future picks.

    Production over a full rookie deal

    Our previous iteration looked only at the Total Points accumulated in a player’s first two years. This is in line with how our scouting process works, as our grades project a player through his second NFL season. But there are enough players who jump up or fall off in the final years of their rookie deals that we wanted to look at a longer time horizon as well.

    Here are the draft curves that we generate after each year in the first four. 

    The biggest thing I notice when looking at these plots is that, in general, the differences between the curves are pretty consistent year-over-year. That basically means that we’re not seeing some kind of dramatic change in production of players in their third season, or something like that.

    We can see a production advantage for early first round picks that persists throughout the player’s first contract. A player taken at the top of the first round essentially doubles the productivity of a player taken at the end of the first round at each step. That suggests top picks are overvalued by the rookie wage scale, which gives top draft picks roughly three times the contract value of a player selected at the end of the first.

    You should notice the little hitch in the curve at around the end of the second round. That’s in part because these curves are actually made by blending a steeper first round curve with a more gradual full-draft curve, which results in a curve that doesn’t have a single smooth trajectory. But it’s also a kind of quirky peak of productivity over the past several years that is hard to fully smooth out. Just picks 62 to 64 from 2016 to 2021 have produced Carlton Davis, Kevin Byard, James Bradberry, Creed Humphrey, JuJu Smith-Schuster, and DK Metcalf.

    Applying the value curve to previous trades

    At this point we’re pretty familiar with the notion that the relatively flat curve of draft pick value past the top of the first round suggests that trading back is generally a pretty valuable proposition. 

    For example, all of the seven pick-for-pick trades in the first round of the 2022 draft yielded more total expected production for the team moving down than the team moving up. How much value that is depends on which of the above curves you use, but the general trend is the same.

    What I’ve found more interesting of late is the trading of future picks. Just in the first round of the 2021 draft, three pick-for-pick trades involved a future first round pick changing hands:

    • The 49ers moving up 9 slots to take Trey Lance
    • The Dolphins moving up 6 slots to take Jaylen Waddle
    • The Bears moving up 9 slots to take Justin Fields

    It’s tough to build a model that prescriptively assigns value to a future draft pick, because teams should place different value on future assets based on their franchise trajectory. But trades that have already been made can tell us something about how much temporal discounting teams are building in.

    Let’s run these three trades through our model, comparing the projected four-year Total Points for the picks going each direction. We can assume that the difference between these values should be roughly the value teams are ascribing to the future picks included in those deals. 

    Projected Four-Year Total Points of Picks Traded in 2021

    2021 pick value  given up 2021 pick value received Suggested Value

    Rest of Trade

    49ers -> Lance 88 119 31*
    Dolphins -> Waddle 107 119 12
    Bears -> Fields 83 101 19*

    * Multiple future picks were traded

    For a little bit of context, that “rest of trade” value can be compared to the value of a single pick in the current draft. The 31 projected Total Points that make up the remainder in the Lance deal—and therefore roughly what we think the future picks are worth—is comparable to the 87th pick in the current draft. The future picks in the Waddle deal compare to the 153rd pick in the current draft, and for Fields it’s the 121st pick.

    So, if those trades were to be fair—which we actually shouldn’t expect them to be, because the team trading up is almost always going to pay a bit of a premium—the future picks would be valued at somewhere between a third rounder and a fifth rounder in total. Compared to a conventional-wisdom heuristic that a pick next year is worth one round less than a pick this year, we’re seeing some pretty heavy devaluing of future first round picks. 

    We can also think of this through the lens of the implied discounting rate for a pick year-over-year. The Waddle example suggests that a future first round pick—which we can assume is the 16th pick in the next draft, for simplicity—is getting discounted by about 85% within one year (from 79 projected Total Points to 12). The Fields deal has a similar implied discounting rate.

    Virtually all people employed by NFL teams are living in a world where you can’t guarantee your employment for very long, so it’s not unreasonable for teams to heavily devalue future draft picks. After all, even a draft pick this year might not bear fruit for two more seasons. But if teams are so willing to make trades to move up a few spots in the first round, it seems odd that they would value creating a first round pick from nothing, even if it’s deferred a year, would be more valuable than it seems to be.

    Future Directions

    With each year that we accumulate data, we also gather more firepower to build frameworks to evaluate the long-term value of players (and draft picks). Integrating draft pick value with long-term player projections will allow player-for-pick trades to be analyzed more usefully, and of course bringing in salary information (for player trades and for incoming rookies) informs teams’ decisions greatly.

    Look for us to reference these draft pick values in evaluating trades during the upcoming draft season. Of course, keep in mind that these models are still a work in progress when it comes to measuring some of the “softer” factors that contribute to trade decisions. We still have some work to do to measure how much we should expect a team to overpay for the right to move up, and how much scarcity of available players at the position being acquired moves the needle.

  • Study: Combine Measurements and Total Points – Do they Correlate?

    Study: Combine Measurements and Total Points – Do they Correlate?

    After a week of workouts, drills, and interviews, combine week has come to an end and NFL teams are now deep in draft evaluation. Some players have had record-setting performances, while others might have more work to do at their Pro Day to shoot their name up big boards. The data is now there for everyone to analyze, but the question is: 

    What do these combine numbers actually mean?

    There has been a lot of discussion over the past few years as to whether or not combine results translate to a better performance on the field. Does the height, weight, arm length, hand size, 40-yard dash time, number of 225-lb. bench presses, vertical jump measurement, broad jump measurement, 20-yard shuttle run time, or 3-cone drill time of a player truly predict immediate future performance for a 1st- or 2nd-year player in the NFL?

    There have been studies done in the past (here and here) in finding correlations from combine  measurements to draft order, salary, and player performance. In regards to the latter, player performance was measured in total yards, yards in rates, and quarterback rating.

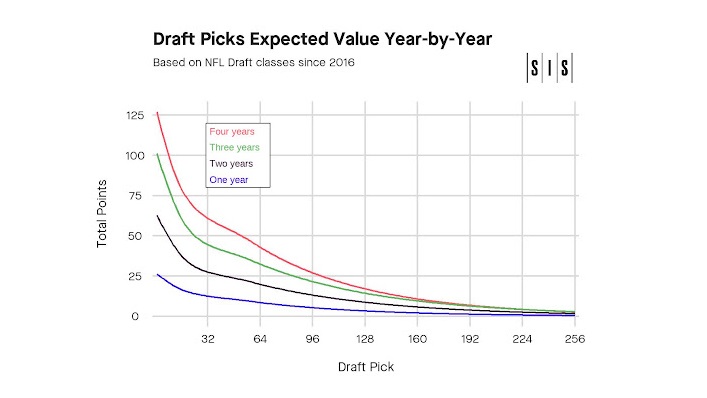
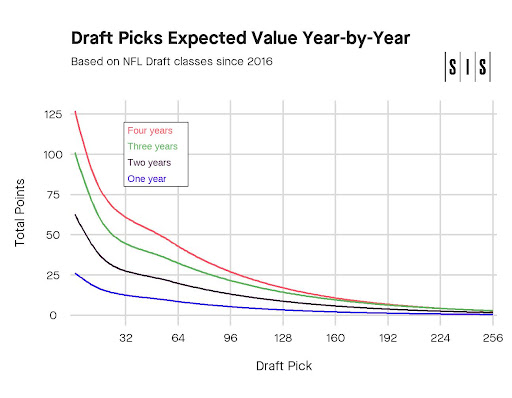
    At SIS, we can use our Total Points metric as the proxy to player performance to find correlations to combine measurements. For the purpose of this article, combine data from players who participated between 2016-2020 was collected and compared to the respective player’s first two-year Total Points sum. Correlations were computed between both Total Points and categorical Total Points (ex. Passing Total Points) based on positions to find any signal for a specific skill. 

    Without any further ado, let’s dive into the numbers…

    Quarterbacks

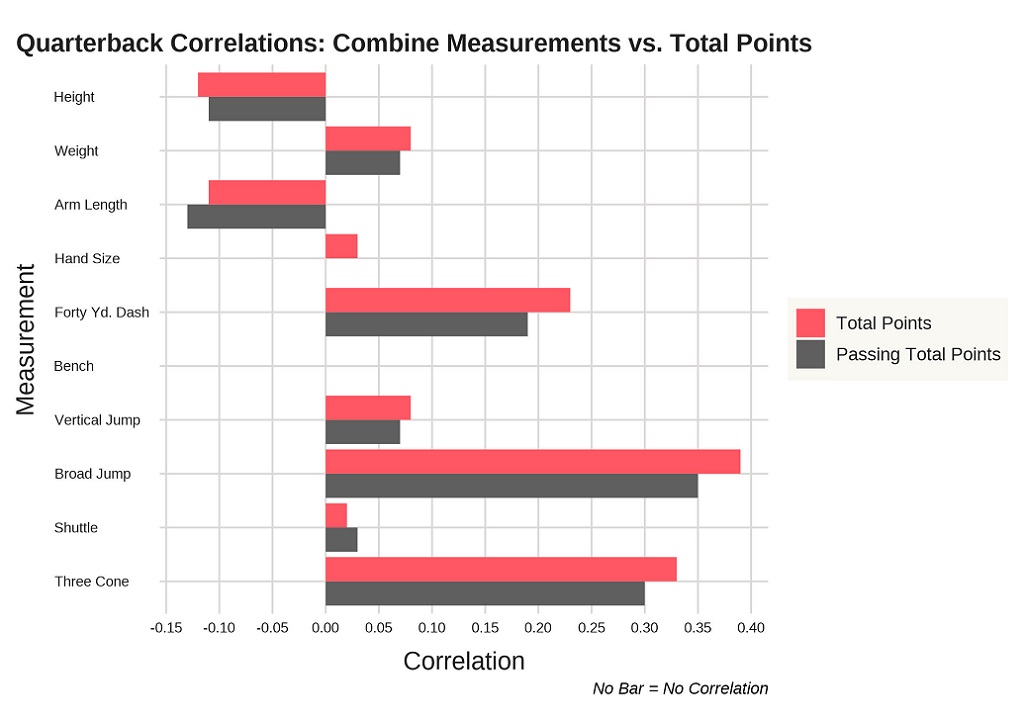
    When it comes to quarterbacks, it is not a big surprise that Total Points and Passing Total Points are very similar. The main skill the quarterback has to perform is throwing the football, so seeing that these two align for most measurements make sense. 

    Three measurements that stand out from the rest in terms of correlating to Total Points. The broad jump takes the cake as the highest correlated at 0.39 (0.35 Pasing Total Points), followed by the three cone drill at 0.33 (faster times lead to more Total Points) and the 40-yard dash at 0.23.

    Contradicting some of the discourse about quarterback hand-size, this measurement has a 0 correlation to Passer Points. Turns out Kenny Pickett might have a chance after all!

    Running Backs

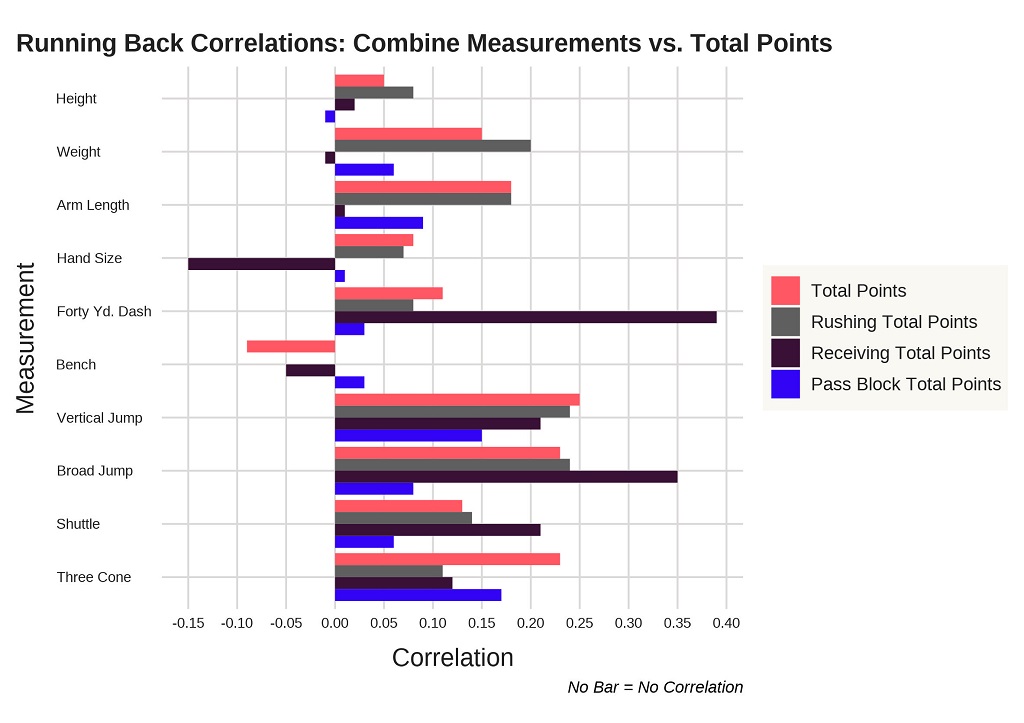
    When looking strictly at Rushing Total Points, there are three measurements that clear the 0.2 correlation threshold. Weight, vertical jump, and broad jump measurements correlate the most to Rushing Total Points. 

    This suggests that explosiveness and leg strength translate well to the next level and can be a potential indicator of running back performance. Across the board, being bigger and faster correlates with success.

    When it comes to Receiving Total Points, the 40-yard dash and the broad jump correlate the most by far. This suggests that the ‘explosive pass-catcher out of the backfield’ moniker truly does exist.

    Looking at Pass Block Total Points for running backs, the three cone drill and vertical jump seem to predict some success at the next level.
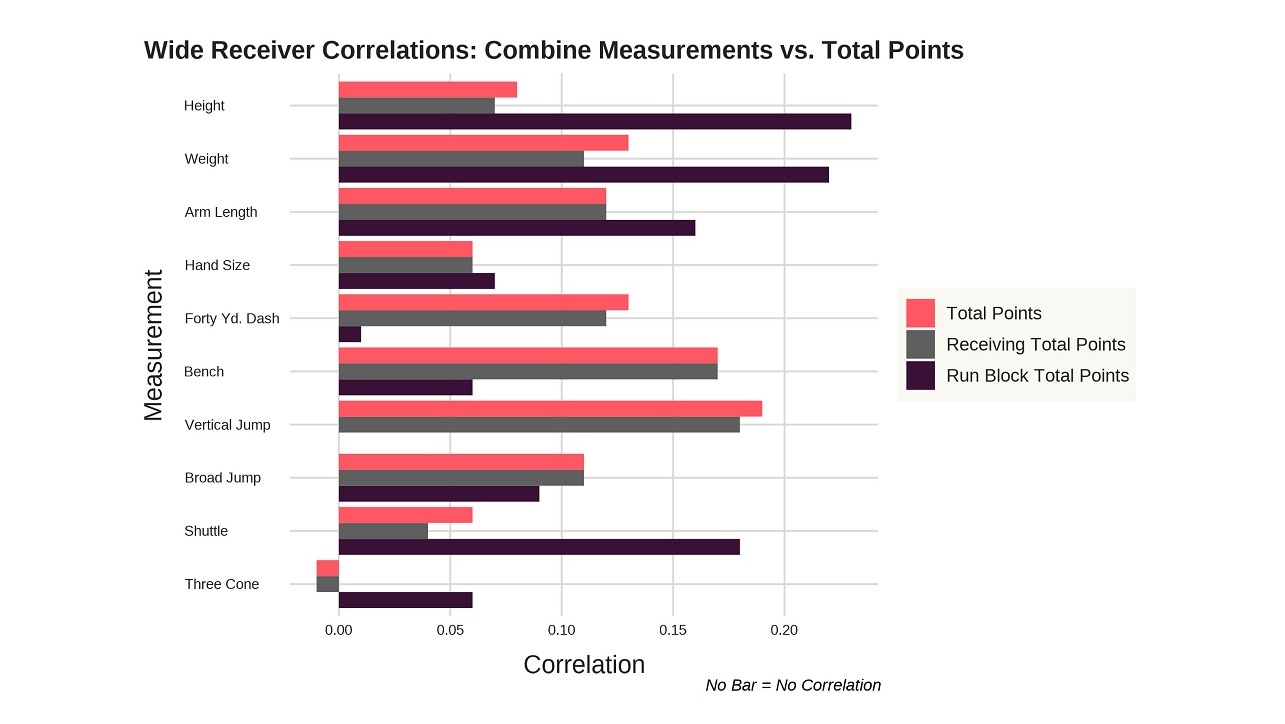
    Wide Receiver

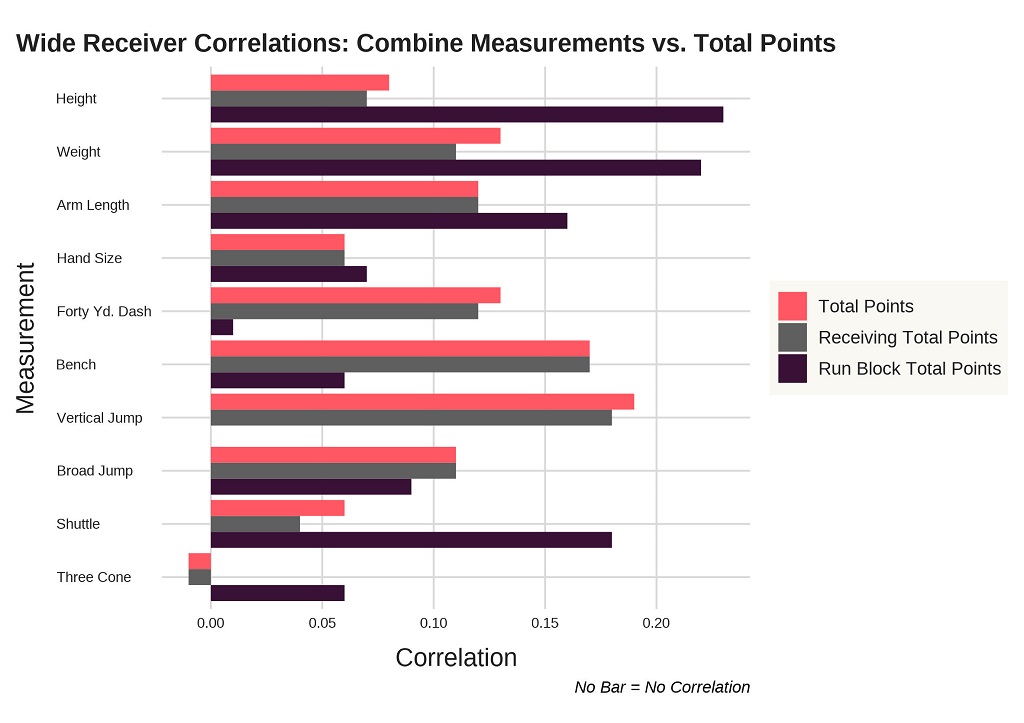
    The vertical jump and bench reps stand out as the two highest correlated measurements to Receiving Total Points. Even though the average Run Blocking Total Points value among receivers is small, height, weight, arm length, and the shuttle run correlate the most out of these measurements when projecting success.

    No measurements for Receiving Total Points reach the 0.2 threshold. One point to note is that pass blocking correlations in height and weight for receivers are much higher than those for the running backs.

    Offensive Linemen

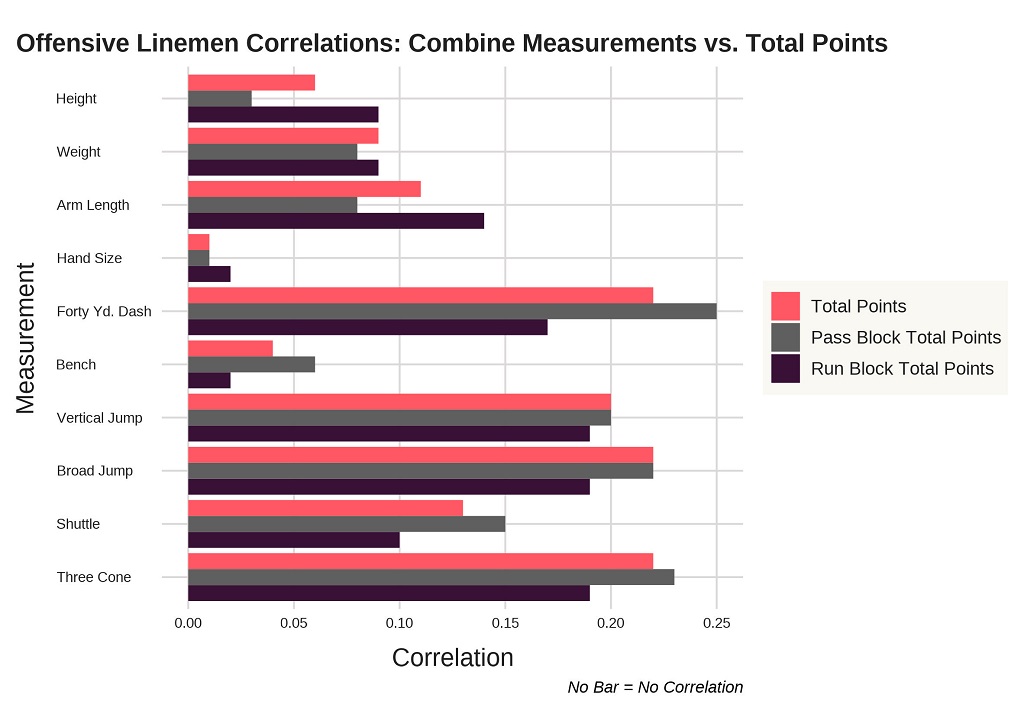
    Pass Blocking and Run Blocking Total Points correlations for offensive linemen are similar for each measurement, with the 40-yard dash, arm length, and height having some difference between the two. Surprisingly, height and arm length seem to correlate more with run blocking than pass blocking.

    Overall, the 40-yard dash, three cone drill, vertical jump, and broad jump are the highest correlations when it comes to offensive line play. Bench reps have a low correlation, once again showing that leg strength and explosiveness predict higher success.
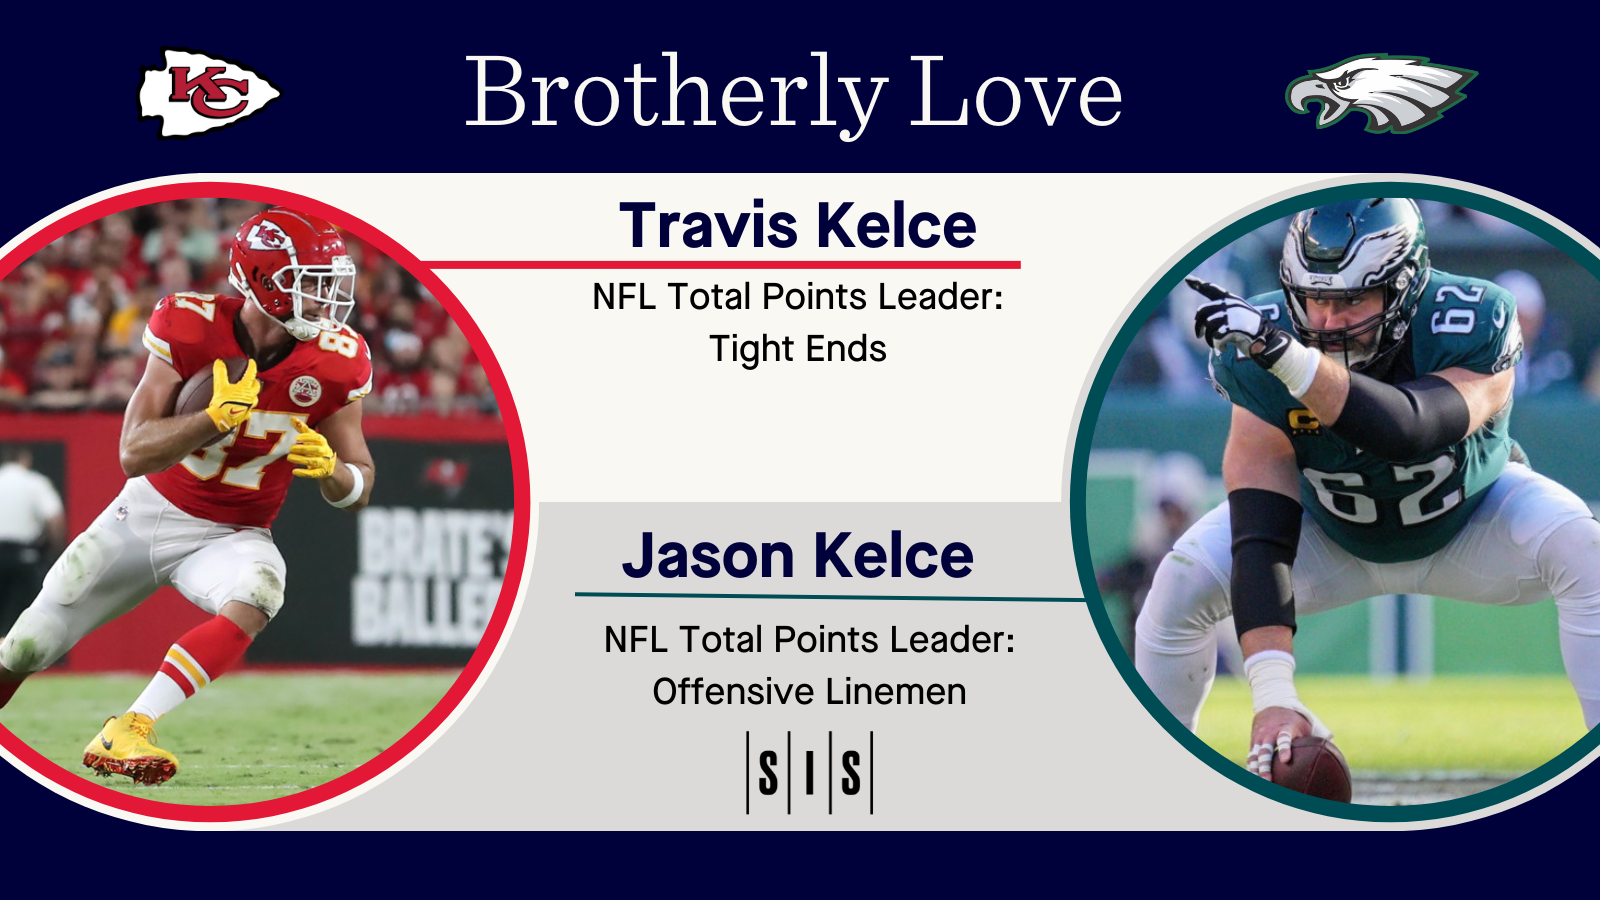
    Tight Ends

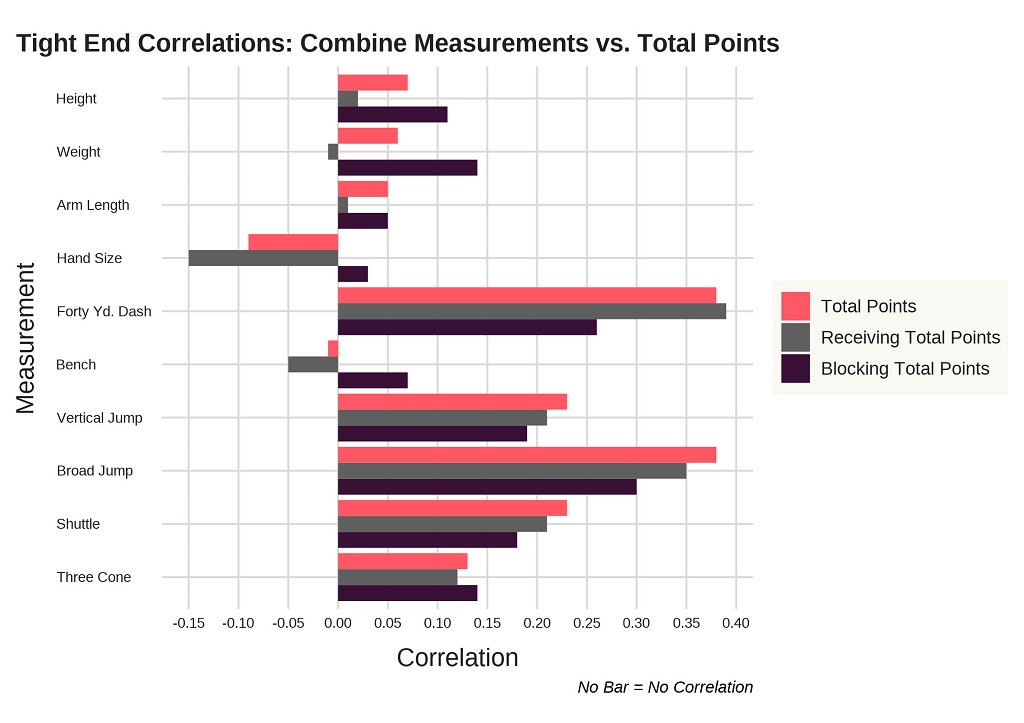
    For tight ends, the 40-yard dash and the broad jump have high correlations to Total Points, as they both nearly reach the 0.4 correlation threshold. The vertical jump does not fall that far behind either.

    The difference in broad jump, shuttle times, and three cone times between tight ends and receivers in Receiving Total Points is interesting. The get-off speed for a tight end might result in higher Total Points, which can be measured in explosiveness from the legs.

    Defensive Linemen

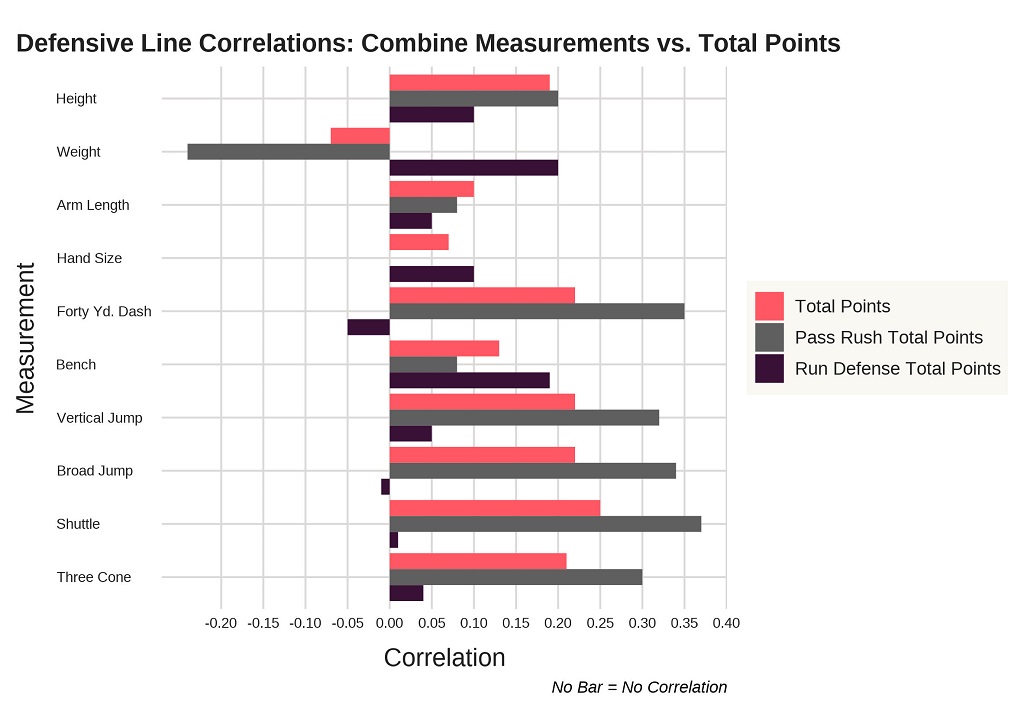
    Moving along to defense, we start with the defensive line. All of the speed measurements, height, weight, vertical jump, and broad jump correlate well to Pass Rush Total Points. This is very different when compared to Run Defense Total Points, as the higher the weight and more bench reps, the higher the Total Points value.

    All in all, an athletic freak on the defensive line when getting to the passer seems to be a good thing to have. On run defense, a strongly built defensive linemen is the key for success. The contrast between these two skill sets in one position group is the biggest from this analysis. 

    Linebackers

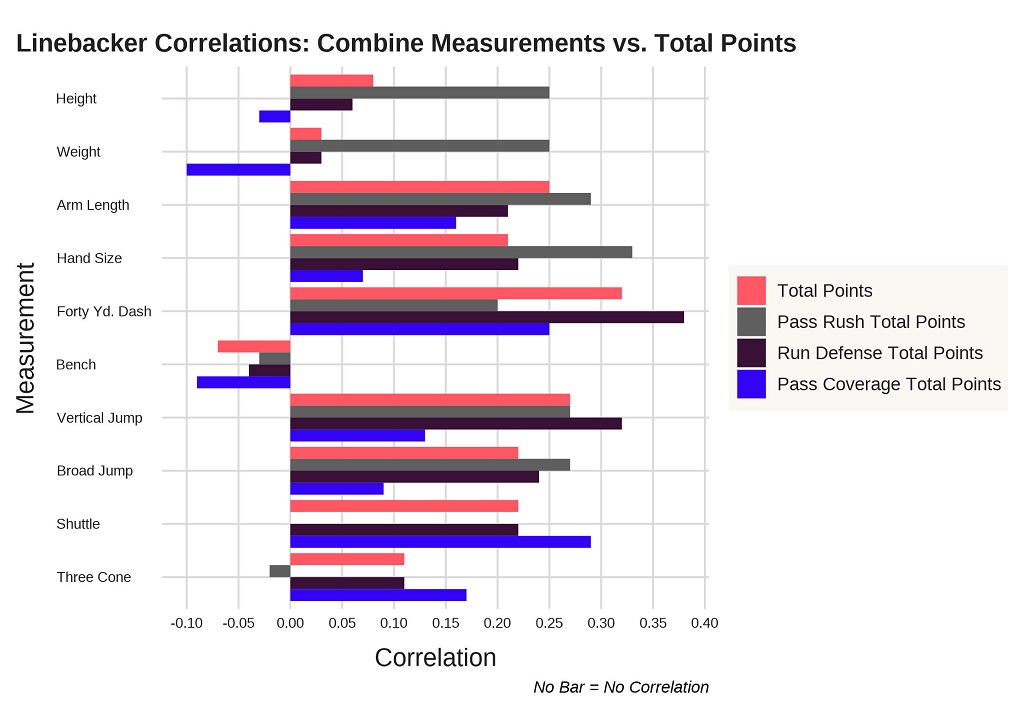
    Once again, for the linebacker position, athletic freaks tend to have the most success. All but 3 measurements reach the 0.2 correlation threshold for Pass Rush Total Points. After being significant for defensive linemen, the shuttle run and three cone times correlate to 0 and below, respectively, for linebackers. From a run defense perspective, the vertical jump and 40-yard dash times show the strongest correlations. Finally, both the 40-yard dash and shuttle runs are where the highest correlations are for linebacker pass coverage.

    Defensive Backs

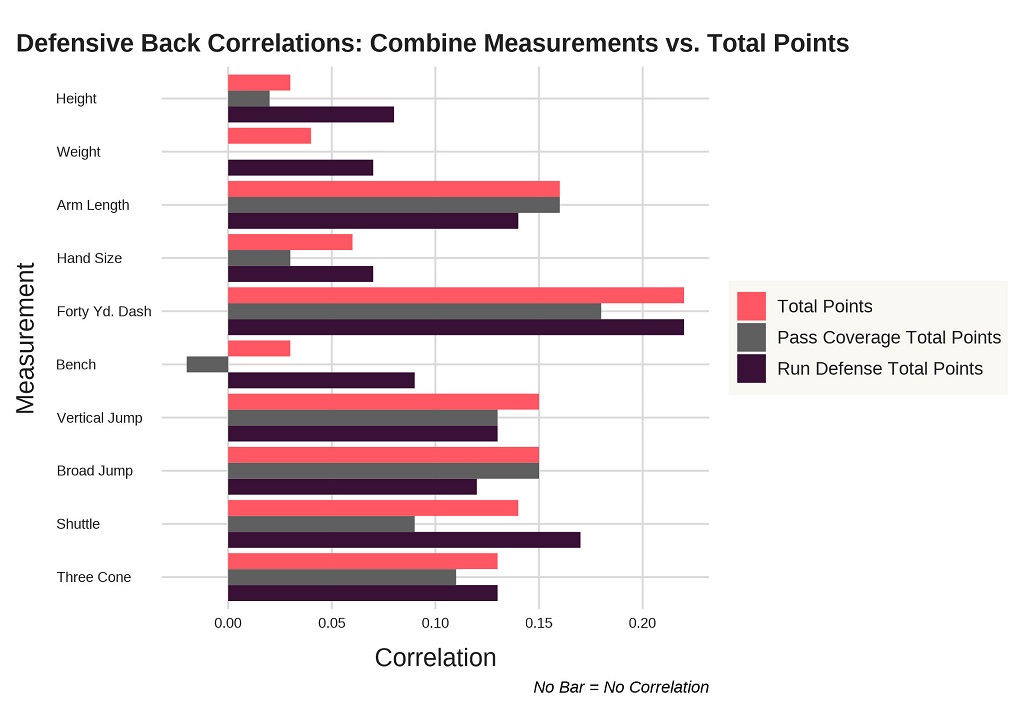
    There are no correlations for Pass Coverage Total Points that reach the 0.2 threshold for defensive backs. The 40-yard dash and arm length are the two highest correlations for Pass Coverage Total Points. On run defense, only the 40-yard dash reached the 0.2 threshold. 

    Conclusion

    Overall, there are no correlations that exceed the 0.4 threshold across any position, measurement, and Total Points category. This is consistent with the previous studies that suggest there is no strong correlation between measurements and skill sets. 

    Two measurements that seem to find themselves at the top of most positions were the vertical jump and broad jump. 

    A strong and explosive lower body tends to predict more success, generally speaking, when looking at Total Points. On defense, speed is the key, as 40-yard dash, three cone, and shuttle times were some of the highest correlated measurements for all 3 defensive skills.

    All in all, don’t be fooled by the insane numbers seen at the combine. Yes, some are more meaningful than others, but there is a lot more that factors into having success in the NFL.

  • Inside The Eagles’ Pass Rush Plan

    Inside The Eagles’ Pass Rush Plan

    The NFL passing boom of the past two decades has allowed star quarterbacks to influence their teams in a disproportionate manner. They are the most pivotal player in terms of game play, front office directive, and public image. 

    As the rules have limited what defenders can do to receivers on the outside and all but abolished the fear of going over the middle, there has been one path to disrupting the plan of the offense: Get to the quarterback. Hit him early and hit him often has long been the refrain. Joe Gibbs was thwarted by both Lawrence Taylor and the 46 defense, Tom Brady’s Super Bowl losses all came against fronts that could penetrate up the middle, and even the stupendous Patrick Mahomes has struggled against 4-man rushes that can contain him within the pocket.

    This year’s Eagles team is familiar with taking down an all-time great quarterback. Fletcher Cox and Brandon Graham may not be what they were when they defeated Tom Brady in Super Bowl LII, but they both still play a major role. With Chris Long retired and Derek Barnett on IR, Josh Sweat and Javon Hargrave more than pick up the slack. 

    One player that helps take this team from underdog to the betting favorite is second team All-Pro Haason Reddick. While his 16 sacks are tied for the second most in the league, his overall value as a pass rusher stands out: 

    • Total Points is a metric that approximates a player’s overall value contributed on each play in terms of points on the scoreboard. Reddick led the NFL in Pass Rush Total Points, as well as Total Points per pass rush. 
    • Points above Replacement (PAR) calculates a player’s value relative to what would be expected by a backup-level player at his position. Reddick’s 26 Pass Rush PAR is the most in the NFL and almost 7 points higher than Nick Bosa, who is second.

    With Andy Reid’s designs and Mahomes’ ability to capitalize on the slimmest of opportunities, the Eagles must maintain consistent pressure. Thankfully, they have one of the deepest pools of rushers in the league. In 2022 the Eagles were one of only 3 teams (Jaguars & Titans) to have 5 players with at least 26 pressures. 

    Eagles Top Pass Rushers, 2022 Season Ranks

    Total Pressures Sacks Points Saved
    Haason Reddick 14th T-2nd 1st
    Javon Hargrave 37th T-14th 67th
    Brandon Graham T-40th T-14th 21st
    Josh Sweat T-44th T-14th 39th
    Fletcher Cox T-102nd T-42ndt 48th

    While pressuring Mahomes is a must, it cannot be done by blitzing. In 2022, Mahomes’ Independent Quarterback Rating (IQR) rose from 108.5 when facing 4 rushers, to 126.1 when facing 5 or more. When looking back at Kansas City’s loss to Tampa Bay in the Super Bowl, Mahomes had an IQR of 53.9 when facing 4 rushers, as opposed to 95.8 when facing more.

    In that Super Bowl, Tampa Bay was able to give Mahomes more pressure than he had seen in the playoffs that year. The Buccaneers as a team produced a 45% pressure rate, much higher than the 30% and 32% Mahomes faced in the two games prior and they did it with 4 pass rushers having big days. 

    Shaq Barrett, Jason Pierre-Paul, Vita Vea, and current Eagle Ndamukong Suh, all had at least 5 pressures in that game. When looking at the Eagles numbers when only rushing 4 players, they show an improvement from where they rank on all pass rush plays. Any number that is highlighted green indicates a ranking that is equal to or higher than the previous table.

    Eagles Top Pass Rushers when Rushing Four, 2022 Season Ranks

    Total Pressures Sacks Points Saved
    Haason Reddick 6th 2nd 1st
    Javon Hargrave T-30th T-27th 61st
    Brandon Graham T-48th T-12th 20th
    Josh Sweat T-42nd T-12th 26th
    Fletcher Cox T-73rd T-18th 24th

    The Eagles defense has remained true to one phrase all year: “Earn the right to rush the passer.” That will need to ring true for the entire team this Sunday. They must control the game in all phases and force the Chiefs into clear passing situations. With multiple high power rushers and the positional flexibility that many of these rushers have, Philadelphia is in place to replicate the 2020 Buccaneers method of bringing pressure from multiple places without sacrificing anything on the back end. 

    The Eagles have been methodically winning the numbers all year long, and keeping 7 defenders in coverage is a key number for defeating Patrick Mahomes, which, even with a high ankle sprain, is a near-impossible task.

  • The Best Brother Pair in Football

    The Best Brother Pair in Football

    Spring Training is coming and we’ll have lots of baseball stat takes, but we’re taking a week to point out the coolest stat of Super Bowl LVII.

    On Sunday, Chiefs tight end Travis Kelce and Eagles center Jason Kelce will be the first brothers whose teams will face each other in a Super Bowl.

    Though they won’t actually take the field against each other (unless something crazy happens), they will be competing over which will make a bigger impact in the game.

    The Kelce brothers have made big impacts throughout their careers but especially during the 2022 season.

    Travis Kelce is considered one of the best the best tight ends in NFL history. He’s made eight consecutive Pro Bowls and is a four-time First Team All-Pro. He led all tight ends with 53 Total Points, our player value stat that measures everything a player does on the field.

    What made Travis Kelce so good? He’s as reliable a target as Patrick Mahomes’ has. Kelce caught 26 of 29 catchable throws from Mahomes in third-down situations and turned those into 24 first downs. His 92% first down percentage ranked second among tight ends. In the playoffs, he’s caught 21-of-26 targets in all situations, for 176 yards and three touchdowns.

    Jason Kelce is 35 years old, two years older than Travis. He’s a six-time Pro Bowl selection and a five-time First Team All-Pro. That’s not bad for a sixth-round draft pick (Travis was a third rounder).

    Kelce led all offensive linemen with 56 Total Points, which was particularly impressive given that his previous high for Total Points since we began tracking it in 2016 was 31.

    What made Jason Kelce so good? Our Video Scouts, who chart every play of every NFL game, assign blown blocks any time a blocker does not successfully block the defender they attempted to engage with and, as a result, gives the defender an opportunity to negatively affect the play. Jason Kelce had the third-lowest blown block rate in the NFL on both run plays and pass plays in 2022 (among those who played a minimum of 300 total snaps).

    He did so while ranking in the top 20 in blocking snaps for the year. No one who had a lower blown block rate was in the top 100 in blocking snaps.

    The Kelce brothers are emblematic of their respective teams in that they’re the best in the game and it will be fascinating to watch the way that they affect their team’s chance of winning on Sunday night.

  • Heart & Soul: As Played by the Eagles’ Kenny G

    Heart & Soul: As Played by the Eagles’ Kenny G

    Corey Clement means little to most fans, but he’s a football hero in the city of Philadelphia. That is because, more often than not, a team’s best player is not the one thrust into crucial moments in monumental games. This year’s Eagles team has a roster fleshed out from the stars to the practice squad. One overlooked player, in particular, is champing at the bit for his opportunity to make a play.

    Kenneth Gainwell is not a traditional player in any sense. As a running back listed at 5’9” 200 lbs, Gainwell has always punched up a class. Though his cousin, Fletcher Cox, has the ideal size for an NFL player, Gainwell admired a different Eagle growing up, Darren Sproles. After a stellar redshirt freshman year at Memphis, Gainwell received some draft buzz before deciding to opt-out of the 2020 season and prepare for the NFL draft. Even though this shocked some, Gainwell knew what he was.

    In his second year out of college, Gainwell has blossomed into a key component of the Eagles offense. He has dominated 3rd down snaps for Philadelphia throughout the season and his grasp on the role of 3rd down back has only strengthened. Since Week 14, lead back Miles Sanders has played 0 snaps in the backfield on 3rd down dropbacks.

    Eagles Running Back Usage on 3rd Downs, 2022 Season (Includes Playoffs)

    Full Season After Week 14
    Total Snaps Pass Snaps Total Snaps Pass Snaps 
    Kenny Gainwell 178  128 68 51
    Miles Sanders 55
    Boston Scott 34 17 14 8

    As a receiving option out of the backfield, Gainwell has been his reliable self. In 2022, among all running backs with at least 20 targets, he gained 5.8 yards per target, placing him 22nd. He also showed an ability to make something out of nothing, producing a Broken+Missed Tackle rate of 34.8%, good for T-10th.

    Along with earning the trust of the coaching staff and MVP candidate quarterback, Jalen Hurts, Gainwell has produced value running the ball. 

    When comparing him to all running backs with at least 50 carries in 2022, Gainwell’s numbers shine. He produced 12 Expected Points Added per 100 rushes, good for 2nd in the NFL. 

    Even better than that, his consistency has been unparalleled, with a positive play rate of 59%. That number was 11 percentage points higher than the running back that finished with the second highest rate, a gap equivalent to the gap from the 2nd highest to the 56th. 

    Gainwell doesn’t just get what’s in front of him either; he is aware of the line to gain and converted his runs into first downs 32% of the time, good for 2nd in the league among qualifiers.

    In a matchup where scoring first and ground control are crucial factors, Gainwell will help assure the Eagles offense stays in phase on early downs while fulfilling the duties of a 3rd-down back. His performance of late may not only help bring a Lombardi trophy back to Broad Street, but may also afford his fiscally-mindful organization options in the offseason. 

    Miles Sanders is a pending free agent playing on the last year of his rookie deal. Coming off a two touchdown championship game and playing behind the vaunted Eagles offensive line, Sanders has a realistic chance to win a Super Bowl MVP, which might create a market too rich for the Eagles taste. With Gainwell proven to be their 3rd down back, Philadelphia could look to the draft for its perennially deep supply of capable early down backs.

  • How the Super Bowl QBs Handle the Pocket Differently

    How the Super Bowl QBs Handle the Pocket Differently

    This matchup of Patrick Mahomes and Jalen Hurts could serve to highlight the value of special talent at quarterback, if you were inclined to make grand proclamations based on one game.

    Mahomes brings unbelievable throwing ability from all kinds of platforms, while Hurts brings physicality and athleticism. Both can extend plays with their legs (health permitting), but they make very different decisions when they do that.

    Setting a Baseline

    First off: these guys were the top two MVP candidates this year, so let’s give them credit for what they were able to do overall.

    Patrick Mahomes and Jalen Hurts Ranks in 2022

    Mahomes Hurts
    Independent QB Rating 1st 2nd
    Passing Total Points 1st 5th
    Total Points 1st 4th

    (Suffice it to say, my position is that Mahomes deserves the MVP this year).

    Mahomes is the better passer, but he should also get credit even when compared to Hurts for his rushing contributions. He was 5th in the NFL in Total Points from scrambles, barely edging out Hurts in both volume and efficiency.

    This isn’t a discussion about who the better player is overall, because I’d argue there isn’t a discussion to be had. But these guys present an interesting case study in contrasting skills and styles that each got them to the mountaintop. And when we’re looking at players’ splits, it’s important to keep in mind what baseline we’re working from.


    What Happens When Plays Get Long

    At SIS we track how long it takes for a pass play to develop into whatever it’s going to develop into (i.e. a pass, scramble, or sack). That allows us to empirically confirm the statement I made earlier about both Mahomes and Hurts being able to extend plays.

    They’re each among the top 10 highest in Snap-to-Throw +/-, which takes each passer’s times and compares them to the average for similar dropbacks. A high number means they take more time to get the ball out than you’d expect on average. (Hurts’ distribution is a little skewed because there are so many RPOs in the Eagles offense. He has a lot of quick throws that are counterbalanced by very long plays.)

    Getting the ball out quickly is a desirable thing in general, because it means you’re more likely to be staying within the play design and less likely to end up on your back. And the good news for both of these guys is that they’re 1-2 in the NFL in Total Points per play when either the pass, sack, or scramble occurs before the average time of a throw for that drop type.

    When the play extends beyond what we’d expect—typically three seconds or more—these two have different results. Hurts was seven points per 60 plays worse than Mahomes when he held onto the ball. (And while the expectation I’m using is based on when the throw should come out, I am including all dropbacks in the evaluation of what happens on those plays.)

    Total Points per 60 Plays by Dropback Time, 2022

    Faster than Expected Slower than Expected
    Mahomes 17 (2nd) 17 (2nd)
    Hurts 18 (1st) 10 (12th)

    We can look at this a little differently by breaking out the kinds of plays that result from a play taking longer than a couple seconds. Here is a breakdown of how often each of several different results come out of a Mahomes or Hurts dropback, assessed every tenth of a second. Think of it as, “After X seconds into a play, how likely is Y outcome?”

    Stacked area chart showing Patrick Mahomes' rates of five different outcomes (Clean Pass, Pressured Pass, Throwaway, Sack, Scramble) as the play progresses from 1 to 4 seconds. At all time points he is likely to make a competitive throw, and he is rarely sacked.

    So what can we learn from this?

    First off, Mahomes is getting off a competitive throw (i.e. not thrown away) just under three-quarters of the time even on plays that extend beyond four seconds. That’s pretty impressive, especially considering he ranked second in the NFL in Independent Quarterback Rating (IQR) under pressure.

    But it’s also important that he’s avoiding sacks. Remember, this plot is saying how often a given result occurs after that point in the play. So when the Sack band thins out after three seconds, that means he’s taking most of his sacks relatively early (likely because of blown blocks) and is avoiding them late in the play.

    Let’s take a look at Jalen Hurts for comparison.

    Stacked area chart showing Jalen Hurts' rates of five different outcomes (Clean Pass, Pressured Pass, Throwaway, Sack, Scramble) as the play progresses from 1 to 4 seconds. After 3.5 seconds he's roughly equally likely to produce any of the five outcomes.

    The right side of this plot looks a lot different than that of Mahomes. As discussed above, both Hurts and Mahomes are pretty consistent scramblers, although Hurts seems to duck and run a little earlier. But when the play extends towards four seconds, Hurts is taking a sack or throwing the ball away half the time, which is way more often than Mahomes. And once the play gets to four seconds or more, all five of these outcomes are similarly likely.

    The “good news” is that Hurts isn’t making throws under pressure nearly as often, which we know to be a bad proposition in general. And this year, Hurts was in the middle of the pack in terms of IQR under pressure, so he’d like to avoid those plays if possible. The trouble is that those sacks can be killers.


    How Does Mahomes’ Injury Affect This?

    Two weeks of rest should do wonders for Mahomes’ injured ankle, but if we assume he’s still a bit hampered, it stands to reason that we might expect a different look from him and the Chiefs if he’s not expected to be as effective in escaping the pass rush.

    Oddly, Mahomes has had fewer short drops, RPOs, and screens (57%) than he did in the regular season (64%), so they’re not trying to get the ball out quicker. He has been sacked just as often as well.

    He is throwing a bit less from off-platform (32%) compared to the regular season (39%), possibly a result of trying to avoid putting pressure on the ankle. Not that it matters—he has completed 20 of 23 passes for 213 yards and 3 touchdowns without his feet planted in the last two weeks. So we probably needn’t worry.

  • Who’s Up, Who’s Down Heading Into Conference Championships?

    Who’s Up, Who’s Down Heading Into Conference Championships?

    Ever since the Giants won a couple of Super Bowls earlier this century, there has been a team every few years that “gets hot at the right time” and rolls to a ring.

    While there isn’t much that can be done analytically to assess when a team will start or stop being hot, as passive observers it can be useful to know which teams are closer to their apex and which are closer to their nadir, especially when we often cite full-season stats.

    We kind of already have a sense for where teams are in that sense, though. The Chiefs are hanging on by a Patrick Mahomes ankle, the Bengals are banged up but riding high off a road win, the Eagles have gotten healthy but haven’t had to stand up to a test in quite a while, and the 49ers are doing as well as you could with a third-string quarterback.

    So, I thought I’d take a look at it from a player perspective. Which players are at their best right now? And who is at their worst?

    We can use Total Points, which captures most things a player does on the field, to evaluate how players have done in January and how that compares to the rest of the year. Because playing time can vary between months, I’ll use monthly Points Above Average, which is the underpinning of Total Points that sets average performance at zero. A player who barely plays is likely to stick close to average, while a player with a lot of playing time has the opportunity to make a bigger impact (for better or worse).

    Here are some of the players for each of the remaining four teams who have had either their best or worst month in January. They need to have played for at least 4 months to qualify.

    Eagles

    Trending upward

    A comfortable win against the Giants in the Divisional Round meant that Kenneth Gainwell got some run, totaling 112 yards on 12 carries. He achieved seven first downs on those runs. Prior to this game, Gainwell had eight first downs on 25 carries since Week 10. He was a much tougher tackle than usual, with 4 broken or missed tackles on those 12 runs. He eluded 9 tackles per 100 carries during the season.

    Kicker Jake Elliott got some good reps in thanks to a productive offense last week (5-for-5 on extra points and a made FG), and he showed himself to be far and away the most productive NFC East kicker in the playoffs this year. He is also 3-for-3 on field goals of 50+ yards in January.

    Trending down

    The players of concern for the Eagles are to some extent obvious. Both quarterback Jalen Hurts and right tackle Lane Johnson have been ailing, so a combination of missed time and less-outstanding performance puts them in this spot. Hurts didn’t need to push it once they got up big against New York, and he really hasn’t put on a show through the air since the Titans game in Week 13. Johnson looked banged up but played a full complement of snaps in the Divisional Round, and the Eagles called runs to his gap more than in any other game this year.

    49ers

    Trending upward

    The Niners are in the best spot as a team by this method of evaluation, with 10 players having their best month and 6 having their worst.

    He didn’t have a strong showing in the win against Dallas, but Christian McCaffrey was dealing prior to that bump in the road. He averaged 6.5 yards per carry in his three prior January games, with nearly a third of his rushes going for a first down.

    Safety Tashaun Gipson nabbed three of his five interceptions (and had his hands on what might have been another) in the last two weeks of the regular season. He’s generally playing deep safety, so if you’re hearing his name it’s most likely very good or very bad. In the last month it’s been more the former.

    Trending downward

    Other players in the San Francisco secondary have not been as fortunate with their recent playmaking. Breakout safety Talanoa Hufanga—for whom I have a particular affinity because he was all over the leaderboards of the SIS Football Rookie Handbook when he came out of USC—has been all over the field making plays, but less so of late. 

    Talanoa Hufanga Stats, 2022

    September-December

    (15 games)

    January (4 games)
    Interceptions 4 0
    Tackles for Loss 5 0
    Pressures 10 (2 sacks) 2 (0 sacks)

    Cornerback Charvarius Ward has handled being the team’s top corner well, yielding a team high in targets with pretty good results on those targets. In the last month he has allowed more successful plays, particularly against the Seahawks in the Wild Card round when he was targeted eight times for a total of 98 yards and a touchdown. A matchup with DK Metcalf was a problem in that game, and a matchup with another Ole Miss product in A.J. Brown awaits.

    Chiefs

    Trending upward

    The Kansas City skill position group has had different contributors every few weeks (behind Travis Kelce), and at this point in the year Isiah Pacheco and Kadarius Toney are top dogs.

    Pacheco has taken the lion’s share of the carries this year, with an explosive run against the Jaguars providing a highlight in the most recent contest. This month he’s produced more first downs and been stuffed less than a third of the rate he was prior, which is a level of consistent productivity that is all this offense needs.

    Over the last three games Toney is second on the team in basically every measure of total productivity you can think of. He’s been very efficient, with a league-leading Yards per Route Run and an EPA per target that ranks in the top 10.

    Trending downward

    I’m sure it doesn’t shock you that Patrick Mahomes shows up here, based on his injury. But even before that, he had posted three of his five below-average games by Points Above Average this season since Week 14. If we assume he’ll be throwing from a stable platform more often than usual this game, it’s worth noting that in January he ranks outside the top 10 in Independent Quarterback Rating with his feet planted. He was second by that measure in the first 16 weeks of the season.

    One player who might be doing more scrambling than Mahomes is linebacker Nick Bolton, who has been targeted in coverage more than any non-cornerback in January. He has allowed a 100% Deserved Catch Rate in that span, which measures the catch rate a player allows on catchable throws and treats dropped passes as though they were completions. 

    Bengals

    Trending upward

    Cincinnati’s secondary has done better than expected in the absence of the injured Chidobe Awuzie, with most recent contributions to that effort coming from cornerbacks Cam Taylor-Britt and Mike Hilton. Each is among the 10 best defenders in terms of EPA per Target in January (minimum 10 targets), with Hilton manning the slot and Taylor-Britt on the outside. A large part of their value has come from allowing completions on just 1-of-8 targets between them on third and fourth down.

    Trending downward

    Another injury-related entry on this list comes in the form of Tee Higgins, who suffered a hip injury in Week 18 and has had below-average games since. He was always the 1b to Ja’Marr Chase’s 1a, but in the last two games Chase has him nearly doubled in targets and more than doubled in yards.

    Linebacker Logan Wilson has felt success slip through his fingers of late. He’s allowing ballcarriers to elude his tackle attempts more than twice as often in January as he had through December, and multiple passes that he could have intercepted have fallen for incompletions.