Sports Info Solutions
Tag: Injuries
-
No Worse For Wear: The Best at Taking HBPs Like a Champ
By
Analyzing which batters can take their base without much issue.
-
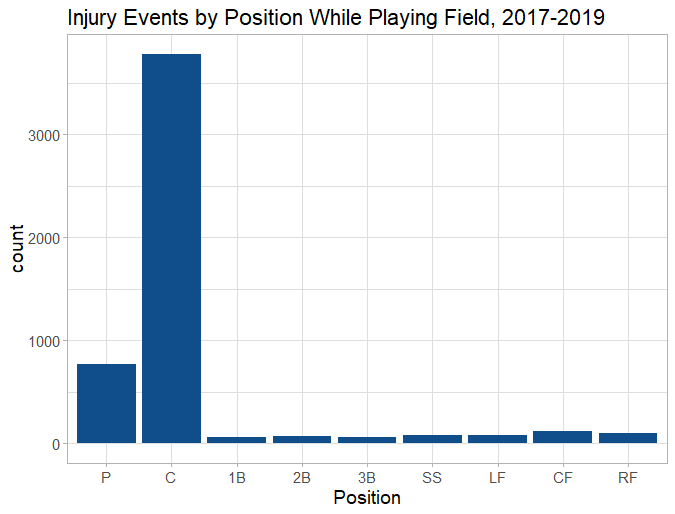
On Catcher Injury Risk and Managerial Decision-Making
By
Managers often avoid using backup catchers out of fear of injury. But how often do catchers actually get hurt?