Sports Info Solutions
Tag: Plate Discipline
-
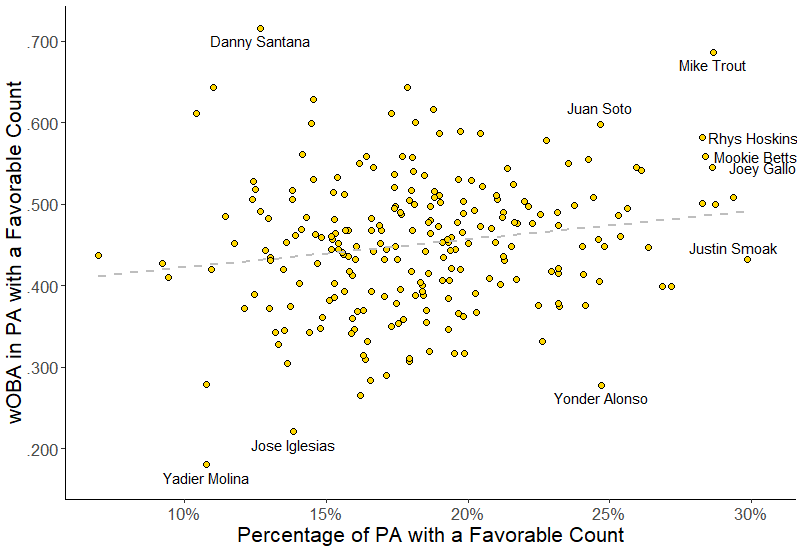
Which hitters reach favorable counts?
By
Which hitters get into favorable counts, like 2-0, 3-0, and 3-1? And which hitters then do damage?
-
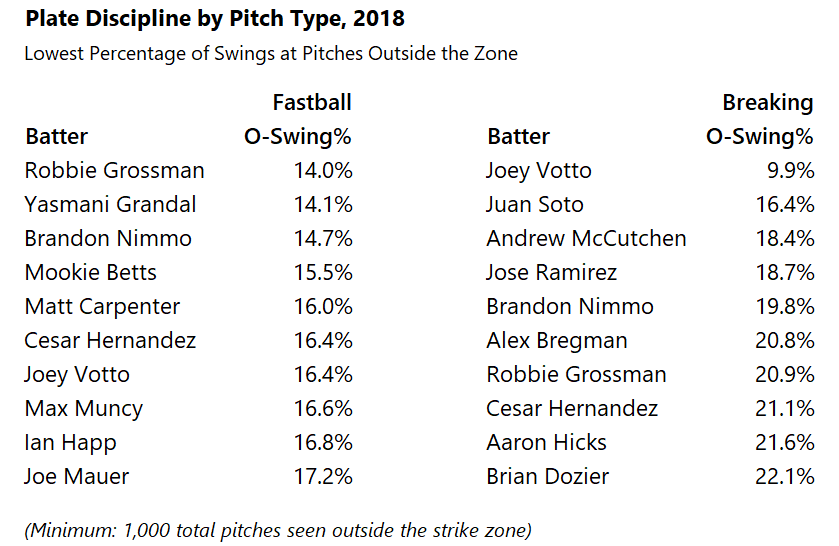
Breaking Down Plate Discipline by Pitch Type
By
Is Joey Votto’s greatness evident against both fastballs and breaking balls? Who else is that good?
-
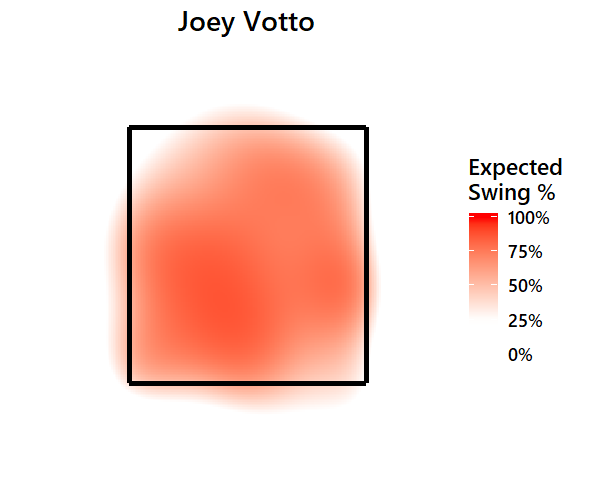
Visualizing Plate Discipline
By
We can put a number on plate discipline. But what does it look like? Where are hitters taking their swings, and how far do they extend their zones?