For those who are new to our draft site, we wanted to give a quick overview of how we do things and how we do things differently from other places online.
You’re the GM
Our whole ethos when preparing the draft site is to make the user feel like they’re in the war room. We present a variety of information about the available players, and we don’t make assumptions about relative positional value or specific team needs.
Scouting 🤝 Analytics
We don’t subscribe to the idea that there is a conflict between using the eye test or statistics to evaluate players. Both are integral parts of team-building and decision making. So each player’s page has a detailed scouting report and a deep dive into their analytical profile.

Our Scouting Process
Our team structure is a lot like an NFL franchise’s. We have scouts trained to understand our grading system and key positional factors via our Scout School over the course of the fall, and they concurrently watch film on hundreds of prospects through the following spring. The player pool evolves as the season progresses, adding pop-up players and removing underclassmen who return to school.
We have cross-checkers review, synthesize, and finalize reports so they’re in ship shape when they go up on the site. We also hold rankings summits to finalize our Big Board once we have all the player grades in place.
Grading Scale
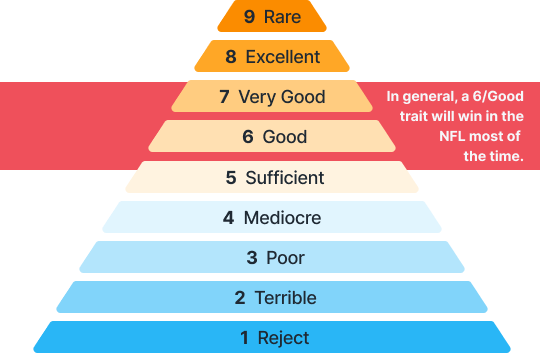
Our grades (for both traits and overall) are on a scale from 1 to 9, oriented towards NFL players. These grades are projections as to what a player will look like by their second NFL season.
This scale corresponds to these terms:
Trait Grades
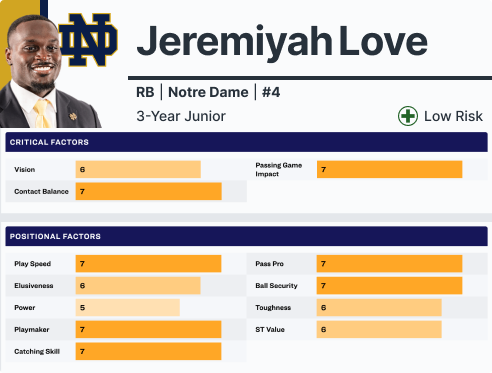
We grade each player by two sets of traits: Critical Factors and Positional Factors.
Each position has three Critical Factors that drive success more than the others. For example, a quarterback’s are Accuracy, Decision Making, and Clutchness.
There are also Positional Factors that fill out our trait-based evaluation. For example, a quarterback’s are Short Accuracy, Deep Accuracy, Pocket Awareness, Footwork, Under Pressure, Mobility, Arm Strength, Release, Awkward Throw, Eye Discipline, Leadership, and Body Composition.
Here’s an example of a running back breakdown.
Overall Grades
Each player is given an overall grade that is also on a scale from 1 to 9, but these are given decimal values that represent specific types of roles that we project the player to attain.
For example, here is the scale for quarterbacks:
| 9.0-7.0 | High-End 3-down Starter |
| 6.9-6.7 | Solid Starting QB |
| 6.6-6.5 | Lower-End Starting QB |
| 6.4 | Starter traits with limited opportunity |
| 6.3 | Circumstantial Starter |
| 6.2 | Good Quality Backup |
| 6.1-6.0 | Developmental Player |
| 5.9 | Career #2 |
| 5.8 | Eventual #2 |
| 5.7 | #3 QB |
| 5.6-5.5 | N/A |
| 5.4 | Priority FA – Solid Camp |
And for comparison, here is the scale for running backs:
| 9.0-7.0 | High-End 3-down Starter |
| 6.9-6.7 | Solid Starter (All 3 Downs) |
| 6.6-6.5 | Lower-End Starter (1st & 2nd Downs) |
| 6.4 | Role-Playing Starter (3rd Down) |
| 6.3 | N/A |
| 6.2 | High-End 3-down Backup (COP) |
| 6.1-6.0 | Developmental Player |
| 5.9 | Backup 1st & 2nd Down / Backup 3rd Down |
| 5.8 | N/A |
| 5.7 | N/A |
| 5.6-5.5 | #3 RB |
| 5.4 | Priority FA – Solid Camp |
You can see the full set of grading scales on our Glossary page.
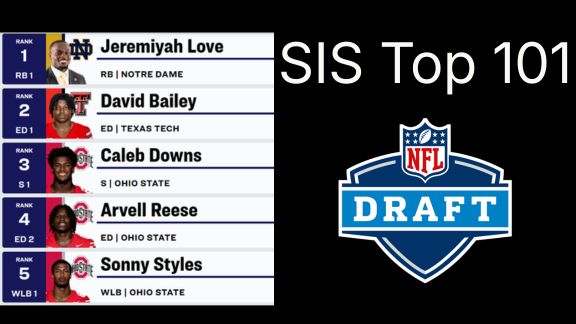
Role-Based Grading and the Horizontal Draft Board
Most NFL teams think not in terms of rounds (e.g. “second-round wide receiver”) but in terms of roles (e.g. “true #3 receiver with inside/outside flexibility”). This avoids the problem of having to align scouts on the relative value of positions or any notion of team need, and is therefore more consistent from year to year and team to team.
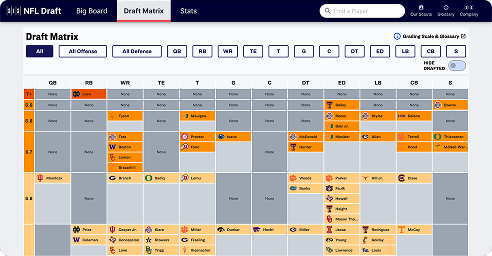
With a role-based system, it doesn’t make as much sense to just have a linear draft board. For that reason, we have what’s called a horizontal draft board, which you can find on the Matrix page on the SIS Draft Site. This shows all positions in one view in wide format, with the best graded players at each position at the top. A view like this allows you to easily see where the pockets of talent are at each position, and does not force a comparison between positions.
Of course, on draft day you need to make a single choice among players at different positions, but the horizontal draft board will not make that decision for you.
Statistical Breakdowns
We have all your basic stats, but there is also a ton here that you won’t find anywhere else. Examples include Snap-to-Throw Plus-Minus for quarterbacks, On-Target Catch Rate for receivers, True Pressure Rate for pass rushers, and Adjusted Tackle Depth Plus for linebackers.
We also have several ways of looking at Total Points, which is our total player value metric that uses charting data to estimate the value of each player in terms of points on the scoreboard. Total Points Rating is a per-play version of that metric that’s on a 50-99 scale for ease of use.
Compare all players’ platform seasons on the Stats tab, which features everyone in one view. Or you can look at a player’s progression over his career on his player page.
We also have curated our favorite metrics for each position into the Overview section on each player page, with percentiles and ranks represented.
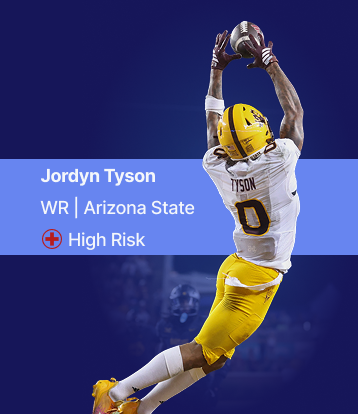
Injury Risk Designations
Our injury staff has watched every injury event in these players’ careers. Taking into account that history and the player’s projected role, each player is given an injury risk designation: Low, Moderate, or High. These won’t necessarily affect our grades, but players with elevated risk merit different consideration than their peers.