Author: mattducondi

  • The Strike Zone and the Umpires That Control It

    The Strike Zone and the Umpires That Control It

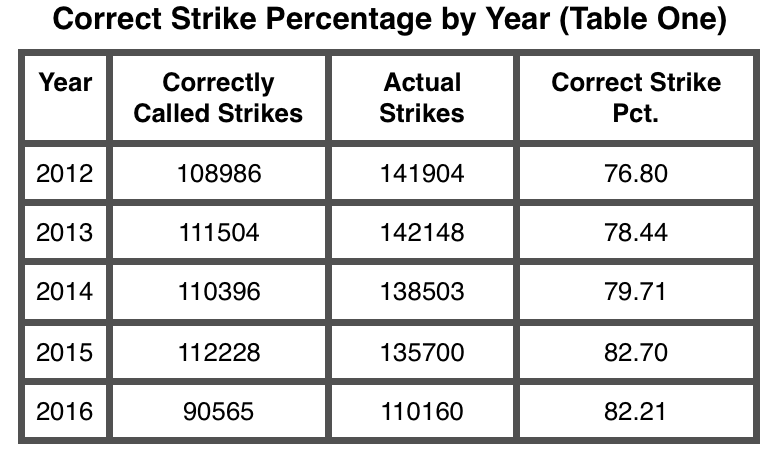
    Introduction 

    One of the most discussed issues in Major League Baseball is the consistency of the strike zone. The Rule Book strike zone states “The STRIKE ZONE is that area over home plate the upper limit of which is a horizontal line at the midpoint between the top of the shoulders and the top of the uniform pants, and the lower level is a line at the hollow beneath the kneecap. The Strike Zone shall be determined from the batter’s stance as the batter is prepared to swing at a pitched ball.” After watching games throughout the regular season and playoffs, it is easy to realize this is not the strike zone that is called. Each umpire has tendencies and dictates his own strike zone and how he will call a game. With the rise of PITCHf/x and Trackman in the last few years, umpires have been increasingly monitored and judged for their accuracy and impartiality. For this reason, umpires are criticized for incorrect calls more than ever before and I believe are now trending towards enforcing the Rule Book strike zone more than in years past.

    The purpose of this research will be to do two things. First, I will focus on identifying overarching themes where I look at finding how umpires are adjusting to modern  technology but also how the Rule Book strike zone is not the strike zone we know. After this, I will dive into a few umpire-specific tendencies. The latter would be helpful to teams in preparing their advance reports by knowing how certain umpires call “their” strike zone dictated by situations in a game.

    Analysis

    Using PITCHf/x downloaded through Baseball Savant, I have looked at major league umpires since 2012 in regards to their accuracy in correctly labelling pitches, primarily strikes, and their tendencies dictated by specific situations. While the height of the strike zone is often influenced by the height of the batter, there are other factors to take into account such as the how the batter readies himself to swing at a pitch. Unfortunately, the information publicly available to conduct this research does not include the batter handedness, pitcher name, or measurements of individual strike zone limits. For this reason, a stagnant strike zone serves our needs best. The height of the strike zone shall be known as 1.5 feet from the ground to 3.6 feet from the ground. This is the given strike zone of a batter while using the pitchRx package through RStudio when individual batter height is not included. All PITCHf/x data is from the Catcher/Umpire perspective, having negative horizontal location to the left and positive to the right. The width of home plate is 17 inches, 8.5 inches to both sides where the middle of the plate represents 0 inches. After calculating the average diameter of a baseball at 2.91 inches, we add this to the width of the plate. Therefore our strike zone width will be 17 + 5.82, or 22.82 inches. The limits we will then set are going to be -.951 to .951 feet (or 11.41/12 inches). Throughout the paper I will be referring to pitches that fall within the boundaries of our zone as “Actual Strikes” and pitches correctly identified as strikes within this zone as “Correctly Called Strikes.”

    Called Strike Accuracy By Year

    As Table 1 shows, correctly identifying strikes that fall in the parameters of the Rule Book strike zone has risen substantially. While 2015 has a higher percentage of correctly called strikes, 2016 PITCHf/x data from Baseball Savant was incomplete with 28 days worth of games unavailable at the time of this research. A rise of 5.90 percent correctly called strikes from 2012 to 2015 shows the Rule Book strike zone is being more strictly enforced.

    Table 1
    table-one

    While this provides some information, we can also look into where strikes are correctly being called using binned zones. Understanding that the evolution of umpires over the last 5 years is taking place and trending towards correctly identifying strikes more today than in years past, we can analyze where in the strike zone, strikes have been correctly labeled.

    Called Strike Accuracy by Pitch Location

    In Table 2, we can see a tendency amongst umpires. Strikes are called strikes more routinely over the middle of the plate and to the left (from umpire perspective). As I have mentioned before, the publicly available PITCHf/x data I used did not include batter handedness and I am unable to determine who is receiving the benefit or disadvantage of these calls. Presumably from previous research on the subject, lefties are having the away strike called more than their right handed counterparts, explaining the separation between correctly identifying strikes in zones 11 and 13 versus 12 and 14.

    Binned Strike Zone
    binned-strike-zone

    Table 2
    table-two

    While one may argue that there should not be strikes in these bordering zones, we consider any pitch that crosses any portion of the plate a strike. Due to our zone including the diameter of the baseball on both sides of the plate, the outer portion of the plate includes pitches where the majority of the ball is located in one of these zones.

    Called Strike Accuracy by Individual Umpire

    When gauging an umpires ability to correctly identify a Rule Book strike, an 85.67% success rate sets the mark with Bill Miller, while Tim Tschida ranks at the bottom of this list, only calling 71.57% correctly. We can infer from Tables Three and Four along with Table One, that while umpires are calling strikes within the strike zone more often, they are still missing over 17% of these pitches. It is important to note that this information does not take into account incorrectly identifying pitches outside the Rule Book strike zone as strikes, which when considering an umpire’s overall accuracy, should absolutely be taken into account.

    Table 3
    table-three

    Table 4
    table-four

    Called Strike and Ball Accuracy by Count

    One of the most influential factors in whether a taken pitch is called a strike or a ball is the count of the at bat. We have all seen pitches in a 3-0 count substantially off of the plate called a strike, just as we have seen 0-2 pitches over the plate ruled balls. Table Five shows the correct percentage of strikes and balls by pitch count. While this shows that umpires are overwhelmingly more accurate at identifying strikes as strikes in a 3-0 count (91.06%) as compared to an 0-2 count (56.66%), we must acknowledge this only paints part of the picture. Umpires are conversely most likely to correctly labels balls in 0-2 (98.73%) counts and misidentify balls in 3-0 (90.32%) counts. I included their accuracy of correctly identifying both strikes and balls here as opposed to throughout the entire paper because we can clearly tell through this information that umpires are giving hitters the benefit of the doubt over pitchers. Umpires are far more likely overall to correctly identify a ball than a strike, as evidenced by the fact that there are no counts during which umpires correctly call less than 90% of balls.

    Table 5
    table-five

    The data in Table Five is corroborated by the visualizations in Figure One and Figure Two. These visualizations of the strike zone include pitches off of the plate and we can see that in a 3-0 count, a more substantial portion of the Rule Book strike zone is called strikes while also incorrectly identifying balls as strikes. While in a 0-2 count, a smaller shaded area of the Rule Book strike zone works with our findings that less strikes are identified correctly but more balls are correctly called.

    Figure 1 and Figure 2
    figure-one-and-two

    Called Strike Accuracy by Pitch Type

    The next area I looked at was whether pitch type significantly altered the accuracy of umpires. In order to do this, I grouped all variations of fastballs into “Fastball” and all other pitches into “Offspeed”, while omitting pitch outs and intentional balls. I was able to see how umpires fared in correctly identifying strikes by pitch type in Table Six.

    Table 6
    table-six

    Not surprisingly, we see Bill Miller near the top of the list with both Offspeed and Fastball accuracy. For umpires as a whole, the difference in accuracy between the two is not large (79.05% Offspeed accuracy vs. 78.91% Fastball strike accuracy). On the other hand, what may come as a surprise is the fact that eight of the top ten highest accuracies were for Offspeed pitches.

    Called Strike Accuracy for Home and Away

    One of the most mentioned tendencies of referees or umpires in any sport is home team favoritism. Whether a foul or no foul call in basketball, in or out of bounds call in football, or a strike or ball ruling in baseball, many think that the home team receives more of an advantage than their visiting counterparts. Looking at top and bottom half of innings, away and home team respectively, we can identify trends and favoritism in major league umpire strike zones.

    While a difference of .62% accuracy may seem like a lot, especially in a sample size of over 650,000 total pitches, we can look at this on a game by game level to see the actual discrepancies. For simplicity’s sake, we can assume 162 games a season, making for roughly 11780 games played in our data set (this subtracts all games from the unavailable 2016 data). This leaves us with 23.03 Correctly Called Strikes out of 29.05 Actual Strikes for away teams per game, meaning that 6.02 strikes were not called. As for home teams, we have 22.04 Correctly Called Strikes a game with 28.02 as the Actual Strikes, averaging 5.98 missed strikes a game. By this measurement we can see that more hitter leniency was given to the away team than the home team.

    During this time frame, while a higher percentage of strikes were judged correctly, hitters were given more leniency as the away team than the home team on a game-by-game basis.

    Table 7
    table-seven

    Called Strike Likeliness in Specific Game Situation

    Included in Table Eight are the three most and least likely umpires to call any non-fastball a strike below the vertical midpoint of our zone. I split the strike zone at 2.55 vertical feet and looked at any pitch (not necessarily within the zone) below that height. Here, we are not judging an umpires accuracy of correctly identifying pitches but rather looking at where a certain umpire may call specific pitches. We can see that Doug Eddings is 5.34% more likely to call a strike on a non-fastball as compared to Carlos Torres.

    While this does not paint the entire picture, we are able to see how their tendencies can play an important role in the game. Information like this may be valuable to a team in deciding how to pitch a specific batter, which reliever to bring into a game, or factor into being more patient or aggressive while at the plate.

    Table 8
    table-eight

    Conclusion

    External pressures and increased standards are undoubtable effects on umpire strike zones. As evidenced throughout this paper, strike zones are called smaller than the Rule Book strike zone specifies. And while umpires are trending towards correctly identifying strikes, situations such as count and pitch type can affect their judgment.

    While the system in place is not 100%, we must understand that these umpires are judging the fastest and most visually deceptive pitches in the world and are the best at what they do. Major League Baseball must use modern technology to their advantage and provide the best training for umpires to achieve the goal of calling the Rule Book strike zone. Another option, while more drastic and difficult to implement, may include adapting the definition of the Rule Book strike zone, something that has not been changed since 1996.

  • Shifting To A New Era of Baseball

    Shifting has become increasingly common in baseball and companies like Baseball Info Solutions (BIS) are at the forefront for bringing this information to light. Shifts are employed strategically by placing infielders in positions where batters have dictated with previous performance that they are more likely to hit ground balls and short line drives (GSL). In just 7 seasons, the number of shifts on balls in play in the Major Leagues has skyrocketed from 2,463 in 2010 to a prorated estimate of nearly 30,000 in 2016.

    Various shift types exist, including but not limited to, Full and Partial Ted Williams where there are 3 infielders on one side of second base or 2 displaced infielders, respectively, as well as Situational shifting. Situational shifts, which accounts for All-In, Corners In, and others are dictated more by the situation in the game than by the batter. While looking deeper into the rise of shifts in Major League Baseball, we will not be counting Situational shifts because they can inaccurately label a batter.

    Among the team leaders this year in shifts on balls in play are the Houston Astros, Tampa Bay Rays, and most surprisingly the Seattle Mariners. The Astros and Rays are widely known for their use of analytics in their decision processes and team makeup, each having finished 2015 with 400 more shifts (1417 and 1465, respectively) than the 3rd place team (the Colorado Rockies with 1010). On the other hand, the Mariners, under a new front office regime, have already surpassed their 2015 total of 352 shifts and are on pace for over 1700 in 2016.

    One thing that really jumps out are the 2011 Philadelphia Phillies. The Phillies, known as one of the last teams to embrace the analytical side of baseball, shifted a total of 6 times in 2011. To put that into perspective, as of May 27th 2016, the Houston Astros (baseball’s leading shifters), are averaging just around 12 shifts PER GAME.

    While shifts are aggressively growing, the types of players that are being shifted are expanding as well. In 2010, it was seldom found that someone would be shifted unless they were a left-handed, power-centric batter. Certain names come to mind such as Ryan Howard and David Ortiz, as these names represent the 2 most shifted batters in 2010, both by totals and the percentage of their plate appearances. Howard was shifted in 85.8 percent of his 555 plate appearances (PAs) with video in 2010, while Ortiz was just a tick behind him with 85.3 percent of his 556 similar PA’s.

    While left-handed batters are still shifted more often, righties are being shifted exponentially more today than in the past. When looking at players with at least 50 PAs in 2016, 14 batters (all left-handed) have seen shifts in over 90 percent of their PAs, while Giancarlo Stanton takes the cake for the right-handed bats with shifts in 73.5 percent. Even just 6 seasons ago, no one could fathom that a right-handed bat would be shifted as often as Stanton. In 2010, Marcus Thames led right-handers with a 2.5 percent PA shifted rate having seen 6 shifts in his 237 PAs, with Dioner Navarro taking second at a measly 1.5 percent.

    Not only was I surprised to see the percentage rates throughout the 6 seasons but I was even more shocked to see splits. In 2010, 95 different batters were shifted, only 29 of which were right-handed. Since then the disparity has diminished, and to my surprise, every year since 2013, there have been more righties shifted than lefties. In 2010, lefties were shifted 2.3 times as much as righties compared to 2016 where the number currently stands at 0.8, a number that represents the 201 (L) to the 266 (R) shifted split.

    The table below shows a year-by-year breakdown of the splits between handedness of the batters and their shifted PA percentage for those hitters.

    [googleapps domain=”docs” dir=”spreadsheets/d/1T-Z537PV1PpnBWFazaAAQqBNXMPcqC0vb8kyexjtet0/pubhtml” query=”widget=true&headers=false” width=”500″ height=”250″ /]
    (Note that these numbers represent all shifts, not just on balls in play)

    As you can see, the amount of players shifted is growing greatly and the percentage of PAs that these batters are shifted in is much larger than even 2010. And so the big question is “do shifts work?” and the resounding answer is “YES, YES, YES!” Shifts have significantly affected both the batting averages of players as well as their approaches, which is another subject entirely. Of the 95 players from 2010 to 2015 that were shifted at least 50 times on GSL, only 23 had a higher batting average against the shift. The highest of this was Josh Donaldson, who batted 20 points higher against the shift, and only 4 of the 23 players hit 10 points higher. Considering this same group, the overall numbers point directly to batters faring much worse against the shift, hitting roughly .243 against the shift and .259 against no shift.

    While baseball purists contend that the shift needs to be abolished, it has become an undeniable part of the game and appears to be staying. One can wonder what we will see from shifts in the future, but only time will tell.


  • Money Driven

    Major League Baseball teams are more invested in their players today than ever before. In 2015, player salaries jumped to an all-time high of over $3.5 billion, a raise north of $320 million (and over 10 percent) from 2014 alone. And now that they give out contracts of upwards of $30 million a year, teams are more protective of their starting pitchers today than in the past. That has led to fewer complete games and more innings limits.

    Focusing on the last 31 seasons, from 1985 to 2015, I looked to see how drastic this trend has become. I also limited the study to pitchers with at least five starts and no more than two relief appearances to limit it to full-time starters. The below graph illustrates the declining length of starts year by year for our specified group of pitchers.

    https://mattducondi.files.wordpress.com/2016/06/year-v-innings-pitched-per-start-1985-2015.png?w=900

    As you can see, the average length of a start was roughly 6 2/3 innings pitched per game started in 1985. Last year, the average length of a start was down to a tick above 6 innings, which is an all-time low. That trend does not necessarily indicate that teams are relying on their starters less and less. It’s possible that an increase in offense could have created the trend with pitchers needing more pitches per inning, leading to a shorter average start. However, a look at the change in ERA by season, a proxy for offensive change, suggests otherwise.

    https://mattducondi.files.wordpress.com/2016/06/era-v-year-1985-2015.png?w=900

    This graph highlights the steroid era, likely peaking in 2000 with a 4.61 ERA. However, recent seasons show cooling offenses. In 2014, the 3.57 league ERA was the lowest since 1989. As such, the decreasing average length of starts must reflect a change in how teams use starters as opposed to a change in the context of their use.

    When you combine the decreasing length of starts with the dramatic increase in player salaries, the average price per inning pitched has skyrocketed over the last three decades.

    https://mattducondi.files.wordpress.com/2016/06/salaryip.png?w=900

    In 1985, Major League teams paid just under $3,000 per inning in each game started. In 2015, that number was nearly $50,000 per inning. And while there may be factors other than the increasing salaries of pitchers such as the rise in Tommy John surgeries and teams’ increasing reliance on analytics, the offensive environment does not seem to be one of them. Or…maybe offense is on the rise?

    https://mattducondi.files.wordpress.com/2016/06/giphy.gif?w=900