Sports Info Solutions
Category: College Football
-
Using the Football Rookie Handbook to rate the Draft
By
The Titans and Ravens fared well. Others did not. Here’s a comprehensive look.
-
NFL Draft: Best of the Rest
By
There are a few players who fell just outside the range of evaluation in our Football Rookie Handbook, but who bring something positive to the table.
-
A closer look at Iowa’s star tight ends
By
TJ Hockenson is more well-rounded, but both are top caliber.
-
Two Highly Rated Prospects Have Seen Their Draft Stock Take a Hit: Here’s Why
By
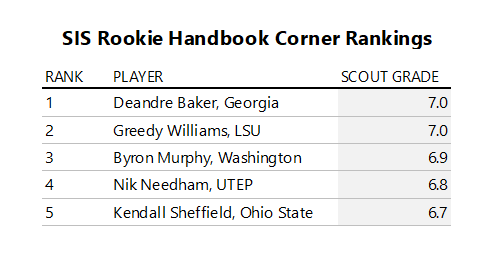
Greedy Williams and N’Keal Harry have seen their stock take a hit leading up to the draft. We try and figure out why:
-
And Then There Were Three: a Statistical Comparison of Haskins, Lock, and Jones
By
The combine is a distant memory, pro days are all but over, and it seems all that’s left to do is twiddle our thumbs as teams make their final preparations for the NFL Draft. But, arguing amongst ourselves about quarterbacks is a rich tradition, so perhaps that is the best way to occupy our time…
-
A statistical comparison of Outland winners Quinnen Williams and Ed Oliver
By
Both can make a good case, but one fared better in the advanced metrics
-
A statistical comparison of Outland winners Quinnen Williams and Ed Oliver
By
The advanced metrics seem to favor Williams. We take a closer look.
-
Preview: Alabama vs. Clemson, College Football National Championship
By
Looking for a number that’s important to tonight’s game? You’ve come to the right place.
-
Stat of the Week: A Statistical View of the College Football Playoff Field
By
The College Football Playoff field is set: the semifinal games on December 29 will feature No. 1 Alabama against No. 4 Oklahoma, and No. 2 Clemson against No. 3 Notre Dame. All four teams have had interesting storylines at quarterback, while also dominating in other facets of the game. Using Sports Info Solutions’ advanced metrics…
-
The most interesting numbers from the NFL Draft
By
By KEEGAN ABDOO It was a fascinating and exciting NFL Draft, with twists, turns and plenty of interesting selections. What numbers were most telling to us about some of the top players selected? On Cleveland Browns QB Baker Mayfield Baker Mayfield ranked first with a Passing Success Rate of 61% (out of 113 FBS Quarterbacks…