Sports Info Solutions
Category: NFL
-
Preview: AFC Divisional Round – Chargers vs. Patriots
By
On Austin Ekeler’s tackle breaking, the Patriots use of their RBs and much more
-
On Nick Foles’ now-annual resurgence
By
The Eagles and their QB face a tough task — the Bears pass defense matches up well with them.
-
2018 NFL Total Points Leaders
By
Which players were truly the most valuable at their respective positions this season?
-
What to do on 2nd-and-10? Let’s look at the numbers
By
A closer examination of whether teams should run or pass in this situation.
-
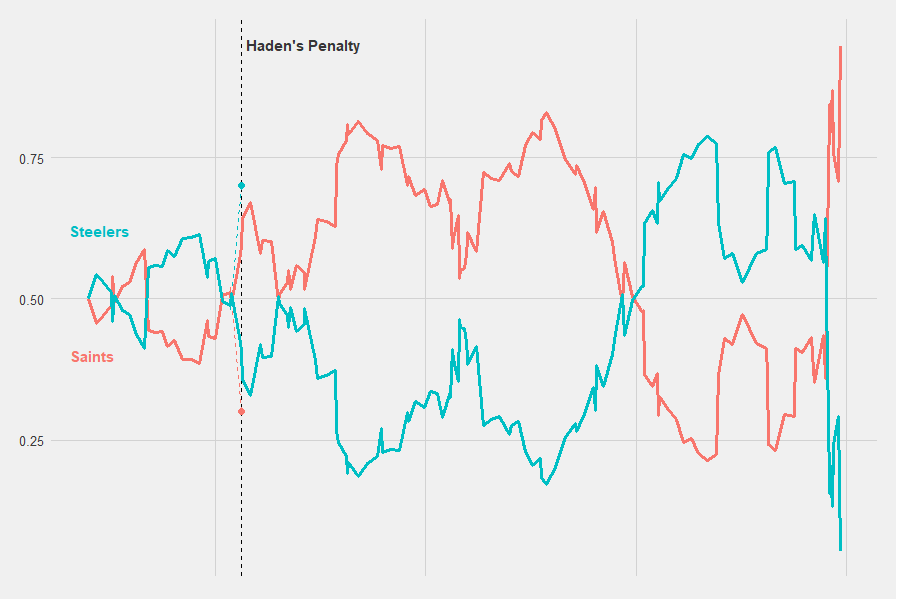
Couple of questionable calls played a role in shaping AFC Playoff picture
By
The Steelers came up a little short in their playoff pursuit. A couple calls not going their way hurt a lot.
-
Zach Ertz: Hoping for a bounceback
By
Zach Ertz is in the midst of a rough stretch, but this might be the week he comes up big.
-
JuJu Smith-Schuster may have met his match in Stephon Gilmore
By
Stephon Gilmore’s numbers vs No. 2 receivers make him a challenge for anyone to face
-
Dak Prescott, Amari Cooper face challenge with Colts’ zone
By
By PATRICK ROWLEY The Cowboys trading for Amari Cooper has turned their season around. Following their Week 8 bye Dallas was looking up at both the Redskins (5-2) and Eagles (4-4) in the standings. Since acquiring Amari Cooper, the Cowboys have gone 5-1 and are currently on a five game win streak, the longest current…
-
Who have been the best pass defenders in 2018?
By
Who are the top players at defending against the pass in 2018? Let’s look at that specifically through pass coverage (rather than the pass rush) We will use the player’s ranking in our Total Points stat as the basis for judgment. What is Total Points? Total Points takes the Expected Points stat and distributes the…
-