There are many avenues to pursue when building an NBA championship-level roster, but drafting well will always serve as a key component for solving this puzzle. Just ask the Oklahoma City Thunder, who could not have captured the Larry O’Brien trophy a year ago without striking oil in multiple drafts prior.
Even for teams that were constructed primarily through free agency and trades like the reigning champion New York Knicks, the draft remains a vital tool, as they could not have traded for OG Anunoby without having drafted RJ Barrett and Immanuel Quickley.
Hitting in the draft is far from a guarantee however, as the NBA Draft has proven to be an incredibly hit-or-miss exercise throughout its history. For every Anthony Edwards, there is a James Wiseman.
We sought to find some predictiveness by identifying the types of players who succeed at the NBA level and checking how the current class fits into those characterizations. To do this, we employed our multi-faceted draft prospect evaluation framework that covers the last 17 Drafts, including this current class.
Summary
- Highest hit rate are top two way wings with high basketball IQ.
- In general, the top cluster in each position also had the highest basketball IQ.
- Prospects that we are higher on than consensus: Labaron Philon and Zuby Ejiofor.
- Defensive impact tended to be more significant for bigs.
- Offensive impact was more important for ball-handlers, particularly advantage creation and passing.
Methodology
We split by position (ball-handler, wing, big) and applied hierarchical clustering on 1,192 prospects tracked from drafts 2010 to 2026 to separate them into groups based on maximum similarity.
For the cluster analysis, the feature set included age, height, weight, and a myriad of metrics, such as on-ball advantage creation and off-ball defense, that were calculated using our charting data. The number of clusters was determined using the silhouette method, and after three rounds it resulted in eight groups for each position for a total of 24 clusters.
For the sake of simplicity, clusters were described on a relative scale from worst to best for both offense and defense. The scale is as follows: worst, weak, mediocre, average, solid, strong, and best.
Success in the NBA was defined as a player who, in their first four seasons in the league, posted a Player Efficiency Rating (PER) of at least 15 and/or achieved an award or high enough placement* in at least one of those seasons.
Beyond the desire to identify good players, including awards served two additional purposes.
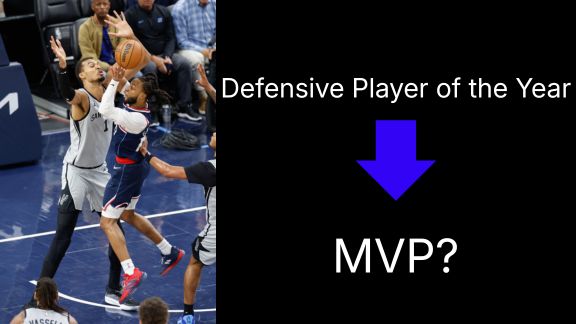
First, PER struggles to fully credit defensive impact, so including the defensive award assisted in covering blind spots. Second, using the Rookie of the Year placement helped offset the lack of a full four-year track record for draft classes from 2023 onward. This did come with the potential downside of overrating weaker draft classes but was a tradeoff we were willing to live with.
* Top 10 in MVP, Top 5 in Defensive Player of the Year, Top 5 in Rookie of the Year, Most Improved Player, All-Star, All-NBA, All-Defense
Results
Here are the “hit rates” across positions and overall:
| Position | Hit Rate | Players |
| Big | 22% | 359 |
| Ball-handler | 20% | 365 |
| Wing | 16% | 468 |
| All | 19% | 1192 |
Anecdotally, 20-25% of a draft class on average could be expected to have successful NBA careers, in line with our observation that 19% of all prospects charted were deemed to have become successful basketball players during their first four years in the league. By position, bigs had the highest hit rate at 22%, followed by ball-handlers at 20%, and lastly wings at 16%.
Bigs
(scroll across slightly to see the full table)
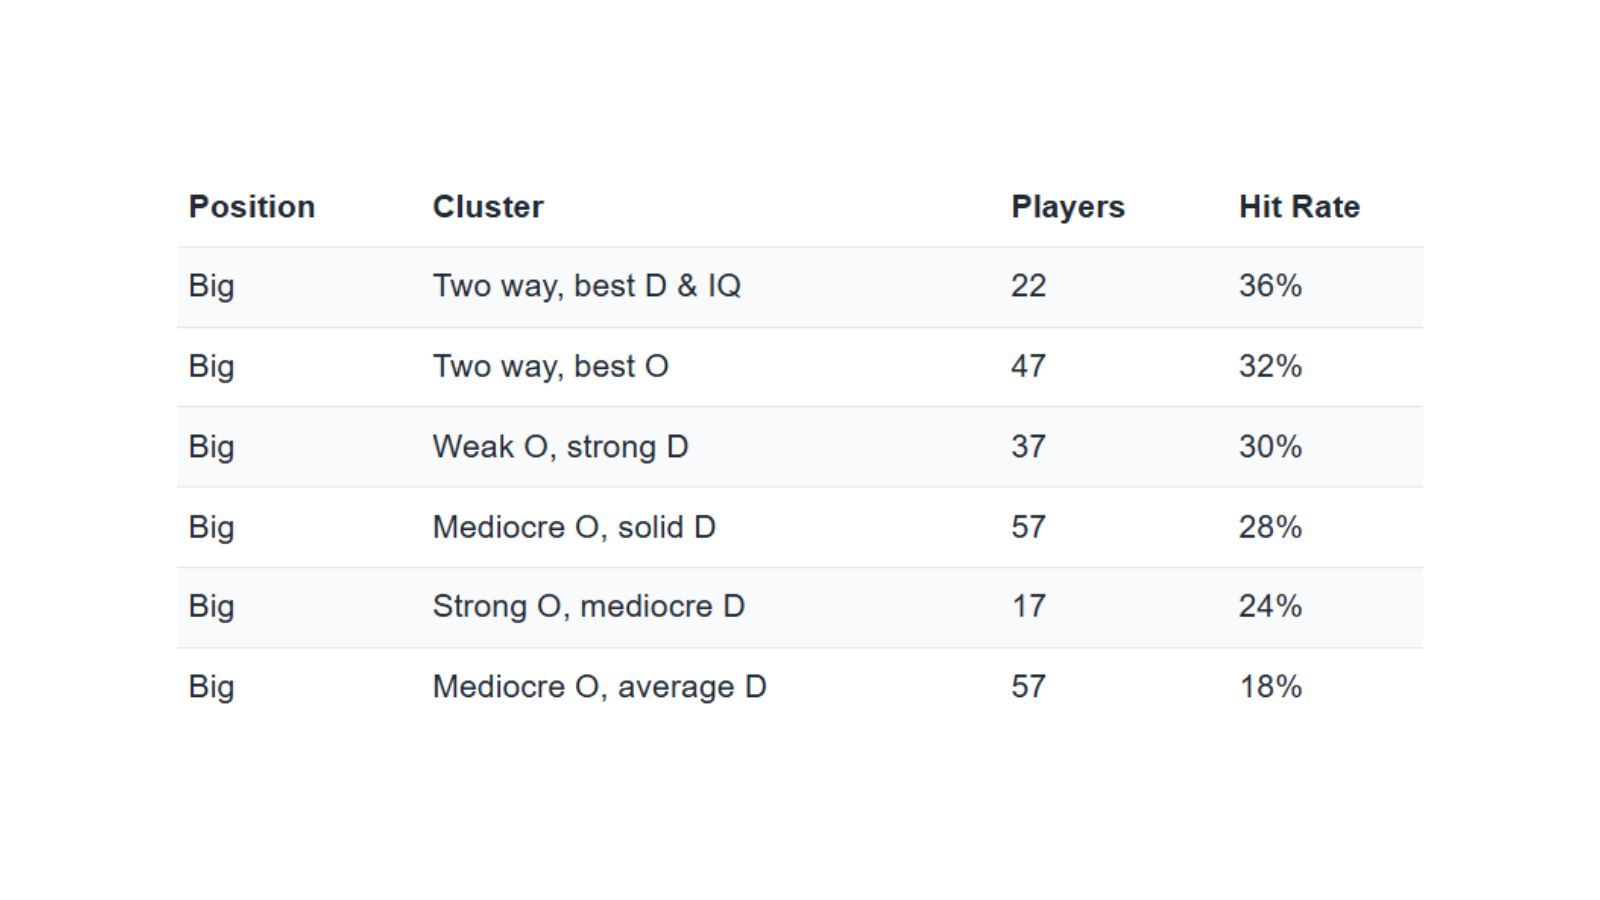
| Cluster | Hit Rate | Players |
| Two way, best D & IQ | 36% | 22 |
| Two way, best O | 32% | 47 |
| Weak O, strong D | 30% | 37 |
| Mediocre O, solid D | 28% | 57 |
| Strong O, mediocre D | 24% | 17 |
| Mediocre O, average D | 18% | 57 |
| Worst D, worst total impact | 13% | 54 |
| Worst O, weak total impact | 12% | 68 |
| All | 22% | 359 |
Taking a deeper look at the bigs, the clusters that measured well in both defensive and offensive winning impact (basically net positive/negative plays made on offense or defense as determined by our framework) boasted the highest hit rates at 36% and 32%.
Headliners in this group include top picks such as Joel Embiid and Karl-Anthony Towns, as well as second-round heists such as Nikola Jokic and Draymond Green.
Several prospects in this draft have been classified into these elite tiers. This includes projected top-four picks Cameron Boozer and Caleb Wilson, alongside Aday Mara, Yaxel Lendeborg, Joshua Jefferson, and Zuby Ejiofor.
Ejiofor, who is widely projected as a late first-rounder, is a particularly intriguing name to watch; he has emerged as the favorite sleeper of this year’s draft for Jack Klein, a senior analyst on our Basketball Operations team.
Conversely, bigs who rated poorly on both ends of the floor yielded the lowest historical hit rates. While this lower tier group has produced higher-end outcomes like Lauri Markkanen and Julius Randle, it also includes top picks who struggled to meet expectations, such as Marquese Chriss, Marvin Bagley, and Anthony Bennett. This year, only two prospects – Chris Cenac Jr. and Trevon Brazile – fall into this cluster.
Our Operations team profiles Cenac Jr. as a premier athlete with great measurables whose draft stock is weighed down by a limited offensive game, while Brazile projects as a solid second-round talent capable of blocking shots and hitting threes, albeit with a high level of volatility on both ends of the floor.
Overall, for bigs, defensive impact seemed to trend linearly with hit rate and be more significant than offense when trying to predict future success.
Ball-handlers
| Cluster | Hit Rate | Players |
| Strong two way primary, best IQ | 36% | 11 |
| Strong O primary, average D | 36% | 50 |
| Best O, weak D, best passing | 36% | 25 |
| Two way, best D | 29% | 31 |
| Solid O, average D | 17% | 63 |
| Solid O, worst D | 17% | 36 |
| Average O, solid D | 12% | 83 |
| Worst O, weak D | 9% | 66 |
| All | 20% | 365 |
Moving on to ball-handlers, we see that three clusters are tied for the highest hit rate at 36%. The common denominators across these three are elite advantage creation, passing, and offensive winning impact.
Notable members of these clusters who would be selected much earlier in a redraft include Tyrese Haliburton (pick 12), Fred VanVleet (undrafted), and incumbent NBA champion Jalen Brunson (pick 33). In this year’s class, Alabama’s Labaron Philon is the lone prospect to land in this group.
On big boards, Philon is consistently ranked below his fellow playmaking contemporaries, but our Operations team is significantly higher on Philon than the consensus, as he took a massive developmental leap this past season and cemented himself as an excellent offensive creator.
This year’s class features a remarkably deep group of high-level guard prospects, making the long-term evaluation of how these players stack up against each other one of the most fascinating storylines to monitor as their NBA careers unfold.
On the other end, the cluster rated the worst on offense on average sported the worst hit rate at 9%. Overall, for ball-handlers, future success mirrored the rise in offensive proficiency, unlike big men, whose projections were more tied to defense.
Several prospects this year reside in this cluster, most notably Arizona’s Brayden Burries, a projected top-10 pick. While consensus evaluation frames Burries as a high-floor combo guard with stout defensive upside, our tracking suggests certain aspects of his profile may be overstated. His film and data showcase a limited capacity for high-level half-court creation, paired with defensive metrics that lag behind his public reputation.
Landing in this group is by no means a death knell however, with the most notable alumnus of this cluster being Devin Booker, a combo guard himself who has been named to multiple All-NBA and All-Star teams.
Wings
| Cluster | Hit Rate | Players |
| Best both ways, best IQ | 45% | 38 |
| Weak O, strong D, best phy. tools | 30% | 37 |
| Mediocre O, solid D | 21% | 53 |
| Solid across board, total impact | 12% | 69 |
| Weak across the board | 11% | 95 |
| Average O, mediocre D | 10% | 86 |
| Solid O, worst D | 9% | 54 |
| Worst total impact | 6% | 36 |
| All | 16% | 468 |
Last but not least are the wings, where the most successful cluster by far was characterized by elite two-way winning impact paired with high basketball IQ, which for our purposes is defined as a metric that evaluates off-ball defensive execution, passing manipulation, off-ball offensive ingenuity, and shot selection.
Recent standout prospects Cooper Flagg, VJ Edgecombe, and Kon Knueppel all reside in this group. Other notable players who have significantly outperformed their original draft slots include Klay Thompson (pick 11) and Trey Murphy III (pick 17).
Interestingly, physical tools also seemed to be a more prominent indicator of success for wings in particular. Pascal Siakam (pick 27), Toumani Camara (pick 52), and Paul George (pick 10) are just some of many players in this cluster who have delivered exceptionally high return on investment.
No prospects in this year’s class were classified as part of either of these clusters. However, Carter Bryant from last year’s class is a part of the physical tools group, and while he did not qualify as a hit in his inaugural season, he remains a highly promising talent with a bright future ahead, made apparent by his glimpses of high-level play during the Spurs’ deep run.
In a bit of an unexpected twist, the cluster that measured decently well across all metrics could only muster a hit rate of 12%. High end outcomes still exist, most famously Jimmy Butler, meaning all is not lost for Connecticut’s Alex Karaban, the lone prospect from the current class to land in this group.
Our Operations team profiles Karaban as a late-first or early-second-round value. He projects as a prototypical winning player on both ends who consistently makes the right decision on the floor and possesses a reliable shot.
Conclusion
When conducting evaluation exercises of this scale, there is always room for further research.
Future considerations could include tuning weights in the cluster analysis, removing garbage time and reducing the impact of empty stats accumulated on tanking teams, as well as incorporating pick numbers to increase the success threshold the higher the pick is.
Ultimately, this study demonstrates that our data can forecast future success, as evidenced by our winning impact metrics scaling proportionally with real-world outcomes, and can serve as another resource to cut through the noise and identify prospects whose consensus value is either too low or too high.
* 2026 NBA Prospect Clusters – highlighted are players who have decided to pull their names out of the draft.