Sports Info Solutions
Author: Alex Vigderman
-
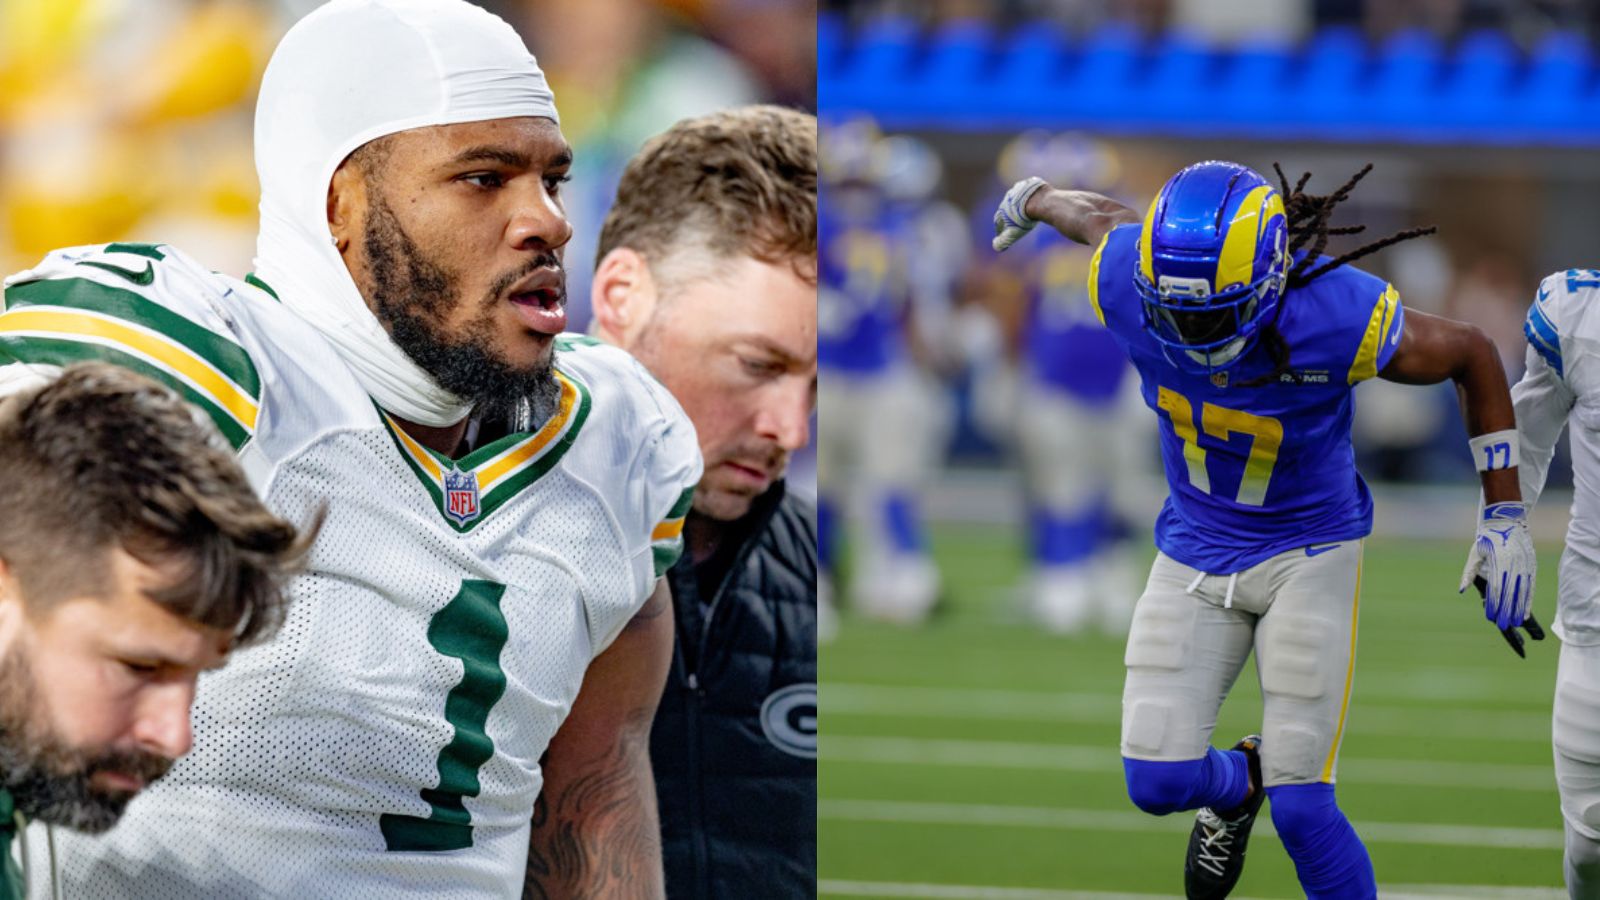
What To Expect From Davante Adams and Micah Parsons Coming Off Their Injuries
By
It’s probably going to take them a little while to be as effective as they once were.
-
Which NFL Teams Were Most and Least Affected by Injuries in 2025
By
The teams that have been least impacted … they’re doing pretty well right now.
-
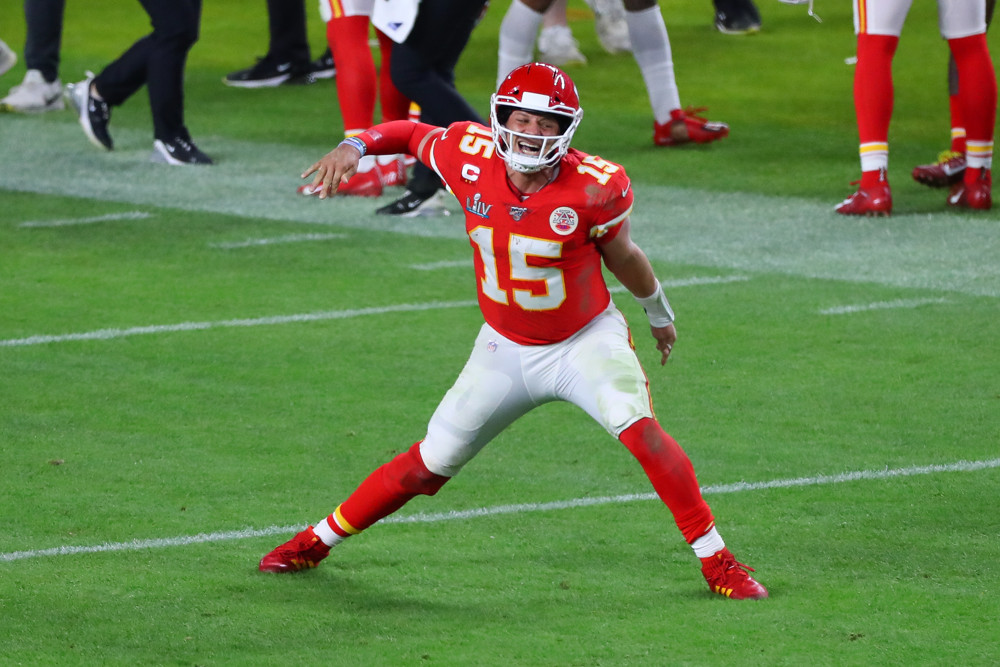
Patrick Mahomes Is Still The King Of Clutch (Despite the Bills Loss)
By
When combining our Total Points player-evaluation stat with a leverage index, Mahomes sits atop the list of clutch QBs
-
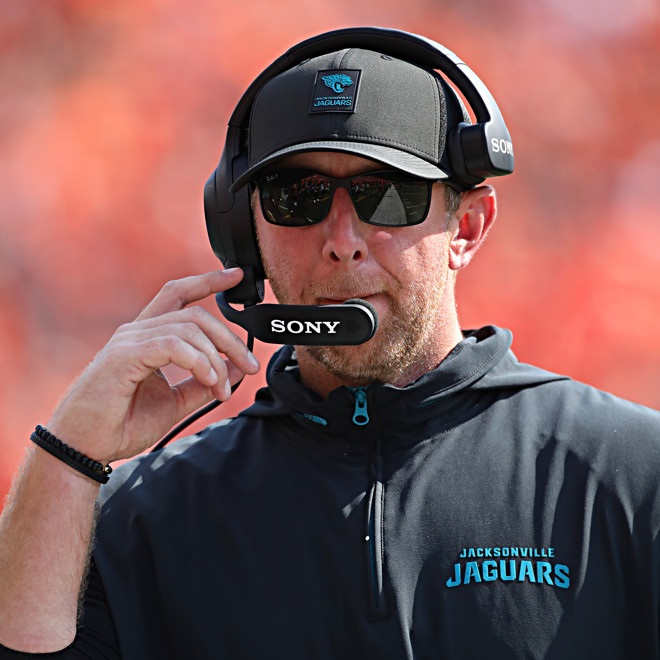
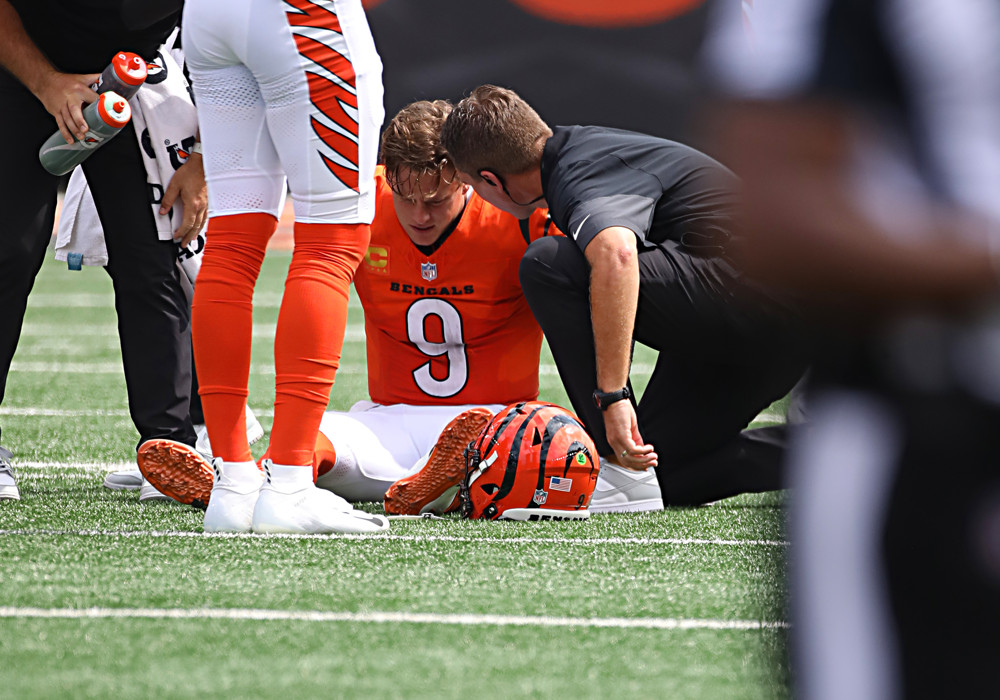
What Liam Coen Means When He Says It’s 100% A Go
By
The Jaguars seemed to pull defeat from the jaws of victory against the Bengals on Sunday, enough so that head coach Liam Coen had to answer for a particular fourth down play late in the game. With just under 4 minutes left and a 3-point lead, they chose to go for a 4th-and-5 from the…
-
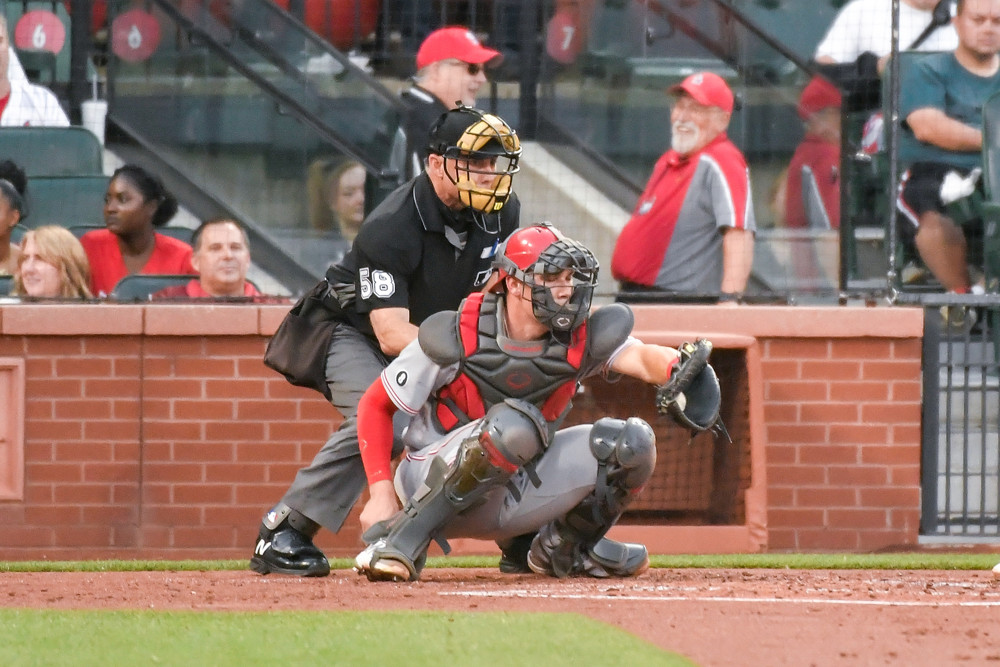
Lessons from a Decade of Strike Zone Runs Saved
By
Who are the top catchers at getting extra strikes, who are the top teams at producing them, and what can we glean about hitters, pitchers, and umpires?
-
Future First Round Pick Trades Are Back In The NFL Draft!
By
Teams are more willing to trade next year’s first round pick than they should be, so we lay out a framework for how to evaluate whether such a deal makes sense.
-
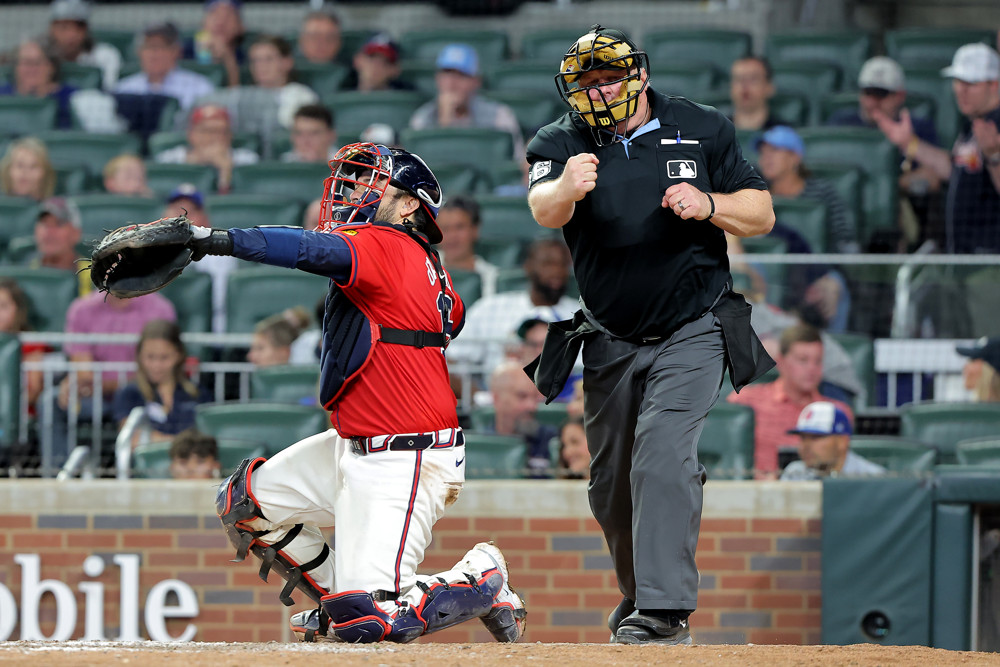
Stat of the Week: 10 Seasons Of Strike Zone Runs Saved Part II
By
Last week we looked back at 10 seasons of data for our pitch-framing stat, Strike Zone Runs Saved, which puts a run value on the result of taken pitches, and we looked at which catchers have fared best and worst in those measurements. One of the neat things about Strike Zone Runs Saved (SZRS) is…
-
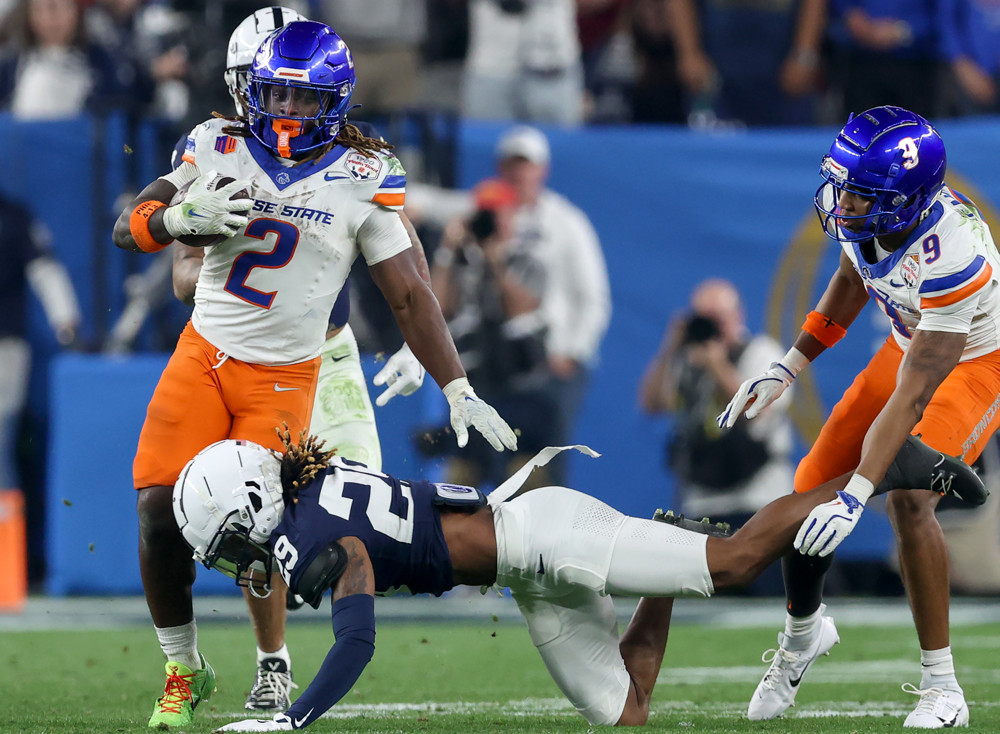
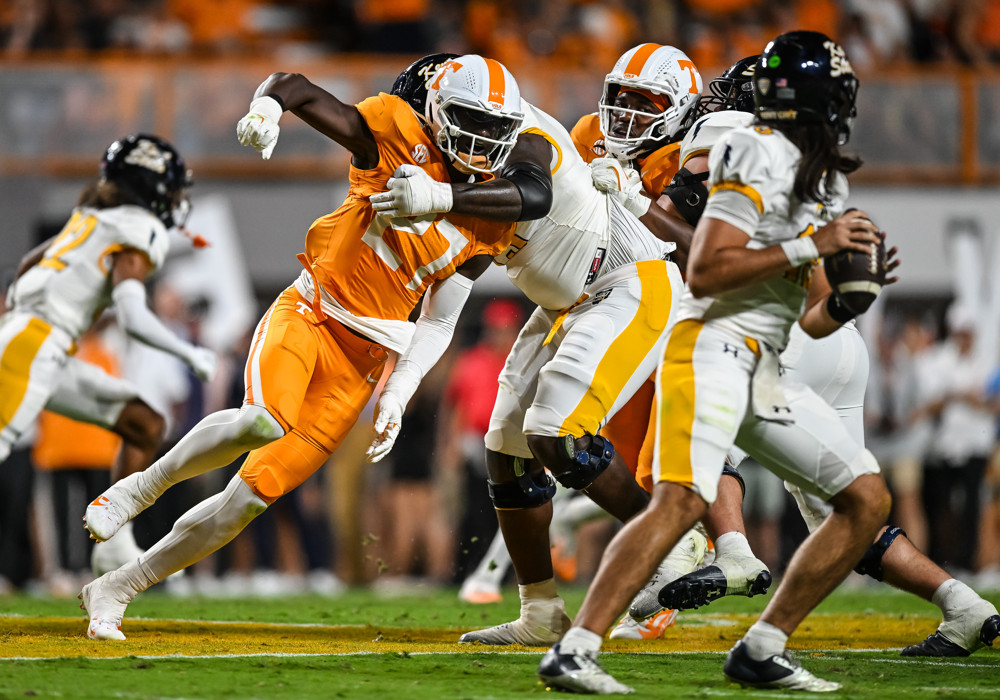
Analyzing Ashton Jeanty’s Eye-Popping & Head-Scratching Stats
By
“I’m here to offer just a little dab, a splash, of cold water based on how others with his rushing profile have performed at the next level.”
-
Stat of the Week: The Last 10 Years of Strike Zone Runs Saved
By
How far has pitch framing come and who have the best catchers been?
-
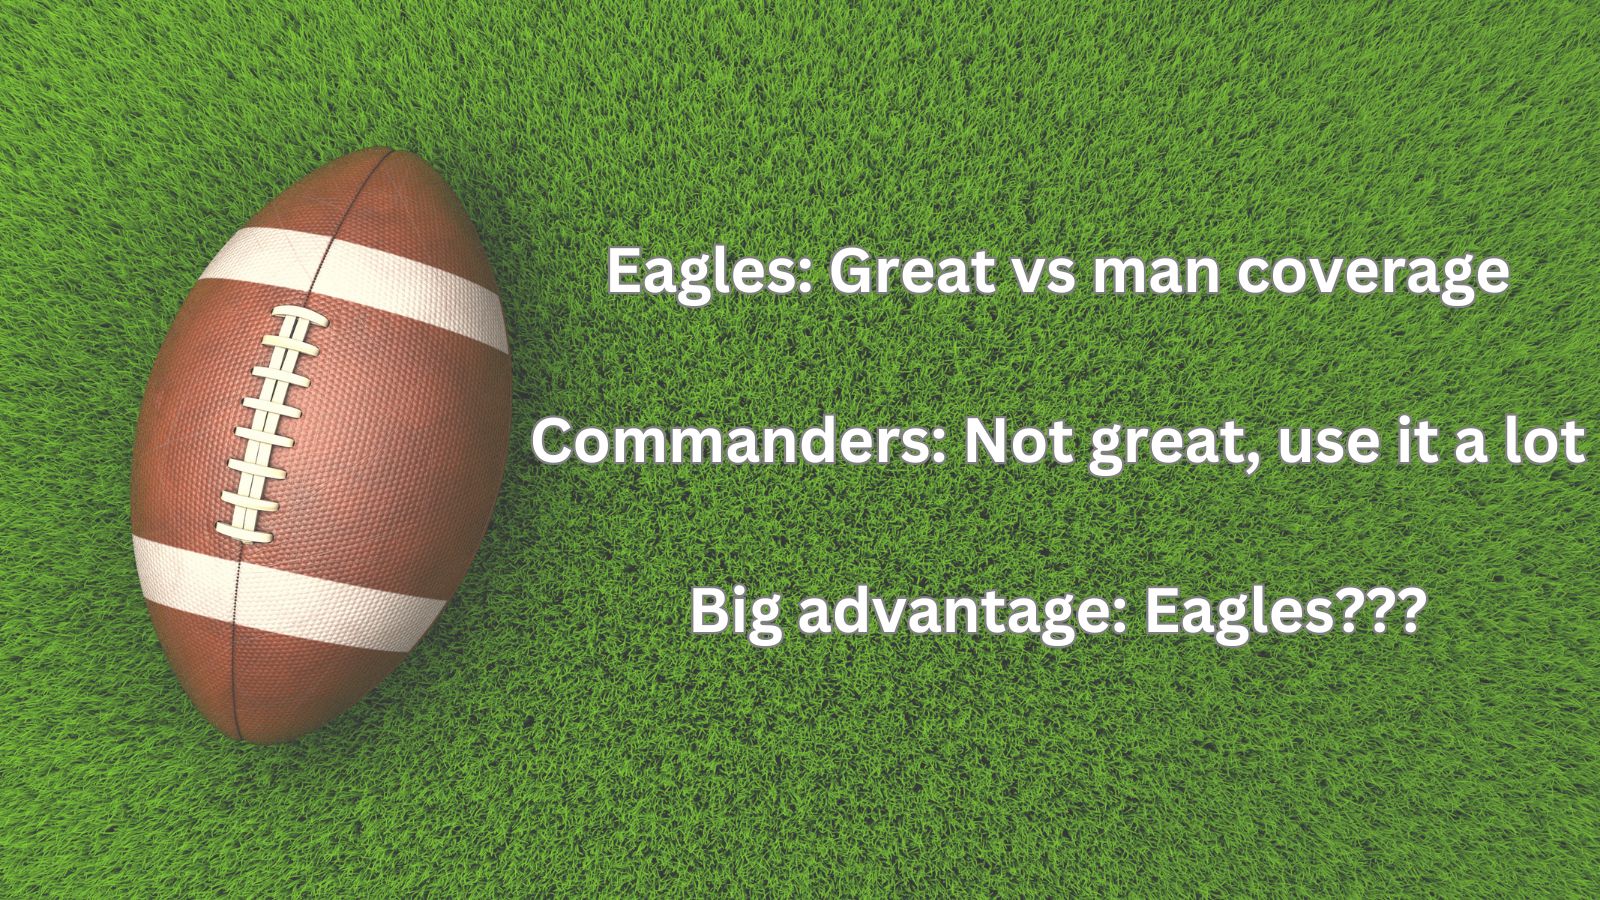
What Two Statistical Mismatches Tell Us About Football Analysis
By
The Eagles offense has some big advantages over the Commanders defense. But in the greater picture, do mismatches like this mean anything?