Sports Info Solutions
Author: James Weaver
-
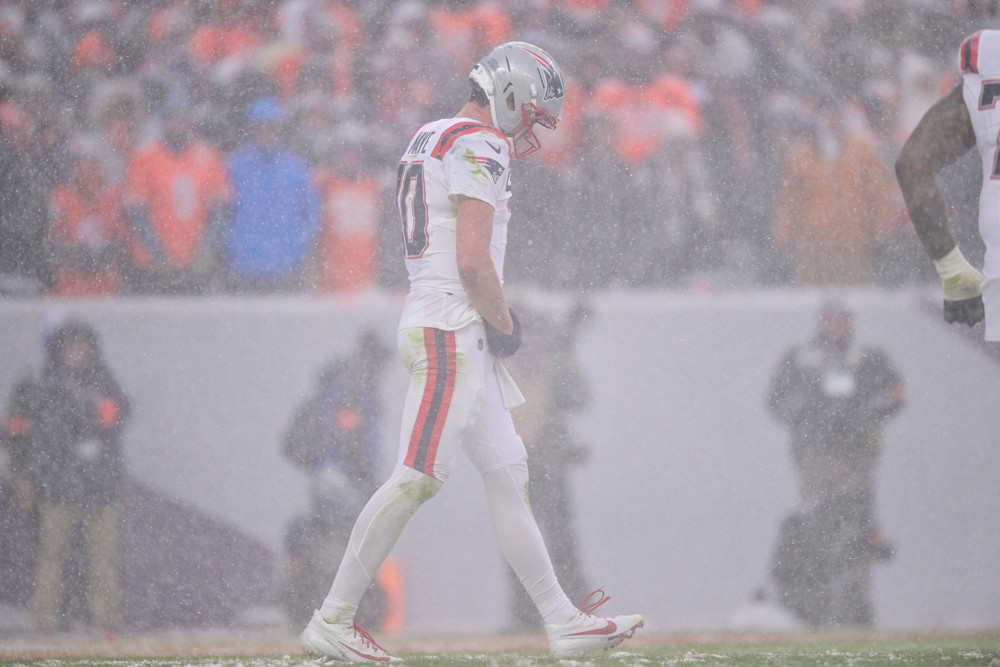
What Happened To The Patriots Aerial Attack?
By
Playing against the Chargers, Texans, and Broncos defenses can make a QB look pretty pedestrian.
-
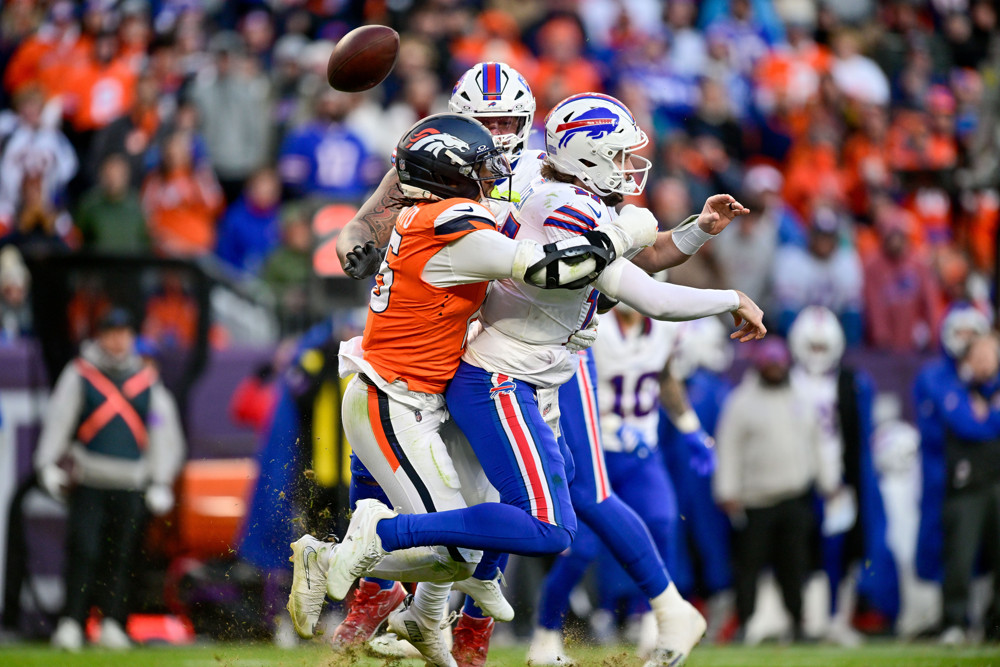
Just How Great Is This Denver Broncos Pass Rush?
By
Our take is that they’re historically good … and here’s why.
-
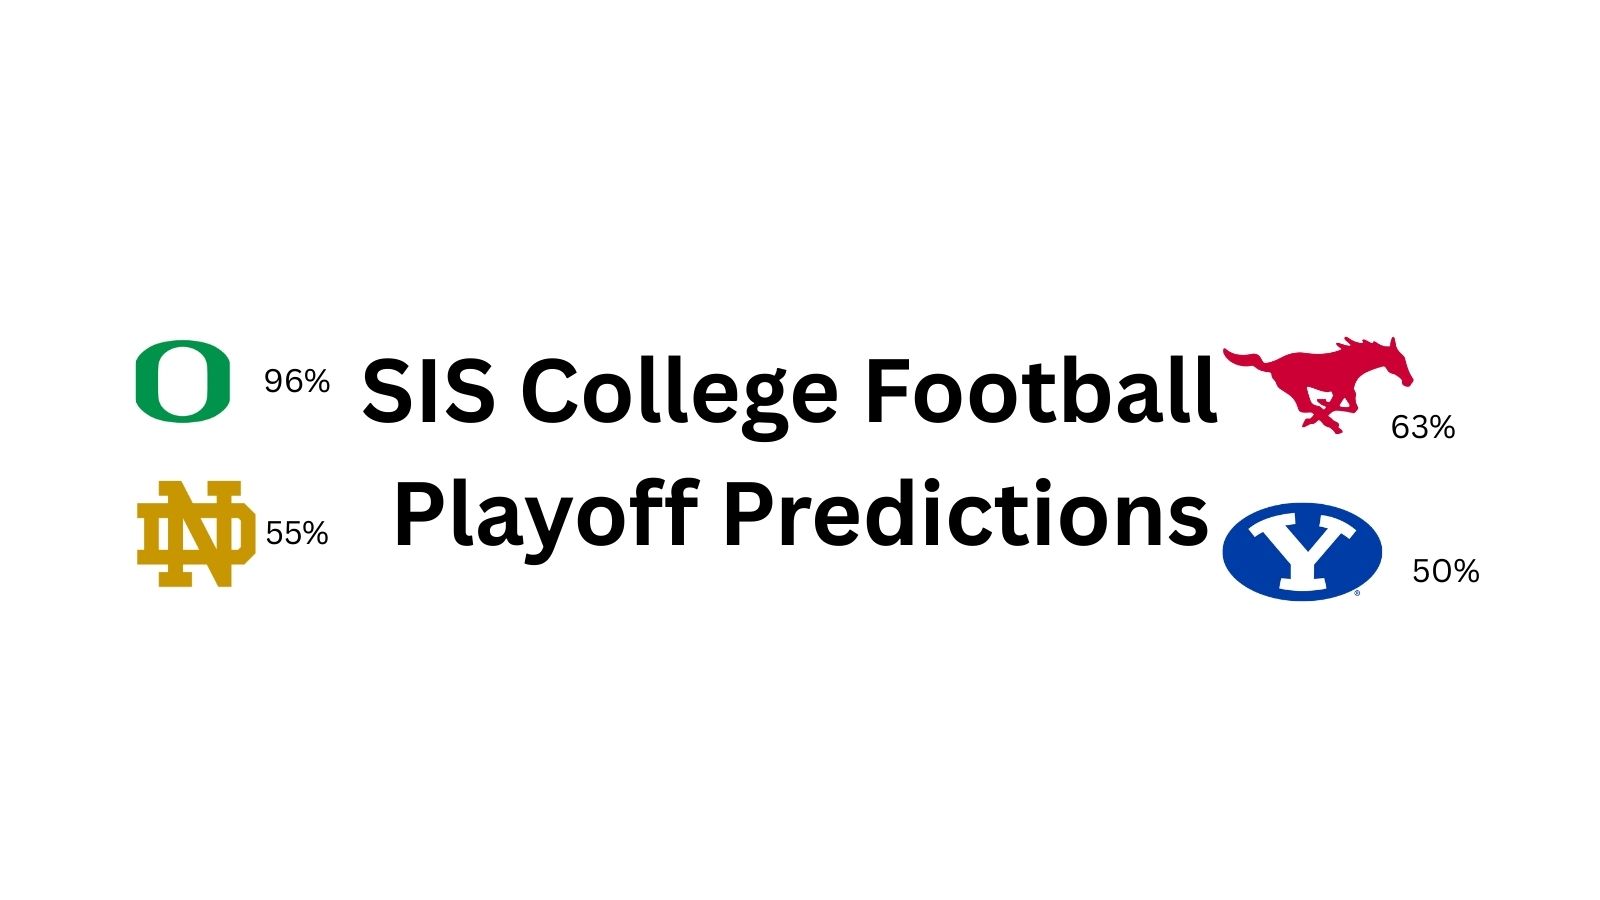
SIS College Football Playoff Predictions
By
We created a model to simulate the end of the season and project the likelihood of a team making the Playoff
-
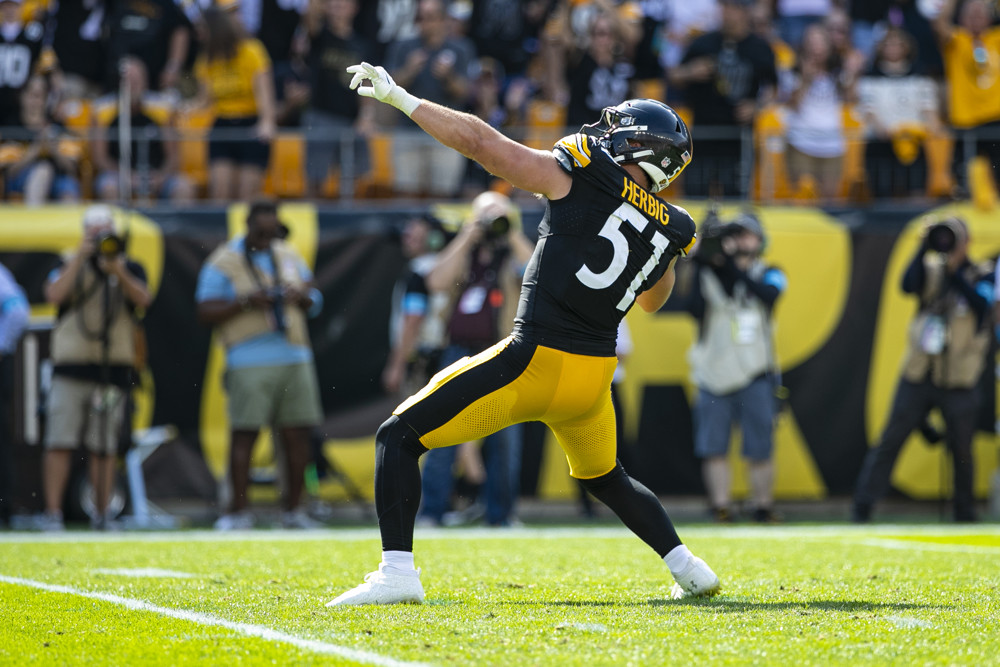
State of the Steel Curtain: Paid To Be The Best, Still Getting There
By
The Steelers are showing flashes of excellence, but may want to consider simplifying things in at least one aspect
-

A New Expected Points Model
By
Learn about an adjustment we made to make our model more effective at the end of halves and games
-

10 Facts About NFL Schedule Trends
By
Things you’ve thought about but didn’t know … and maybe you want to know.
-
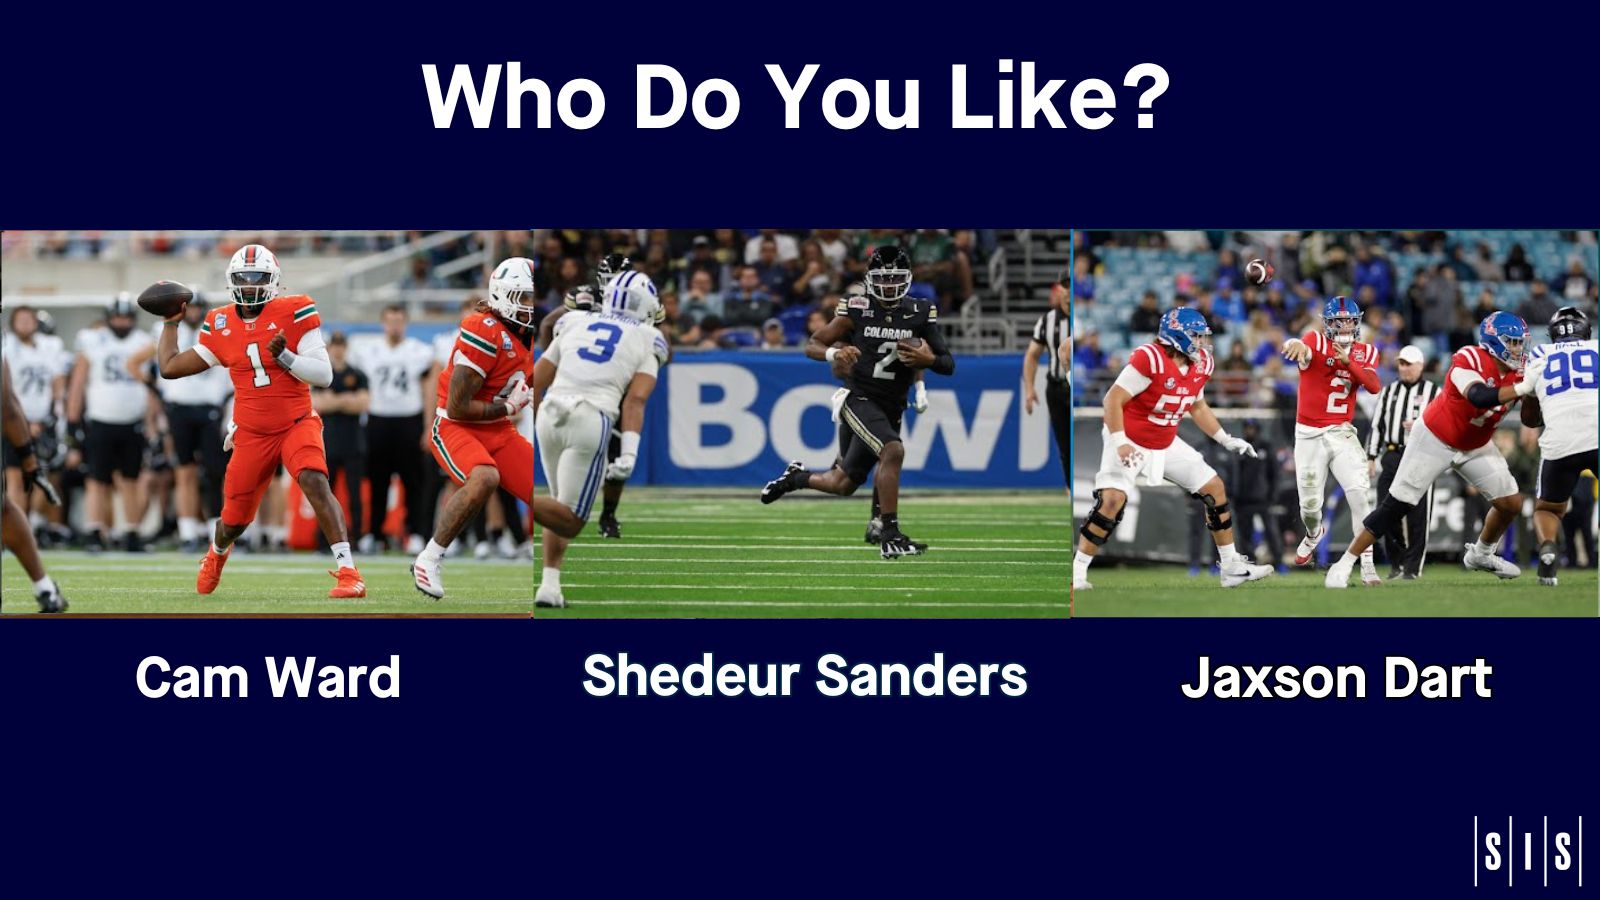
A Comparison of the Top 3 QBs in the 2025 NFL Draft Class
By
Who’s the best QB in the 2025 NFL Draft? Depends on your scheme.
-
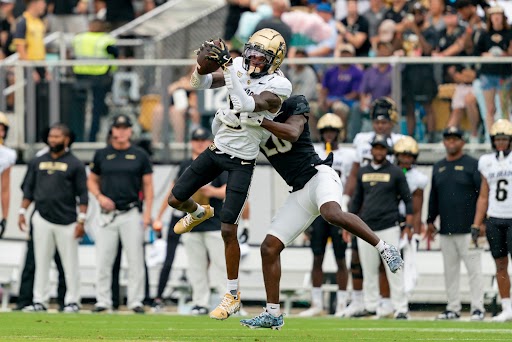
Analytics Scouting Report: Travis Hunter, Wide Receiver
By
We try to find where Hunter’s best part-time value can be applied on the offensive side of the ball
-
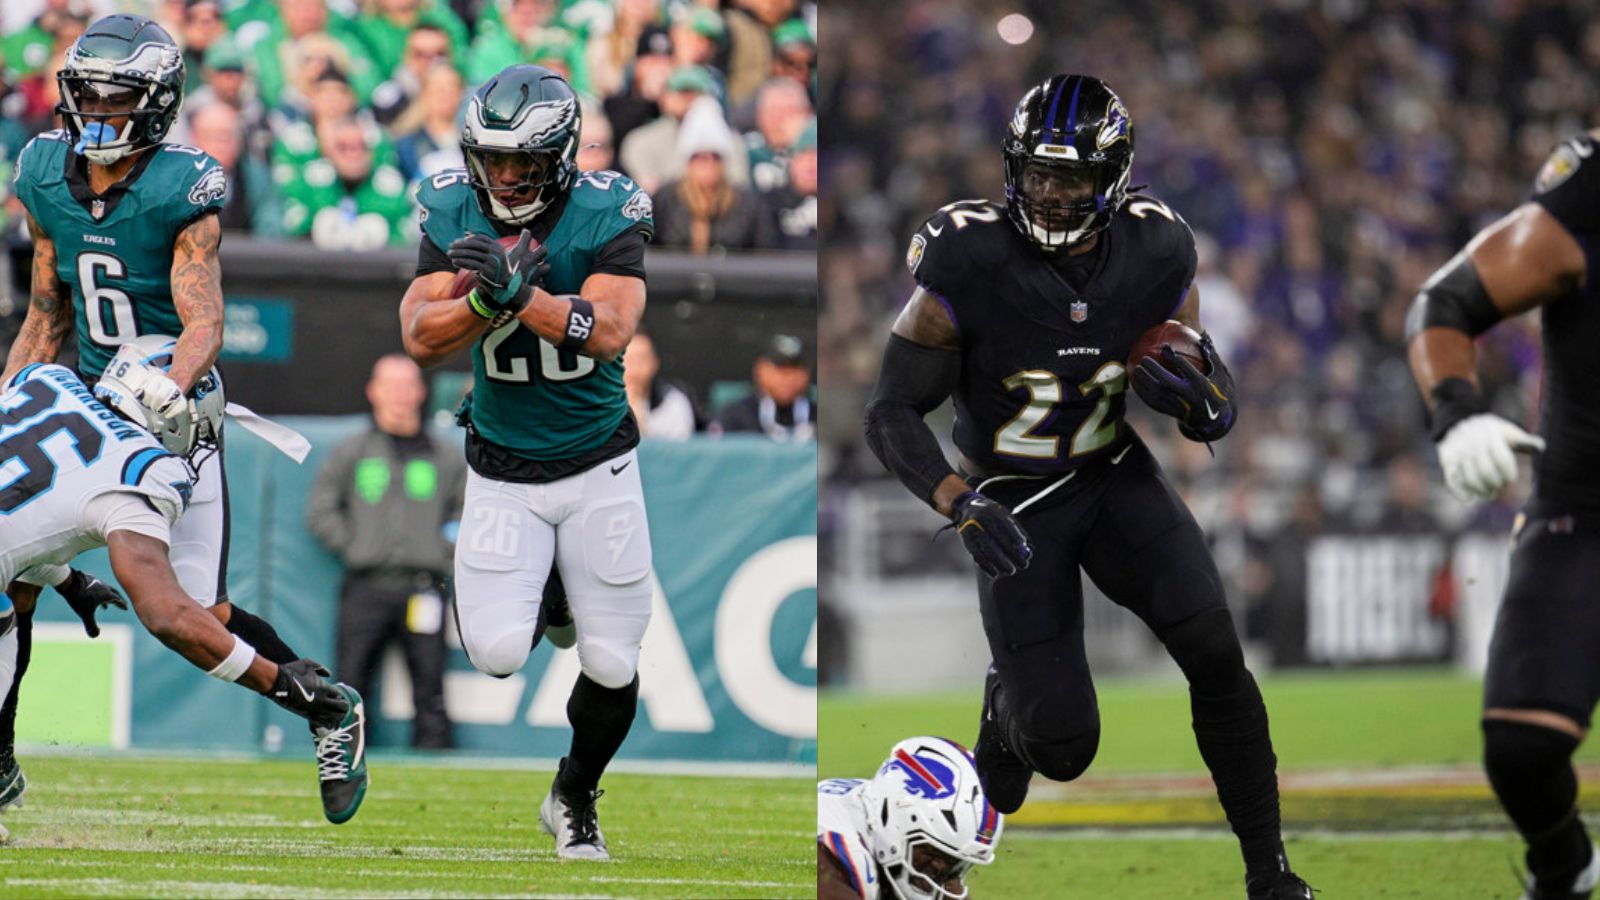
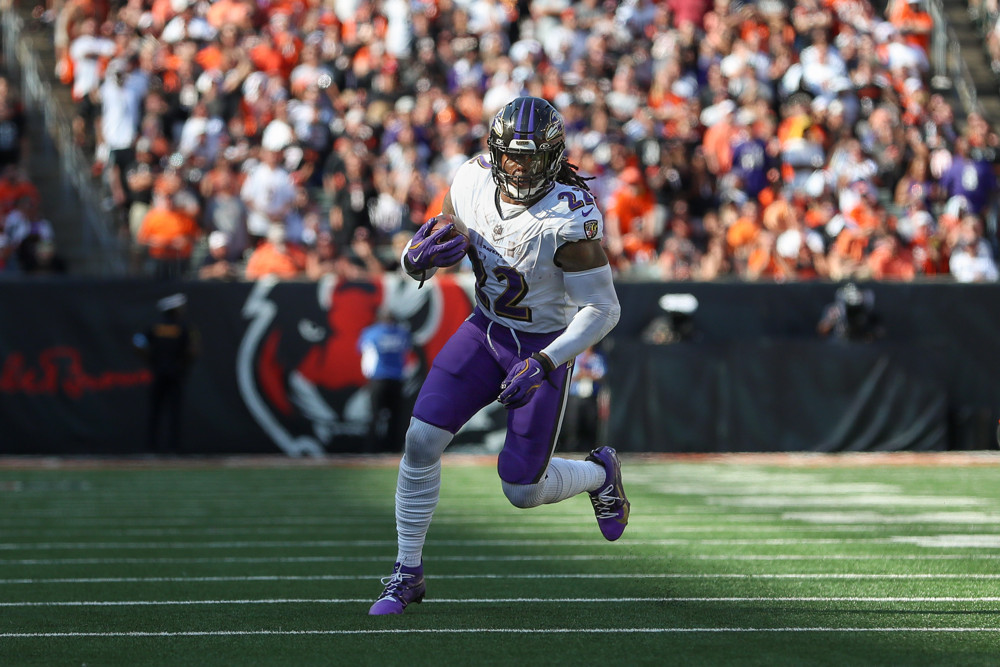
Running Backs Matter … Again?
By
Saquon Barkley, Derrick Henry and Josh Jacobs are changing the narrative
-
Assessing The NFL Awards Field Using Total Points And IQR
By
We use our stats to break down the fields for the different NFL awards.