Sports Info Solutions
Author: James Weaver
-
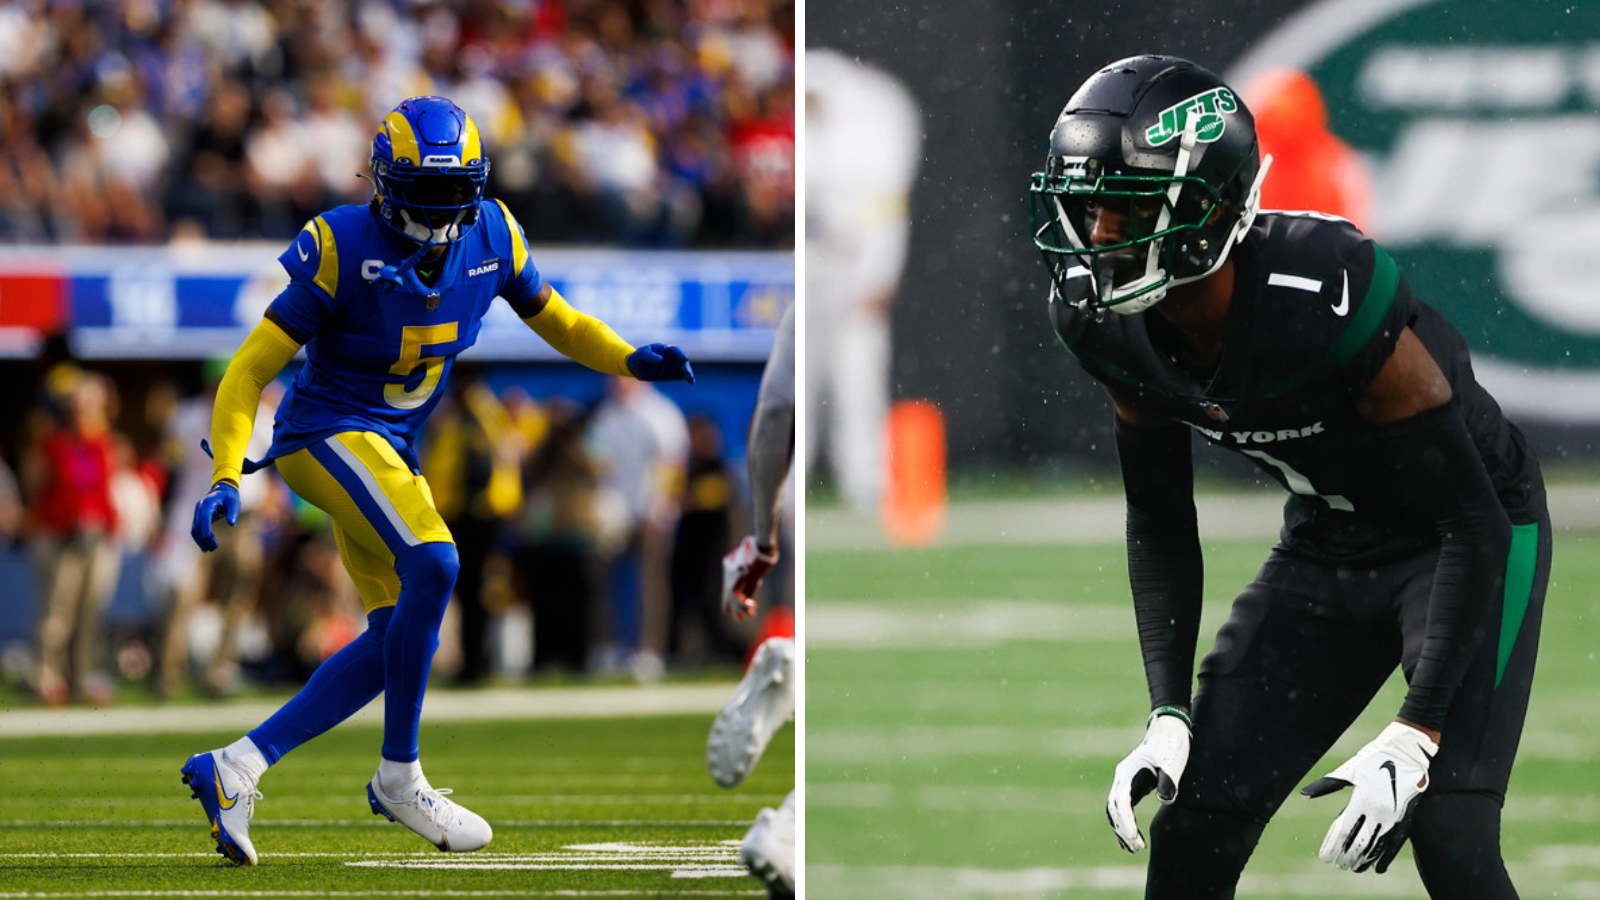
Scouts vs Stats: Top 10 NFL Cornerbacks
By
Sauce Gardner and Jalen Ramsey are among the best, but only one garnered the top spot on one of our lists.
-
Study: Where does “NFL-Ready” talent come from in the NFL Draft?
By
Which positions – if any – get the best immediate results from rookies? There’s one in particular that caught our attention.
-
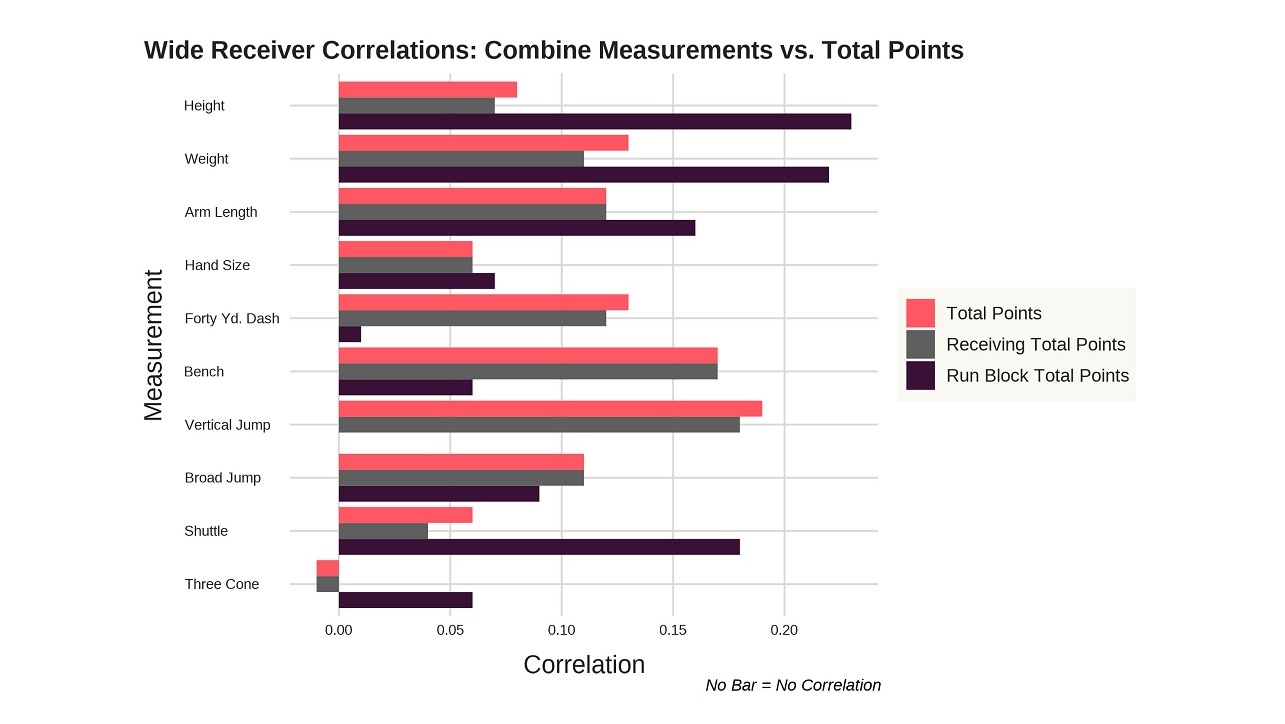
Study: Combine Measurements and Total Points – Do they Correlate?
By
Some numbers mean a little but do any of them mean a lot?
-

Which Steelers QB will start Week 1?
By
We review the 3 possible options to replace Ben Roethlisberger