Sports Info Solutions
Category: 2025 MLB
-
Stat of the Weak (Contact)
By
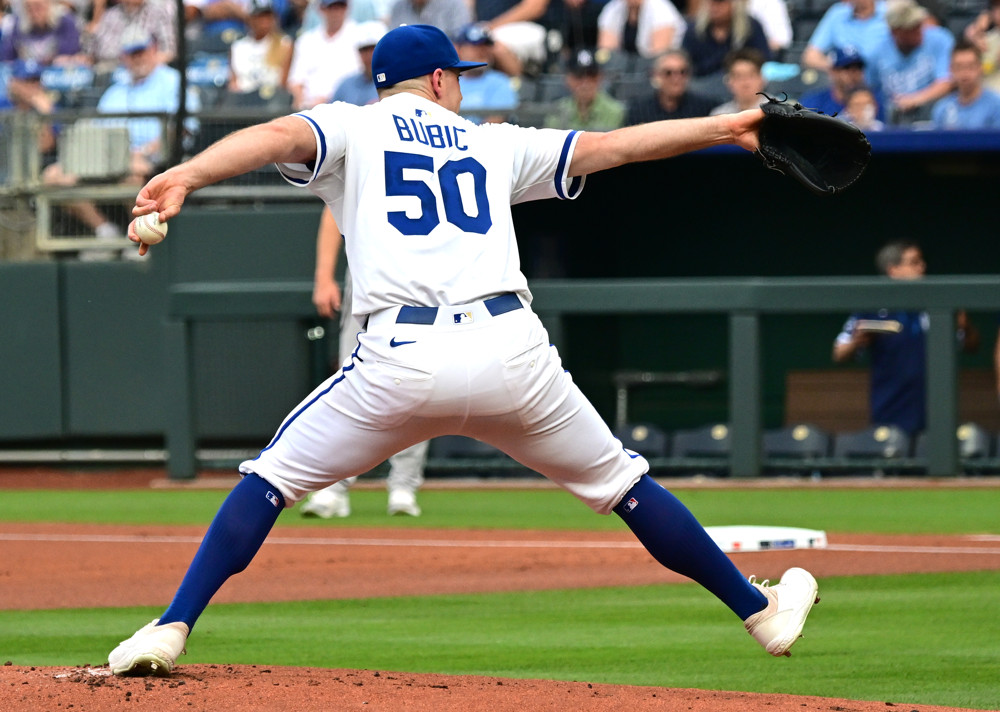
The leader in highest percentage of soft contact induced in 2025 was … Kris Bubic.
-
Stat of the Week: Our Year-End Awards
By
We share who were the best at robbing homers, framing pitches, making barehand plays, and other things we track
-
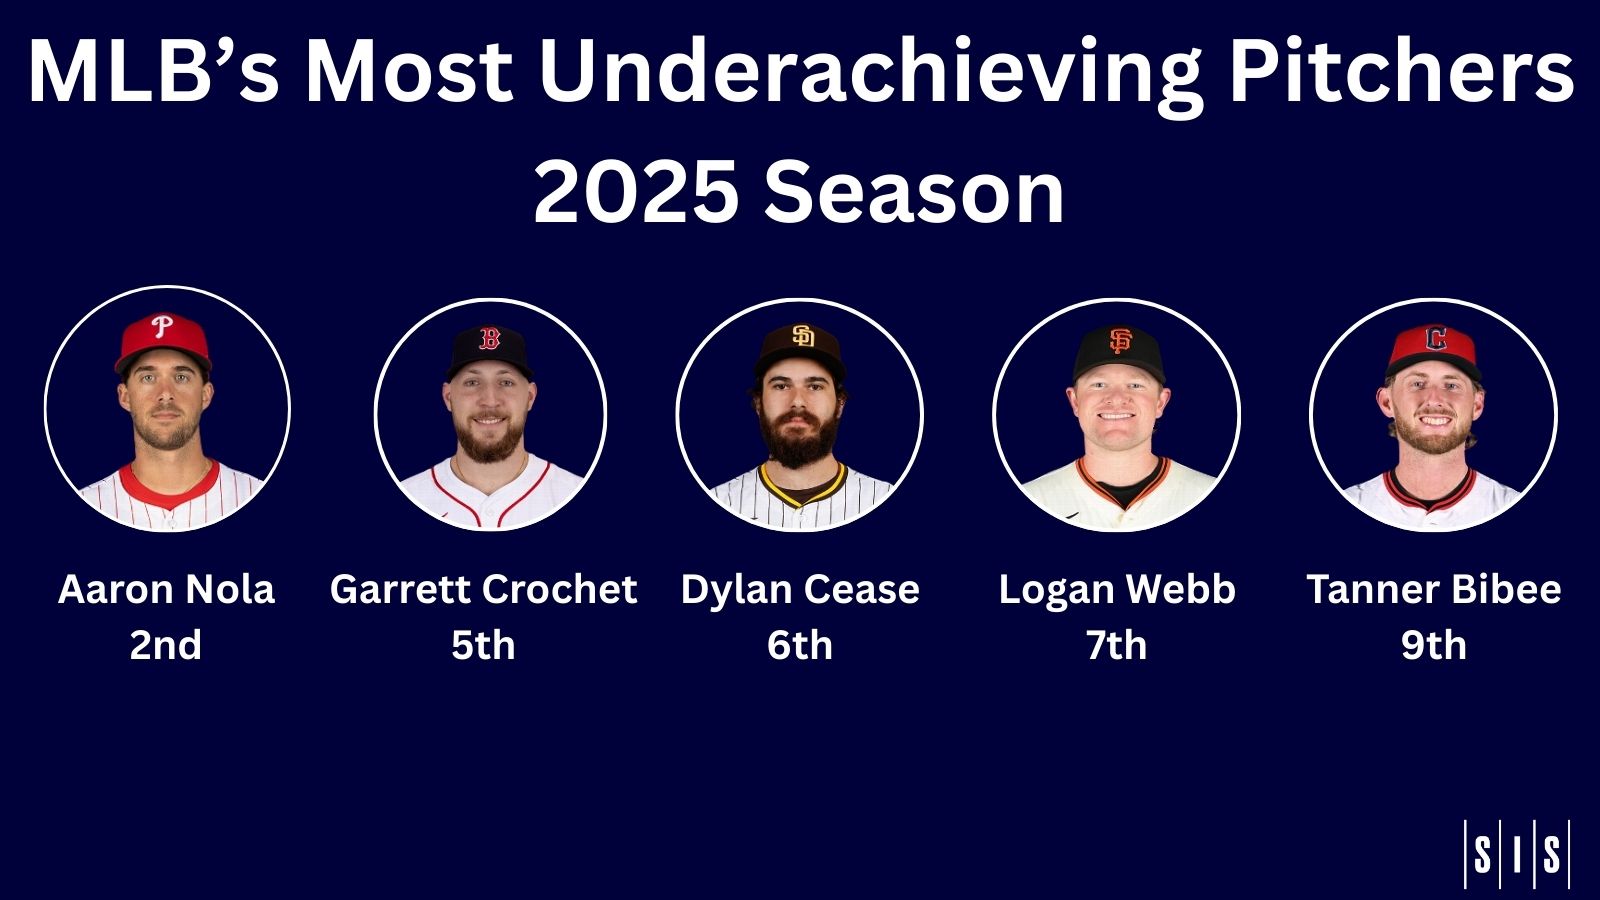
Stat of the Week: Who Were MLB’s Most Underachieving Starting Pitchers in 2025?
By
We look at OPS and compare it to an expected OPS to see which pitchers had the biggest differentials.
-
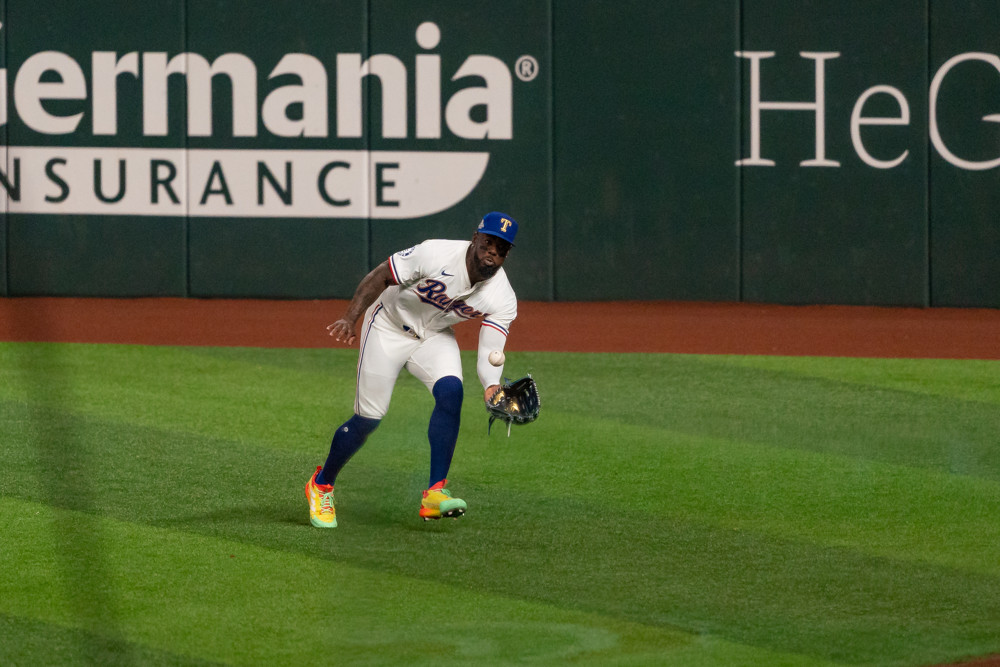
Phillies Make A Massive Defensive Upgrade With Adolis García
By
The acquisition shores up what has been a major defensive issue for the Phillies the last several years.
-
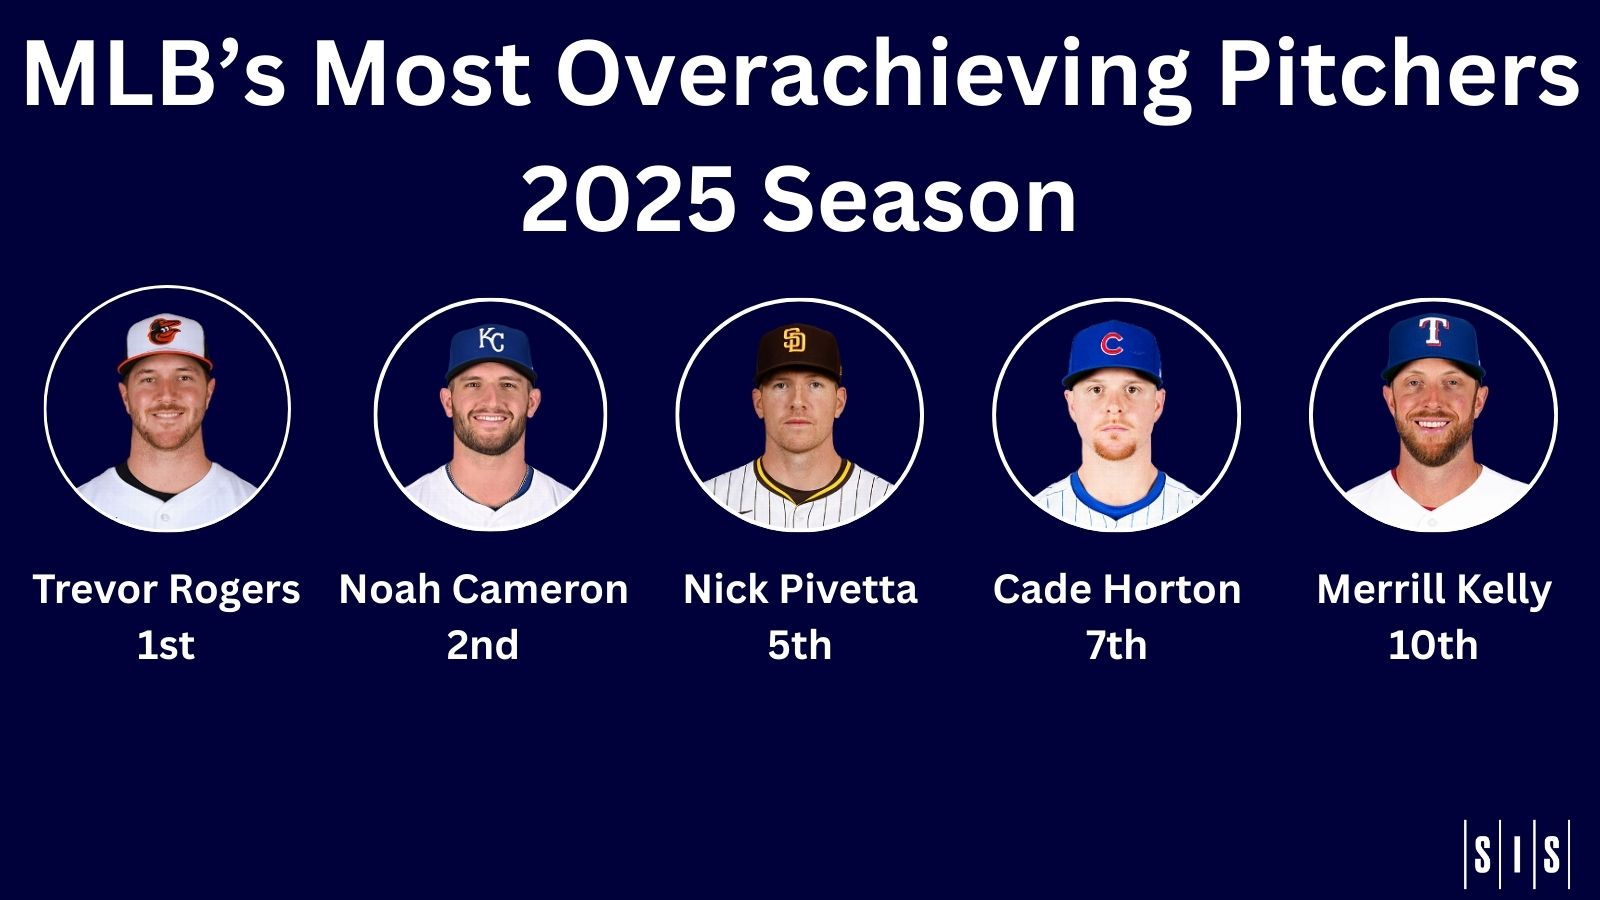
Who Were MLB’s Most Overachieving Starting Pitchers in 2025?
By
Not surprisingly, Trevor Rogers leads the way. We offer a Top 10 list, plus a note on a reliever who signed a big contract.
-
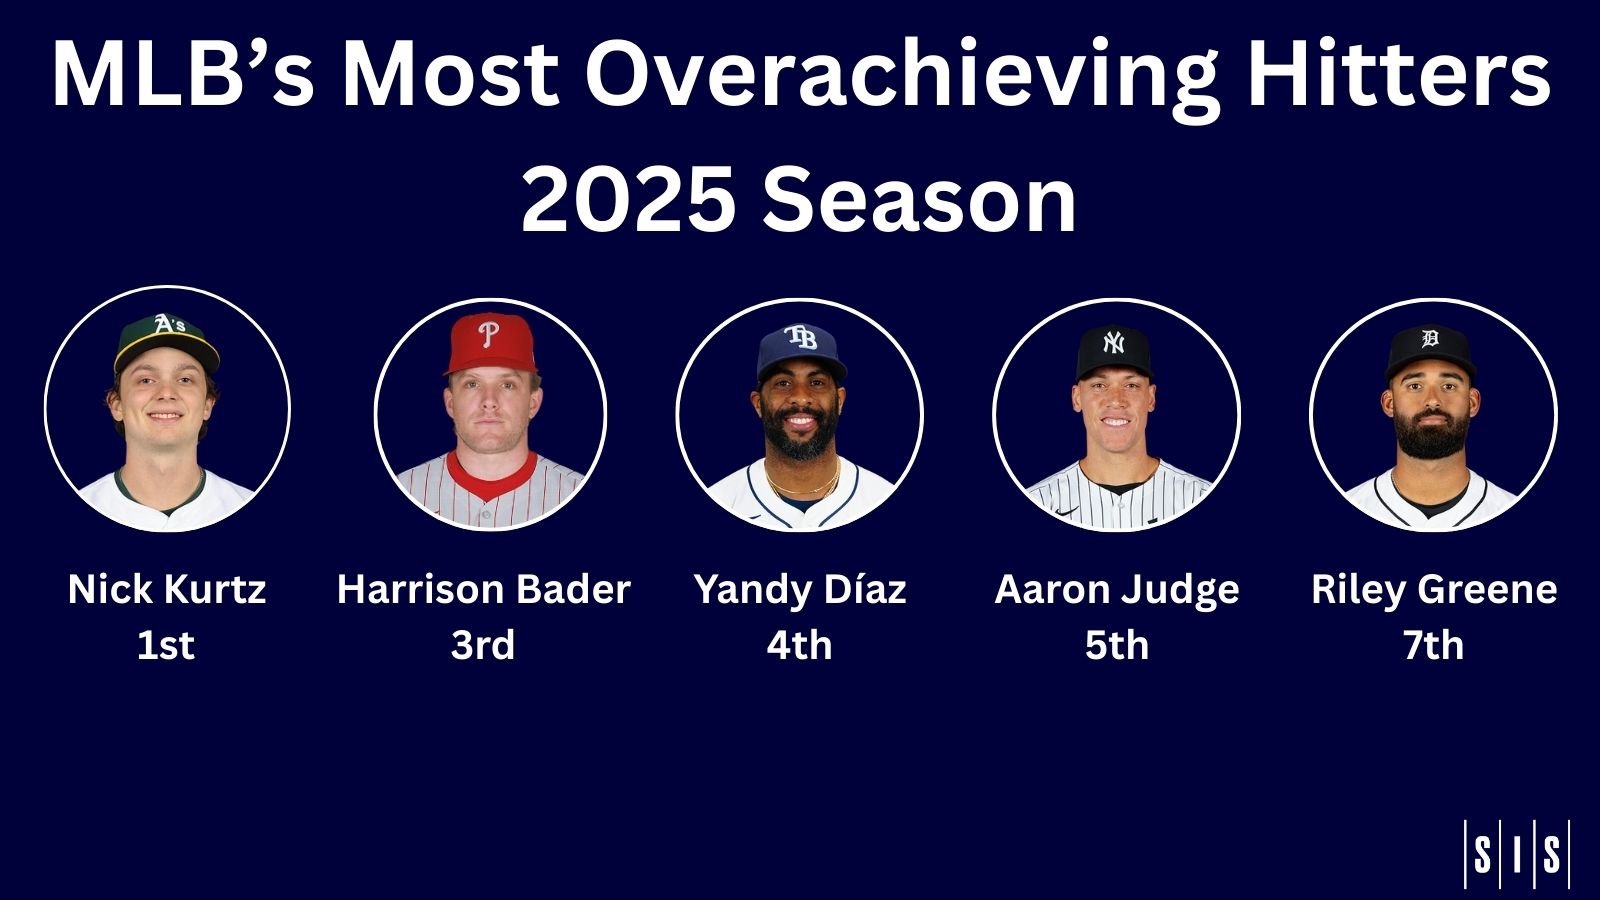
Stat of the Week: MLB’s Most Overachieving Hitters in 2025
By
Among the hitters who most outperformed their expected OPS: Nick Kurtz, Aaron Judge, and Harrison Bader.
-
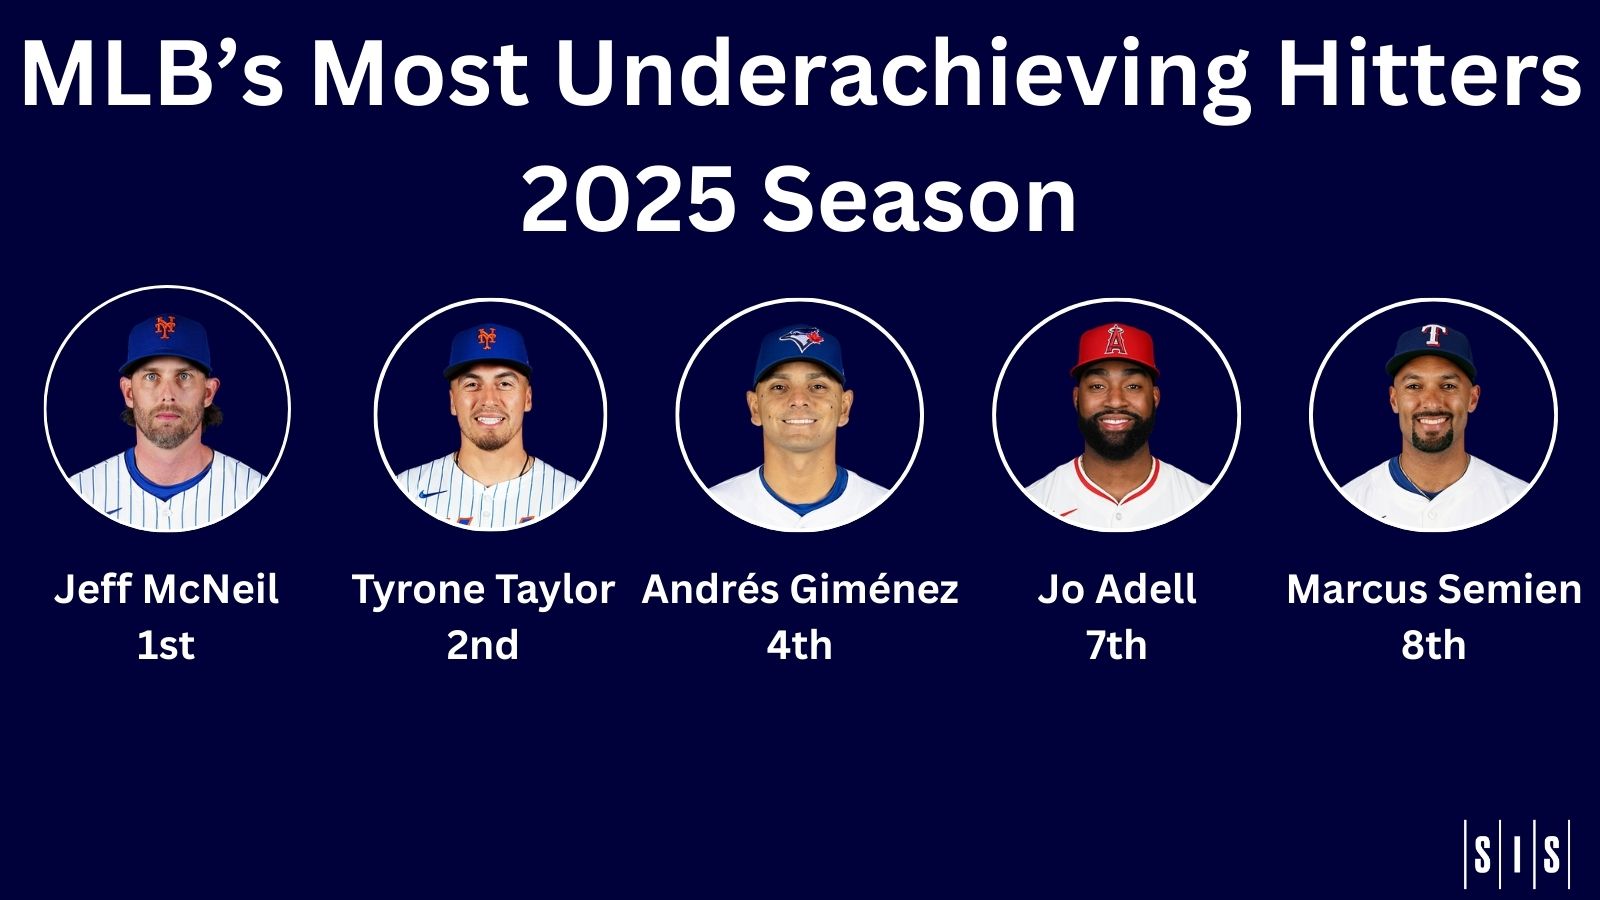
Mets Abound on List of MLB’s Most Underachieving Hitters In 2025
By
The headliners are Jeff McNeil and Marcus Semien, but there’s also Jo Adell and some others of note.
-
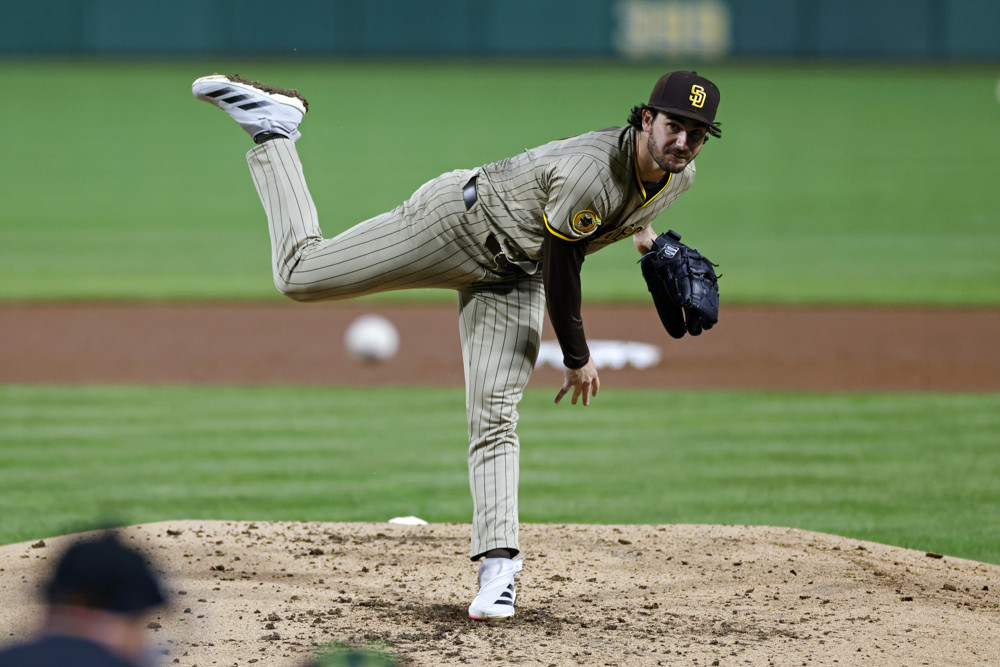
Stat of the Week: Dylan Cease Deserved A Better Fate In 2025
By
The Padres defense didn’t help Cease out much last season.
-
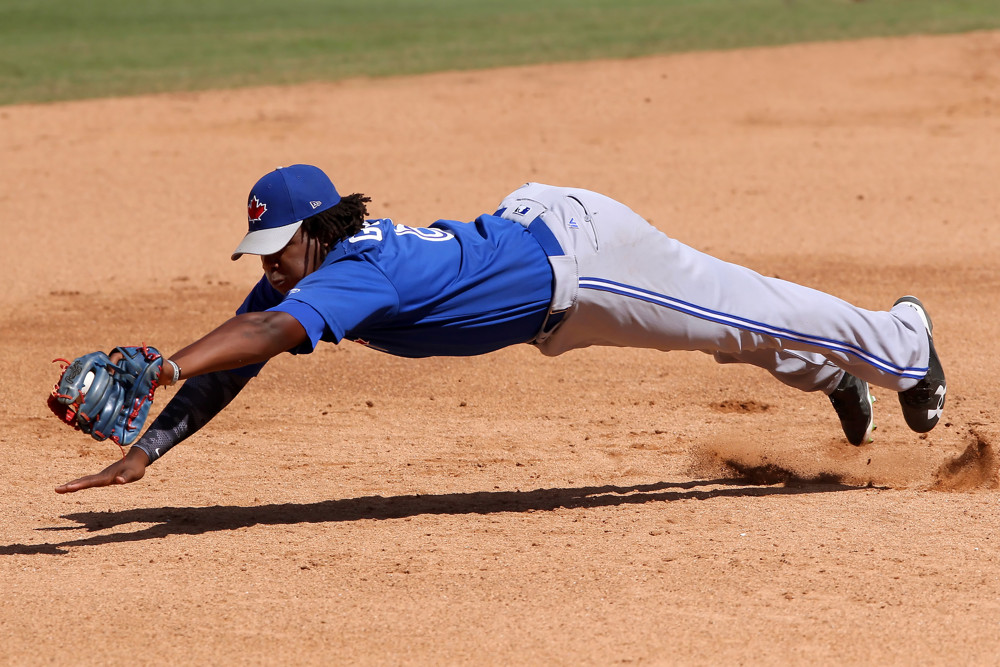
Stat of the Week – Ultimate Winner of the World Series: Great Defense
By
We salute a few of the most impressive defensive players from a memorable conclusion to the season.
-
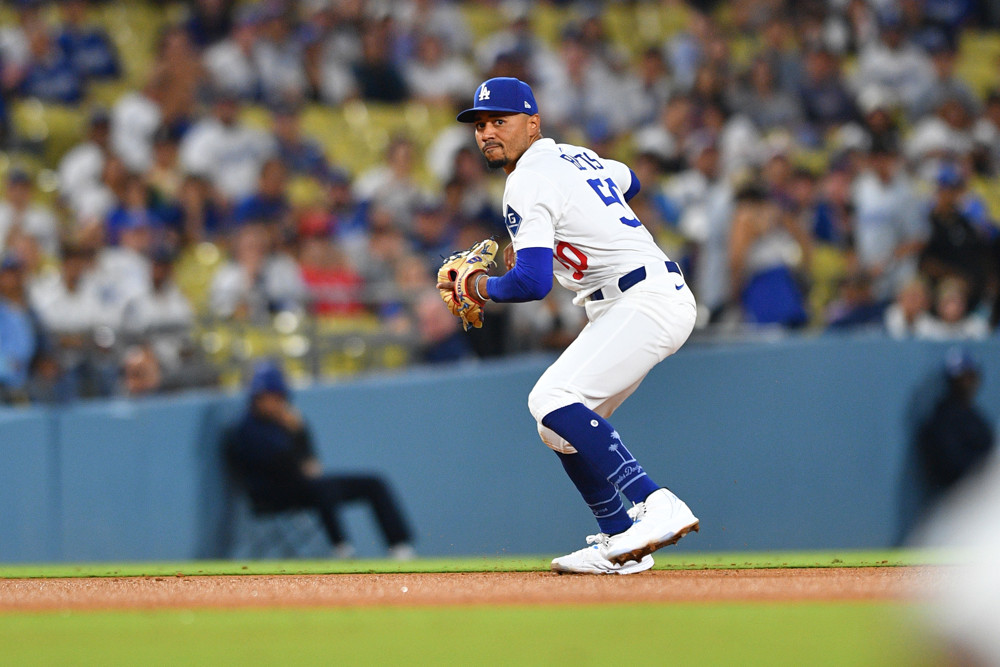
World Series Defensive Scouting Report: Los Angeles Dodgers
By
Icon Photo: Brian Rothmuller/Icon Sportswire The Dodgers ranked third in the majors in Defensive Runs Saved this season, which seems odd when you consider that they had negative Runs Saved at five different positions (pitcher, catcher, first base), but a few positional strengths and one big team factor can go a long way towards defensive…