Sports Info Solutions
Category: Baseball
-
Stat of the Week: Upcoming Hall of Fame Classes
By
There are 3 first-time candidates coming up in the next 2 years who have Hall-worthy numbers.
-

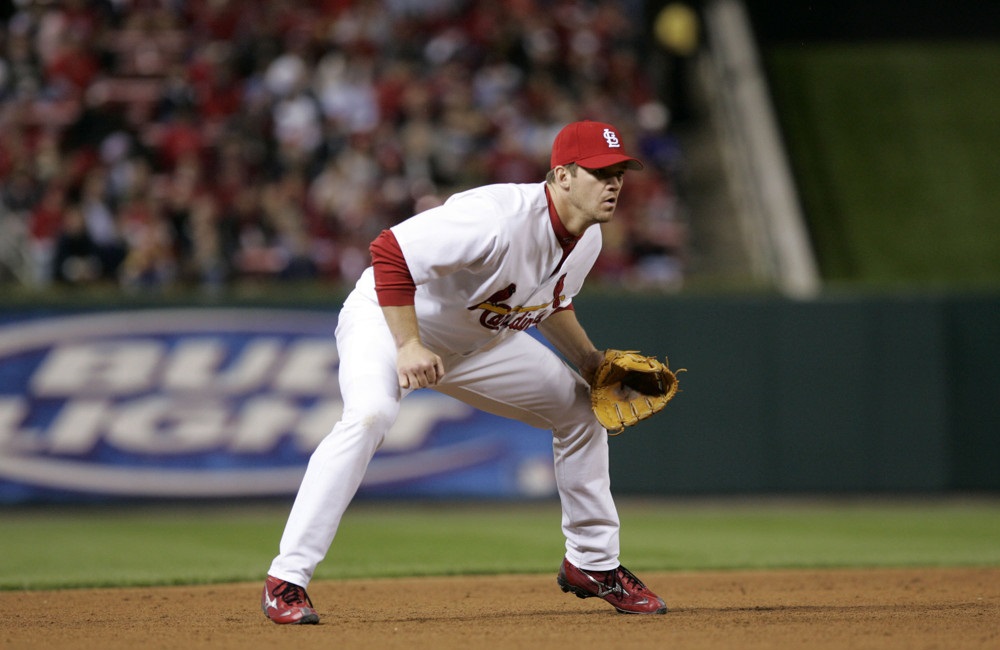
Kevin Newman Can’t Slide, Dive or Jump Well … And That’s Ok
By
Newman found an alternative to leaving his feet – and it looks like it made him into a better fielder.
-
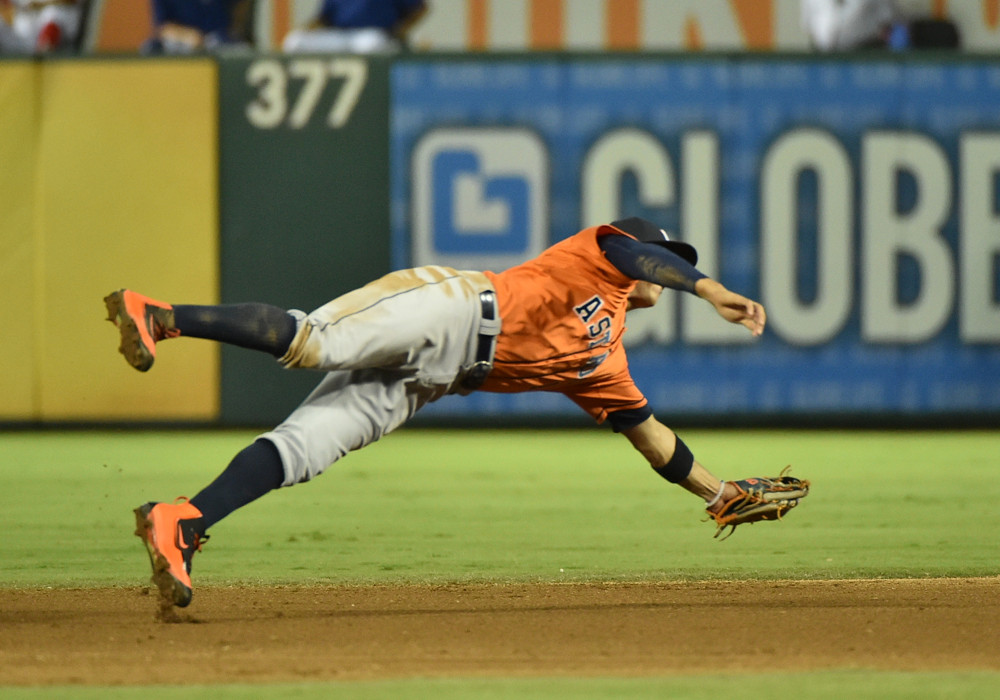
Carlos Correa’s Amazing Slides, Dives, and Jumps
By
The 2021 Fielding Bible Award winner is far better than his positional peers at making these types of plays.
-
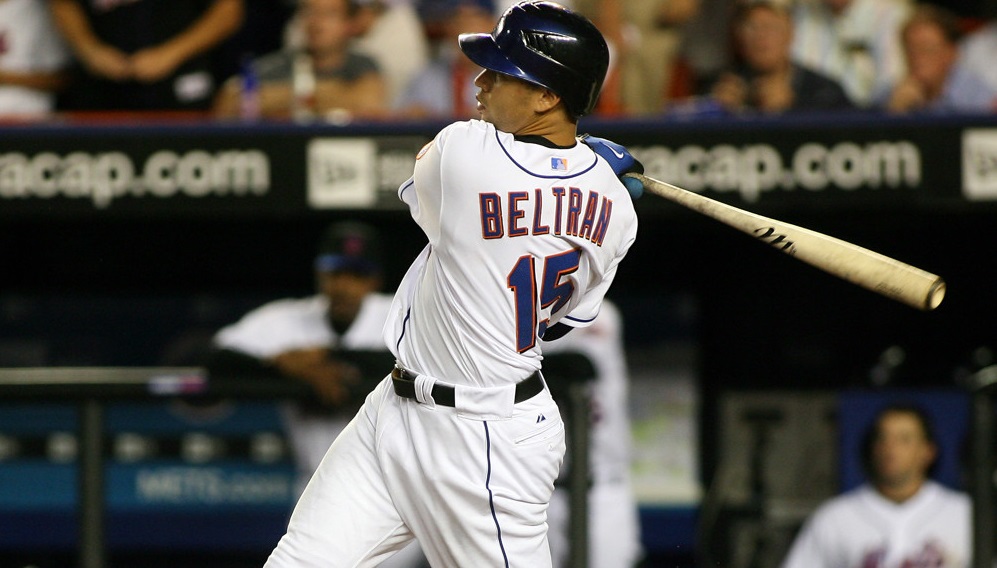
Making the Hall-of-Fame Case
By
A snapshot of four players on the Hall of Fame ballot who are deemed Hall-worthy by one stat.
-
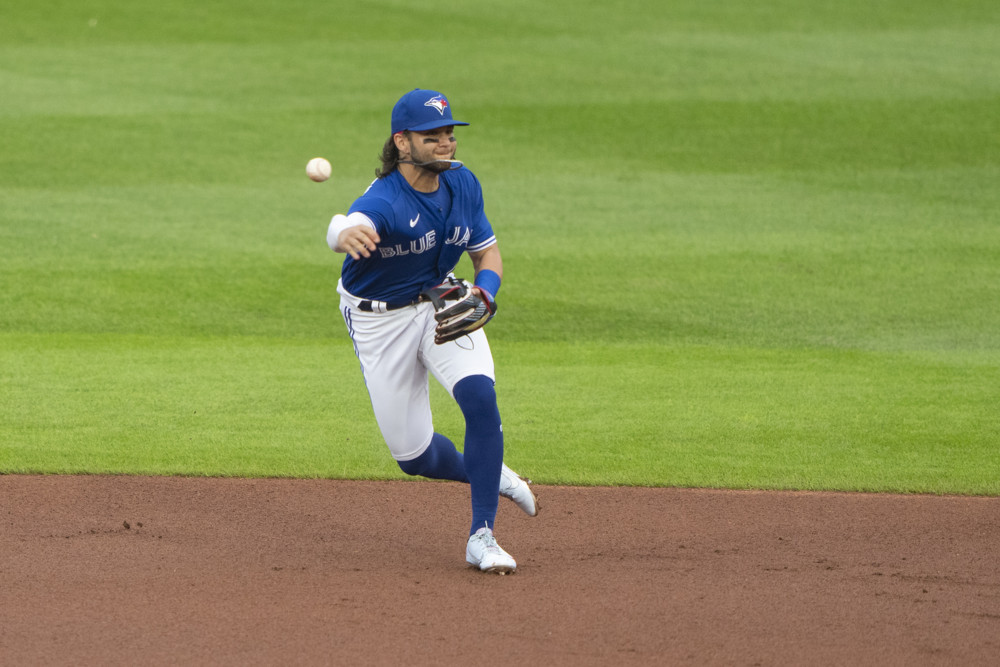
Bo’s Throws A Major Woe
By
Statistically speaking, how much is Bo Bichette’s throwing hurting his Defensive Runs Saved?
-

Stat of the Week: 2021 MLB Year-End Awards
By
Who were the best at netting hard contact, minimizing hard contact, bunting, and making great plays on grounders and fly balls?
-
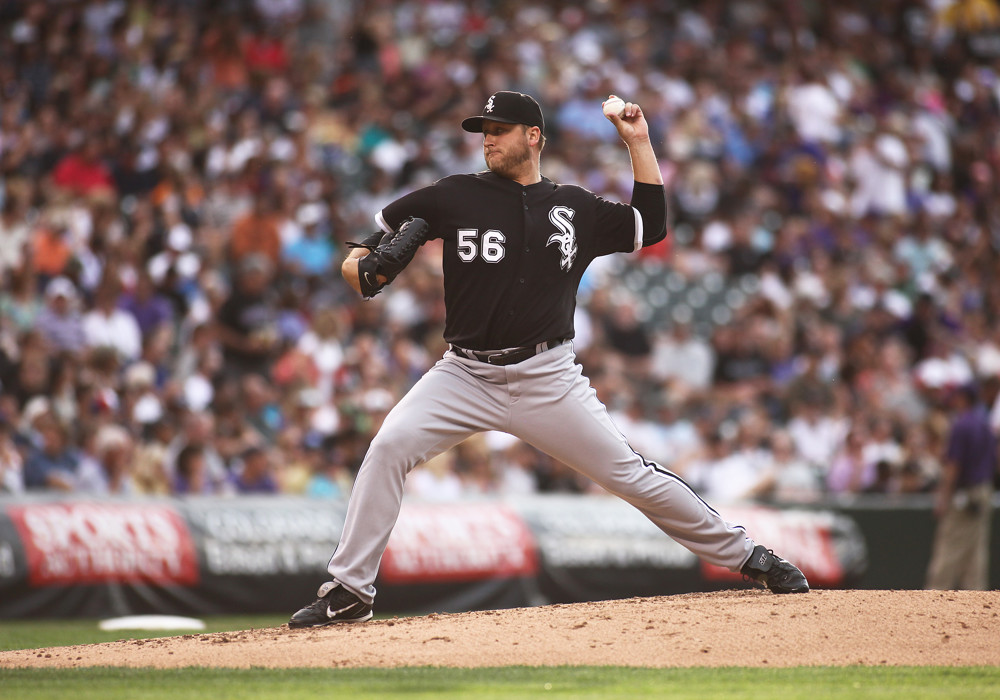
Stat of the Week: Appreciating Mark Buehrle and Tim Hudson
By
The type of pitcher that Buehrle and Hudson were is becoming extinct.
-

2021 NPB & KBO Fielding Bible Award Winners
By
Who were the best defensive players in each of these leagues?
-
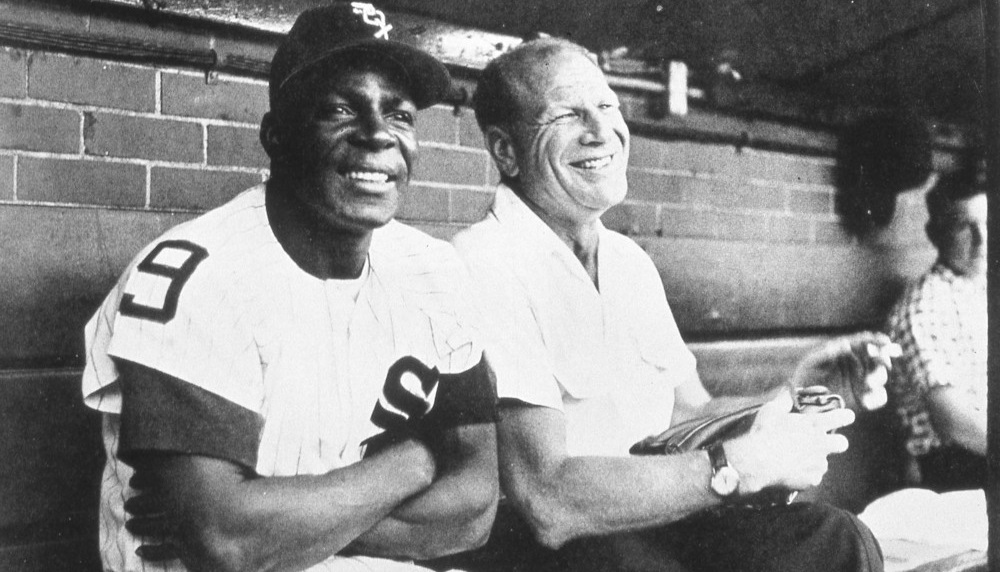
Stat of the Week: New Hall-of-Famers
By
A common thread among the Hall of Fame selections is defensive excellence.
-
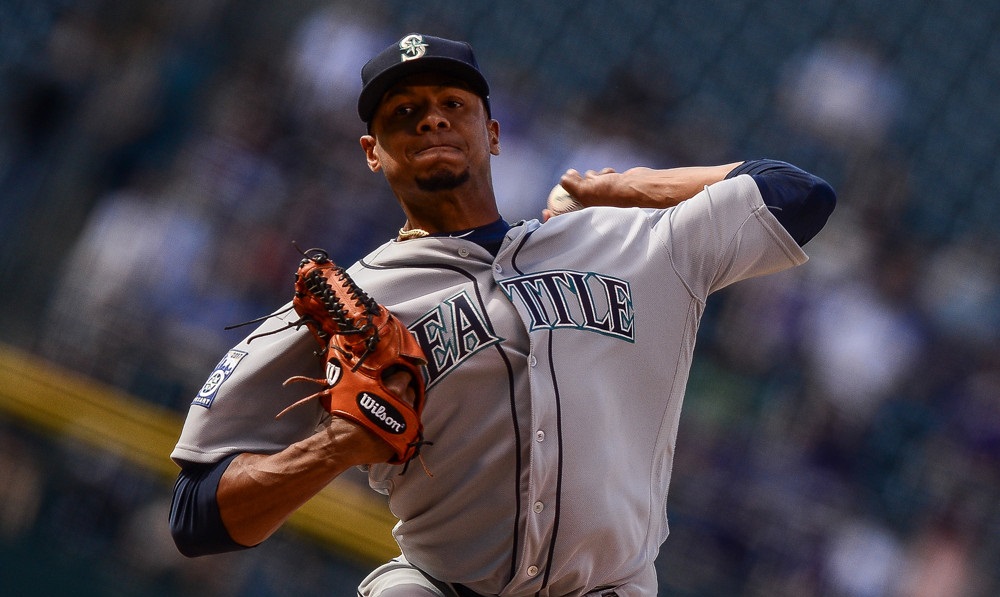
KBO Scouting Report: Aríel Miranda
By
The lefty with a nasty splitter would be intriguing if he returned to the major leagues.