By Brian Reiff
Prior to the 2020 MLB season, Sports Info Solutions (SIS) announced major upgrades to its flagship defensive metric, Defensive Runs Saved (DRS). These upgrades centered around the incorporation of infielder starting positions in the calculations and the improvements that were consequently able to be made.
Knowing where infielders started on the play allows us to separate out their Positioning from their other contributions on a play, namely their Range and their Throwing. Therefore, the new system is called the PART System, which stands for Positioning, Air balls, Range and Throwing.
The PART System has replaced the Range and Positioning System (formerly known as the Plus/Minus System) as the primary component of DRS for infielders for all seasons since 2013. (Outfielders will continue to be evaluated using the Range and Positioning System.) This article focuses specifically on this new component, although further explanations and descriptions for the others can be found in the original DRS Glossary entry on FanGraphs or at FieldingBible.com.
The PART System
At its core, the PART System’s goal is to split a fielder’s contributions into its individual components. This differs from its predecessor, which calculated and reported a fielder’s positioning, range and throwing contributions as a single number.
One of the primary reasons for the development of this new system was the massive increase in shift usage in recent years, since DRS had not included shift plays in its analysis of players before this update. In 2010, less than 2% of all balls in play featured a shift being employed by the fielding team, per SIS charting. In 2019, that number was over 40%.
In 2012, SIS realized that this increase in shifts was skewing individual player numbers—the example cited was Brett Lawrie, a third baseman who was often stationed in short right field when the team shifted its fielders. Because of this, he was making plays in “zones” that no other third baseman could and receiving tremendous amounts of credit as a result. At the time, the solution was to eliminate these shift plays from consideration when evaluating a fielder’s contributions, and instead calculate Shift Runs Saved at the team level. In an era where shifting was still a rarity, this decision made sense, but now that teams are shifting on nearly half of all balls in play (and showing no signs of slowing down), a different approach has become necessary to continue accurately and completely evaluating players.
This new approach is the PART System. Rather than exclude plays where fielders are lined up dramatically differently from a traditional alignment, the PART System is able to handle these plays by incorporating the fielder’s starting position into the calculation of his Runs Saved on the play. Thus, what was becoming a large gap in individual player defensive evaluation has effectively been filled, all the while opening the door for greater and more in-depth analysis.
Positioning and Shifts
The PART System utilizes the starting positioning data collected by SIS to separate a fielder’s positioning from everything else they do on the play.
The primary benefit of this is that players can be credited for what they can actually control. Positioning has been effectively removed from a player’s DRS total on the premise that teams now control where a player is standing more than the player does. Whatever credit the fielder may receive or lose on a play is based on where they were standing when the ball was hit, rather than simply assuming they were standing in a traditional starting location.
Positioning, while removed from players’ DRS totals, is still aggregated and accounted for on the team level. Each team is now credited with a certain number of Infield Positioning Runs Saved, which is composed of the team’s positioning on both shifted and unshifted plays.
Speaking of shifts—until this update, SIS had not included plays where the defense was shifted in its evaluation of individual fielders. This was because, in shifts, fielders could be positioned in vastly different locations than they would be in a standard alignment and therefore receive large amounts of undue credit for making plays that no other player at the position even had a chance of making.
Fortunately, this is no longer a concern with the introduction of the PART System. No plays are excluded from the calculation, and, because the players’ positioning is used to determine the amount of credit they receive, “The Lawrie Problem” is a non-issue. If the ball is hit at or near the fielder, they will receive a lower amount of credit than if it is hit far away, regardless of where they were standing at the time of the pitch.
Despite the inclusion of plays classified as shifts in player evaluation, SIS continues to estimate the number of runs each team is saving using the shift. In fact, the new calculation more accurately measures how many runs were saved by shifts independent of the quality of fielders who were in the field at the time. The new Shift Runs Saved, which is a subset of Infield Positioning Runs Saved, only takes into account the team’s positioning on shifts, as opposed to the previous version of Shift Runs Saved that could not make a distinction between the team’s positioning and the fielders’ out-converting abilities.
Air-Range-Throwing Breakdown
So far, Positioning is the only component of PART that has been discussed. The other components—Air, Range and Throwing—are what actually comprise each player’s ART Runs Saved total, the component that is replacing the former Range & Positioning Runs Saved in the new version of DRS.
Range is perhaps the most intuitive of the three, although there is still some clarification needed. In this system, range represents a fielder’s ability to reach a batted ball in an efficient and timely manner. If a fielder reaches a ball that no one else would’ve, they will receive positive range credit. However, if they fail to reach a ball, or take longer than expected to reach it, they will receive negative range credit. It’s also worth specifying that, because of the way SIS data is collected, range is only concerned about when or if the fielder touches the ball, not whether they field it cleanly.
Everything that happens after the fielder touches the ball is considered part of the Throwing sub-component, which, obviously, means that the name is vastly oversimplified.
This means that on a given play, a fielder might receive Throwing credit despite not throwing the ball at all, a typical example being a fielder who steps on a base for a putout. It also means that, when a throw actually is made, this sub-component measures the fielder’s ability to field the ball cleanly, plant their feet (or not) and fire a ball quickly and accurately to whomever is receiving the ball. Ideally, each of those would be measured individually sometime in the future.
Last, and probably least, is Air. As of this writing, SIS only collects infielder starting positioning data on all groundballs and short line drives (GSL). Therefore, the PRT sub-component splits only apply on those types of balls in play, which, in fairness, make up approximately 80% of all balls fielded by infielders. On the other ~20% of non-bunt balls in play fielded by infielders—composed essentially of bloops and popups—any credit or debit a fielder earns on a play will apply toward their Air Runs Saved. Because SIS does not record infielder starting positioning on these plays, non-GSL plays in which the defense is shifted will continue to be excluded from a player’s DRS total.
When combined, a player’s Air, Range and Throwing runs saved will comprise their ART Runs Saved.
Each sub-component is reported separately over at FieldingBible.com to allow for the comparison of individual skills and attributes of various players.
Directional Ability
Another upgrade comes in the form of evaluating a player’s ability by direction. Because a player’s starting positioning was not known in the previous system, this could only be done in terms of where a fielder was traditionally positioned. For example, a third baseman could be judged on plays down the line, in the hole, or straight on, but on a ball considered “straight on”, there’s no guarantee that it was actually hit at them. If the fielder was positioned close to the line, the ball would have been to their left; if they were positioned in the hole, it would have been to their right. While the breakdown was useful, especially in understanding how fielders were positioned, it did not accurately reflect a player’s ability to field balls in particular directions.
That is no longer the case thanks to the starting positioning data. Knowing where the ball traveled in relation to where the fielder started the play allows for evaluation of a fielder based on what direction they had to move to field the ball.
For each of the three directional groups, a fielder is compared against others at their position in terms of both Plays Above Average and Runs Above Average (or Runs Saved). Again, these numbers are reported at FieldingBible.com for those who wish to view them.
Evaluation of Multiple Fielders on a Play
Knowing where each fielder started on a play allows for an additional benefit: the evaluation of multiple fielders on a play. Under the Range and Positioning System, and by most if not all other public defensive metrics, if a team successfully records an out on a play, the fielder who recorded the assist or putout is given credit and every other player on the field receives nothing. Usually, this is a fair thing to do. Most plays will only feature one relevant fielder who should be credited or debited. But what about the cases where that’s not appropriate?
Consider a ball that is hit in the third base-shortstop hole, directly between the two fielders. The third baseman, who was positioned shallower than the shortstop, goes for the ball, but it gets by him. Behind him, the shortstop fields the ball and throws it to first for the out.
In any other defensive system, the shortstop would get credit for making the play, and that would be that. But why should that be it? We know the third baseman had a chance of making the out himself—in fact, we know exactly how likely he was to make the out. If there was an inferior shortstop behind him, the ball might have made it to the outfield, or the shortstop might not have gotten the throw to first base in time. The third baseman’s credit on the play is determined by something completely out of his control—the quality of his teammate.
The PART System offers a solution to this. By knowing where each player started on the field, it can assess multiple fielders on the same play under the assumption that fielders who are positioned shallower (closer to home plate) are able to act on the ball before fielders who are positioned deeper (further away from home plate). In this example, not only would the shortstop be given credit, but the third baseman would also be debited for having failed to make the play himself.
Right now, this assessment of multiple fielders is only utilized on plays where the defense is shifted, although that may be changed in the future. This was done to keep players’ unshifted DRS as similar as possible to how it was being reported previously (at least methodologically—obviously, excluding positioning from DRS is still a major change). On plays where the defense is not shifted, fielders are less likely to be standing close to each other anyway, so it’s unlikely that a play would occur where two or more fielders both have a non-insignificant chance of making an out and therefore unlikely to matter as much. That said, this is an area that SIS expects to research heavily in the coming months as more upgrades are made to the PART System, especially as it pertains to fielders deferring to their teammates on balls either of them could field.
How the Numbers are Changing
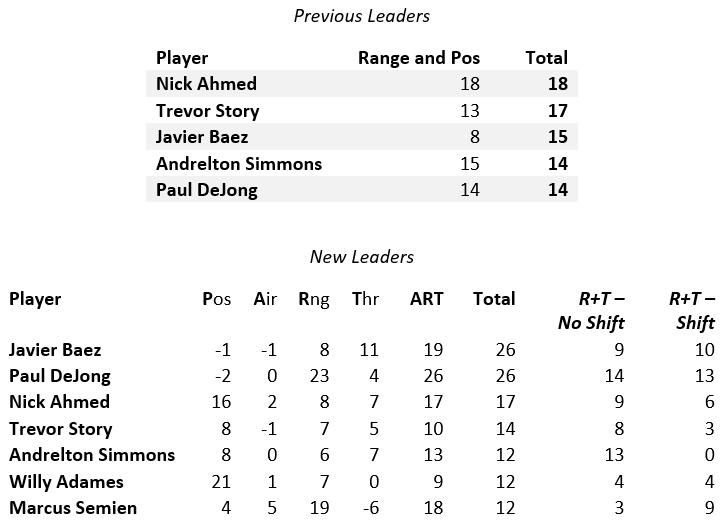
Understanding how the PART System differs in its evaluation of players from the Range & Positioning System is difficult. To show how two systems relate, let’s use Javier Baez as an example.
Using the Range & Positioning System, Baez saved 15 runs in 2019, good for third among shortstops. Using the PART System, he saved 26 runs, tied for first among shortstops. So where did those 11 runs come from?
To keep things as simple as possible, instead of looking at total DRS—which includes things like Double Play Runs Saved and Good Fielding Play Runs Saved, for example—just Baez’s Range & Positioning Runs Saved and PART Runs Saved will be looked at. In 2019, Baez saved 8 and 19 runs, respectively, by those components of DRS. The 11-run difference is still there. That’s important to note—this singular component of DRS is the only component that’s changing. All the other components are staying the same.
But anyway, the 11-run difference: On plays where the Cubs didn’t use a shift in 2019, the Cubs’ positioning of Baez cost the team one run. That’s part of the difference—PART Runs Saved doesn’t count that against him, unlike the Range & Positioning System. Secondly, Baez saved 10 runs with his range and throwing on plays where the Cubs were shifted. Again, those plays weren’t included in his Range & Positioning Runs Saved total, but they are included in his PART Runs Saved total.
Now to add the numbers back together. Baez is given back the one run his positioning cost the Cubs, since the PART System does not credit or debit fielders for their positioning. Starting from his eight Range & Positioning Runs Saved, that brings him to nine. Then, adding the 10 runs he saved when the Cubs were shifted brings him to 19 runs saved, the exact number that the PART Runs Saved System awarded him.
To summarize:
Range & Positioning Runs Saved – Non-Shift Positioning Runs Saved + Shift ART Runs Saved = PART Runs Saved
Now, I’ll admit I cherry-picked this example and this will not work out as nicely as it did for Baez for every fielder. Because there were other small improvements and bug fixes made as part of this upgrade, this math won’t add up exactly for everyone. But it’s close. Using the above equation for every infielder (excluding pitchers and catchers) who played in 2019, the average of the absolute values of the differences between the left-hand and right-hand sides of the equations was 0.58 runs. So, if you’re confused about how a player’s PART value was determined, using that equation will get you almost entirely the way there.
Here are the players who changed the most between the two systems in 2019:
| Player |
Pos |
Pre-2020 DRS |
Non-Shift Pos RS |
Shift ART RS |
PART DRS |
Change |
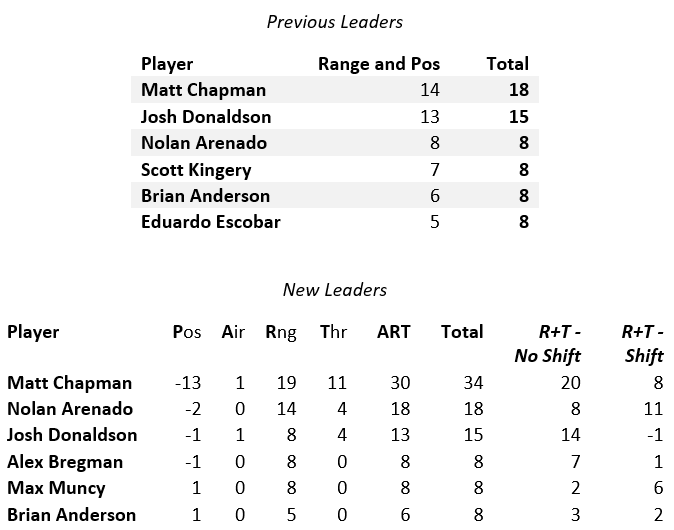
| Matt Chapman |
3B |
18 |
-10 |
9 |
34 |
16 |
| Paul DeJong |
SS |
14 |
0 |
12 |
26 |
12 |
| Javier Baez |
SS |
15 |
-1 |
10 |
26 |
11 |
| Miguel Rojas |
SS |
12 |
3 |
-6 |
2 |
-10 |
| Nolan Arenado |
3B |
8 |
1 |
11 |
18 |
10 |
Context
The scale for evaluating players’ DRS hasn’t changed much with the update. The same tiers that had been used with DRS still applies to the new totals. As a reminder, those tiers are:
| Defensive Ability |
DRS |
| Gold Glove Caliber |
+15 |
| Great |
+10 |
| Above Average |
+5 |
| Average |
0 |
| Below Average |
-5 |
| Poor |
-10 |
| Awful |
-15 |
Methodology
While it may seem much more complex, in reality, the PART System is not that much more complex than the Range & Positioning System. Both rely on the Plus/Minus technique, where credit is given or taken away based on how difficult of a play it was for the fielder. For example, imagine a batted ball with a given velocity and spray angle. Past balls in play with similar characteristics were turned into an out 60% of the time. If the fielder ends up making the play, they would receive 0.4 plays worth of credit (1.0-0.6); if they don’t make the play, they would be debited 0.6 plays (0.0-0.6). In this way, fielders get credited more for making more difficult plays and credited less for making easy plays. An average fielder would then save a net of zero plays for the season.
The difference with the PART System is that it uses the Plus/Minus technique for three different components: Positioning, Range and Throwing (as noted above, Air Runs Saved is an independent calculation). To do this, three different Out Rates must be calculated:
A – The chance that the play will be made given only information about the batted ball (trajectory, location, and velocity) and the batter (speed)
B – The chance that the play will be made given information about the batted ball (trajectory, location, and velocity), the batter (speed), and the initial positioning of the fielders relative to the ball in play
C – The chance that the play will be made at the point that the fielder obtains the ball given the distance he has to throw and how long he has to complete the play before the batter/runner reaches safely
Combined with this is a variable (here referred to as D) that is set to either 1 if the fielder made the play, or 0 if they did not. With those Out Rates in hand, determining how much credit to assign to each component is simple subtraction:
Positioning= A – B
Range = C – B
Throwing = D – C
An example may help to make things clearer. Take a groundball hit up the middle over the pitcher’s mound, just barely on the third base side of the field. The majority of shortstops wouldn’t make this play given where they would usually be standing, so Out Rate A is low, say 0.2.
However, the shortstop in this instance was positioned well, and so they only have to move a few feet to field the ball. Given that it’s a relatively easy play when the fielder’s position was known, Out Rate B is reasonably high—let’s say 0.7. In other words, 70 percent of shortstops make this play when they’re standing where this one was in relation to where the ball was heading.
This shortstop has particularly good instincts (we’ll call them Ambrelton Timmons) and they get to the ball quicker than an average shortstop would. Because of the extra time afforded to the shortstop to get the ball to first base, their expected out rate makes another jump—Out Rate C is then 0.9. And, predictably, the shortstop makes the out, so D is 1.0.
On this play, here’s how the shortstop’s credit would break down:
Positioning= 0.7 – 0.2 = 0.5
Range = 0.9 – 0.7 = 0.2
Throwing = 1.0 – 0.9 = 0.1
Of course, those components are all still in the units of plays saved, and they still have to be converted to runs. But that right there is the essence of how the PART System works. Instead of receiving 0.8 plays’ worth of credit (1.0 – 0.2), the shortstop here would only receive 0.3 plays’ worth of credit (1.0 – 0.7), split between range and throwing. Of course, it’s actually slightly more complicated than that.
One adjustment that needs to be made is for poorly positioned fielders on plays where the team was well positioned. The most common example of this is a play in which the team in the field is employing a shift—the second baseman moves over to short right field, and the shortstop moves over to the right-hand side of second base. On a ball hit to the shortstop, the second baseman would initially be determined to have been positioned poorly. While a traditionally positioned second baseman may have been able to make the play, the one in this example had no chance because of their positioning in shallow right field. However, the ball was hit straight to the shortstop, so the team was still positioned well.
To account for this, adjustments are made such that no fielder can receive negative positioning credit when their team is positioned well, and no fielder can receive positive positioning credit when their team is positioned poorly.
The other primary adjustment, at least on shift plays, arises from the fact that multiple fielders are assessed on each play. When a ball is fielded by a shallower fielder, the deeper fielder’s range obviously should not be penalized, as it was impossible to know if he would have made the play or not. So, on shift plays, any fielder who was positioned deeper than the one who first touched the ball will not receive any range credit or debit.
Furthermore, the fielder that first touched the ball on these plays will “steal” the out rates from those behind them. This is done to prevent players from being over-credited when they make a play that would have otherwise been easy for the fielder behind them. For example, on a routine grounder to the shortstop, the third baseman decides to instead cut the ball off and make the play himself.
The third baseman may have had a low chance of converting the out, but they would not receive credit as if it were a difficult play because it was not, at least for the team. Whatever the shortstop’s expectation of making the play was would be added to the third baseman’s, and the third baseman’s range credit would then be determined based off that new expected out rate. If the third baseman’s initial out rate was 0.05 and the shortstop’s was 0.90, the third baseman would be debited 0.95 plays’ worth of credit.
Conclusion
The PART System has replaced the Range & Positioning System in DRS going back to 2013, the first year for which SIS collected the infield starting position data. Going forward, SIS will continue to make improvements to the PART System and DRS as a whole as it continues to strive toward its goal of being at the forefront of defensive analytics.
| Most Important Takeaways |
| Positioning is no longer factored into a player’s Defensive Runs Saved total
This system allows for the evaluation of all infield plays, not just ones involving an unshifted defense
Transition from evaluating: “How often did a player make that play?” to “How often did a player make that play given where they were positioned?” with the PART System
The result is a more accurate overall depiction of defensive performance |
This article is adapted from The Fielding Bible – Volume V. For more information on this stat, check out FieldingBible.com