Sports Info Solutions
Category: Football
-
Reviewing Our Grades for the 2023 NFL Draft Class
By
We use some statistical evaluation to determine which teams fared best with their picks and how we did with our rankings
-
2026 SIS NFL Draft Grades
By
Which teams had draft classes that we liked? And how did what happened compare to what’s on our site?
-
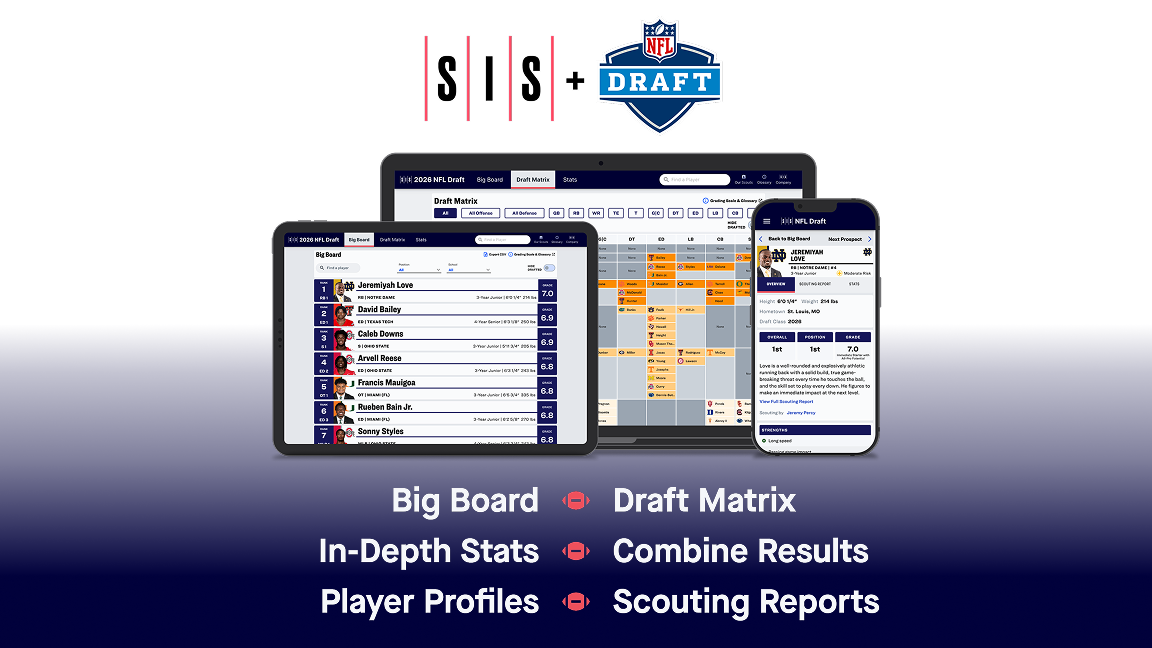
What Makes Our Draft Site Special?
By
Our whole ethos when preparing the draft site is to make the user feel like they’re in the war room
-
2026 SIS Scouting Staff Mock Draft (Version 2.0)
By
In an NFL Draft that possesses a lot of talent at the top with really good depth in a handful of positions, what are teams going to do come Draft night? Who goes No. 2 overall? How many offensive tackles hear their name called in Round 1? Using traditional scouting and analytics in conjunction with…
-
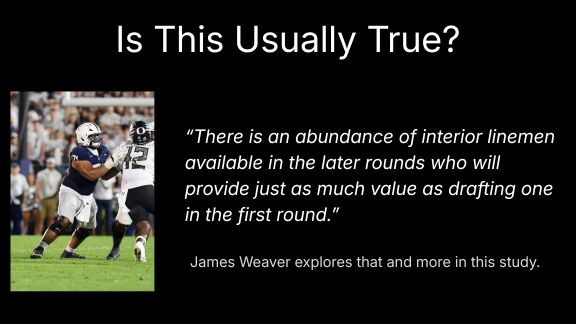
Study: Evaluating Positional Value in the First Round of the NFL Draft
By
We explore the general tendencies regarding how value disperses across a draft.
-
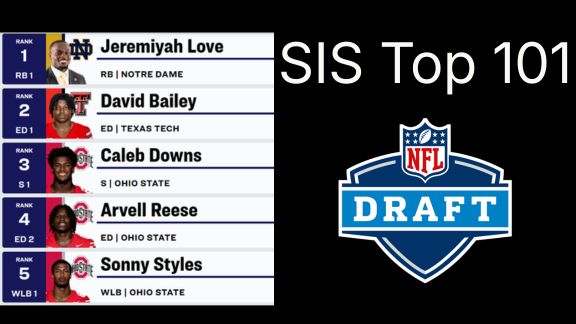
2026 “SIS 101” – Final Rankings
By
The final version of our Top 101 players entering this year’s NFL Draft.
-
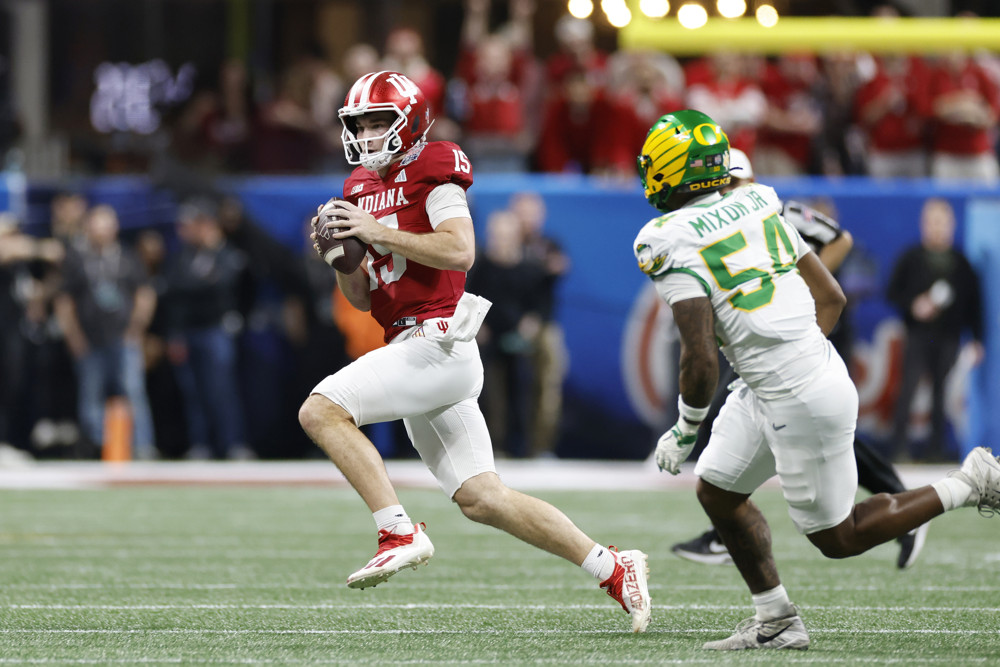
Under Pressure: Fernando Mendoza and the 2026 QB Class
By
One question that helps separate good evaluations of QBs from great ones: What happens when the pocket breaks down?
-
Nathan Cooper’s First & Final 2026 Mock Draft
By
Our associate director of football operations makes his selections.
-
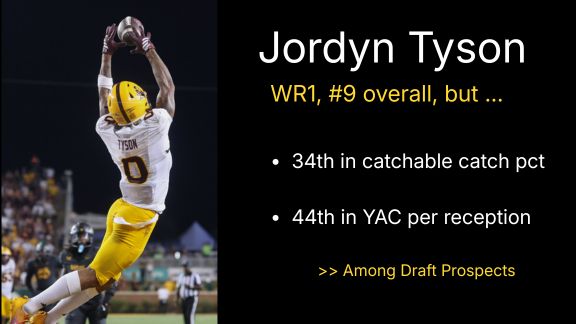
Scouts vs Stats: NFL Draft Prospects Whose Grades & Numbers Don’t Match
By
There isn’t always agreement, so let’s look more closely at where the differences are on some notable players
-

2026 NFL Draft: Fernando Mendoza Scouting Report
By
An NFL Draft scouting report for Indiana quarterback Fernando Mendoza.