Sports Info Solutions
Category: Football
-
-
-
NFL Draft AnalySIS: Arizona Cardinals
By
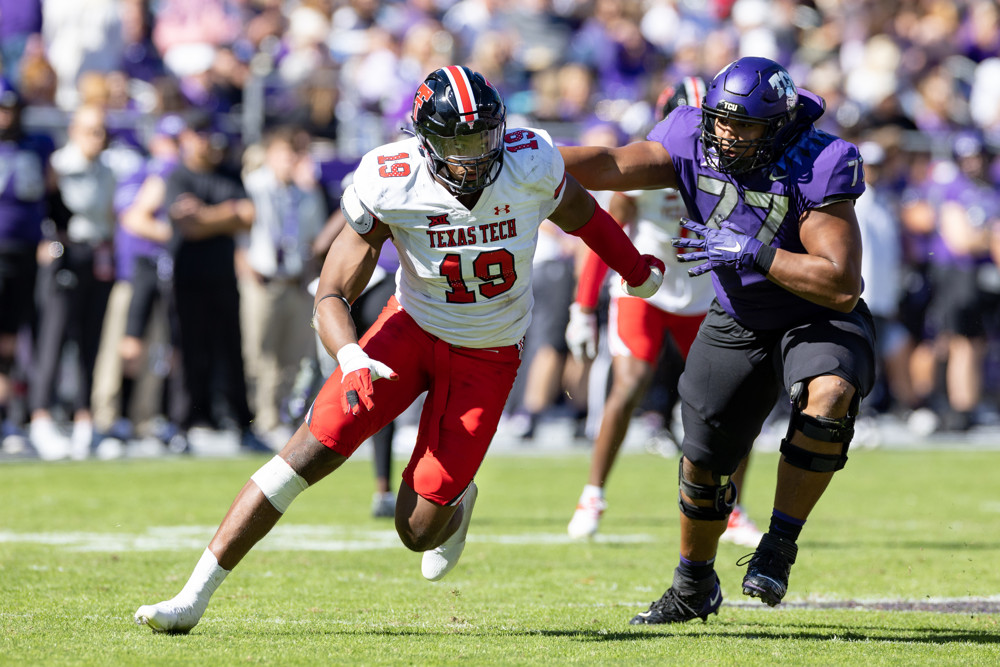
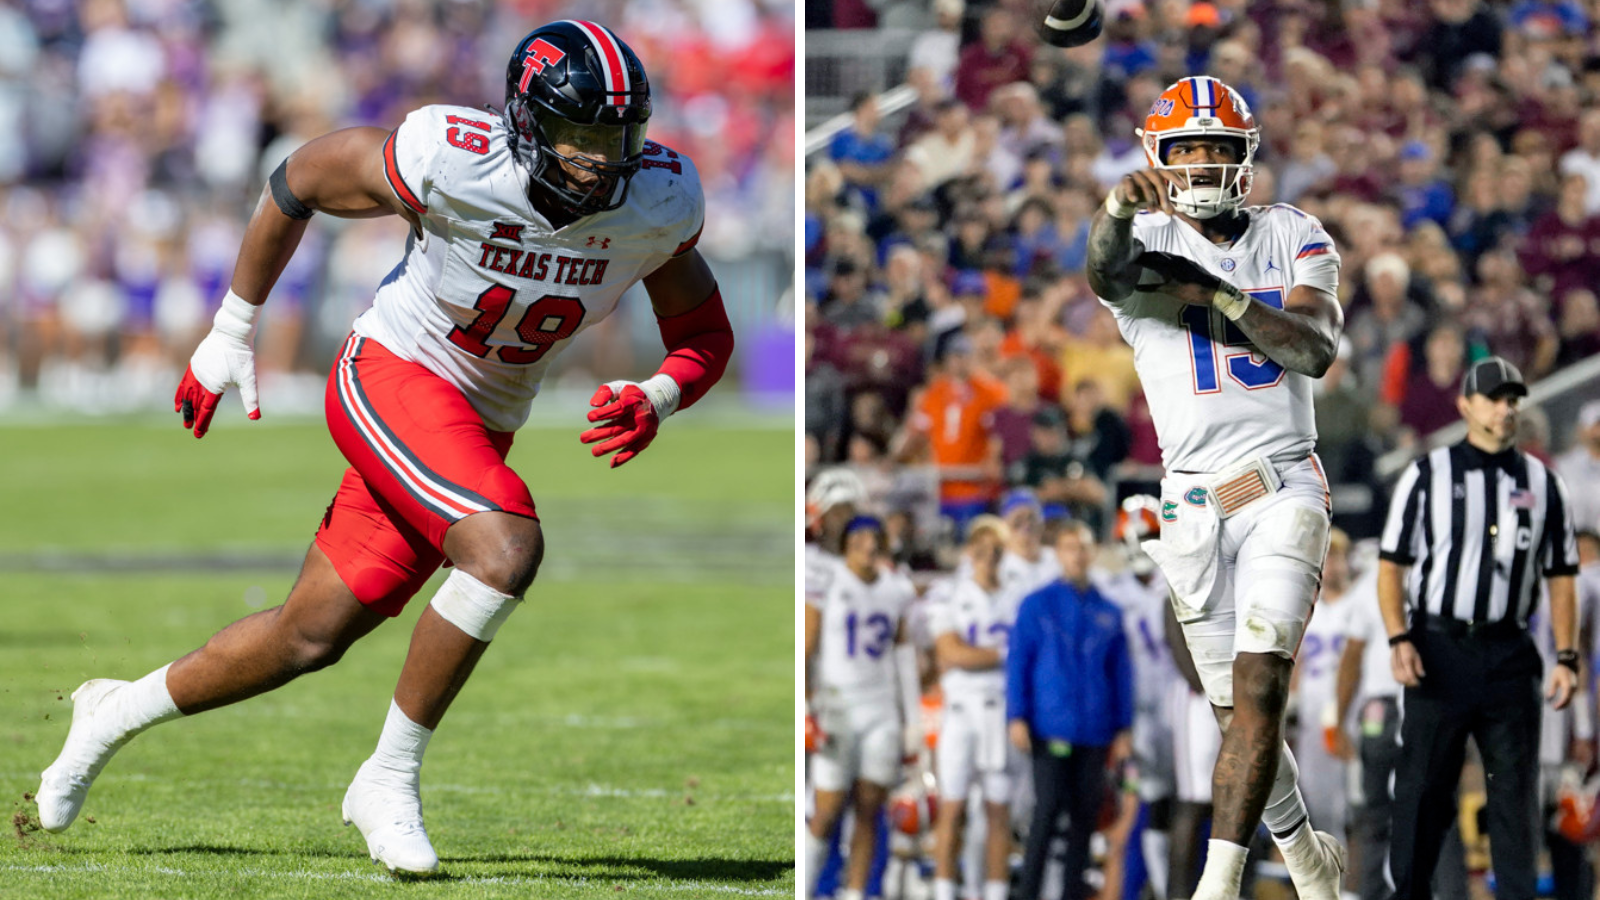
The Cardinals have so many needs. Tyree Wilson is among a few players that they could be targeting.
-
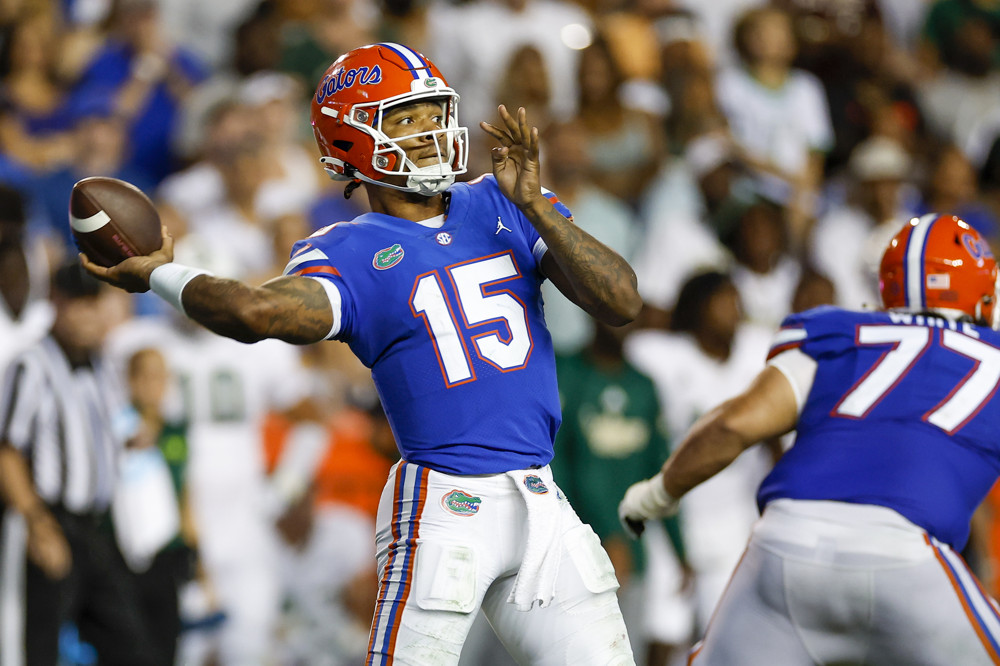
Anthony Richardson’s Accuracy: A Closer Look
By
A closer look at a QB with one big flaw – but better than several smaller ones
-
Which NFL teams Would Be Most Justified In Drafting For Need?
By
Some teams may be better suited for this than others. We came up with a system to identify and analyze some of the most intriguing fits to do this.
-
NFL Draft AnalySIS: Indianapolis Colts
By
Will Levis is a good fit in the Colts’ new system but he’s a bit risky, so let’s look at a few alternatives too.
-
NFL Draft AnalySIS: Seattle Seahawks
By
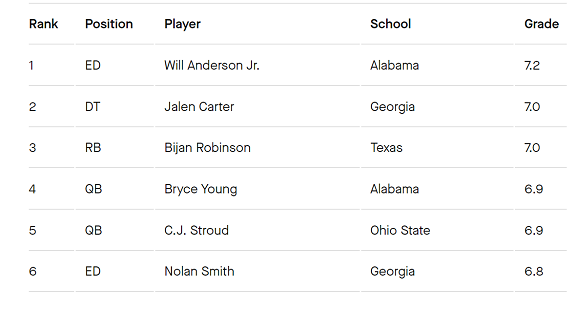
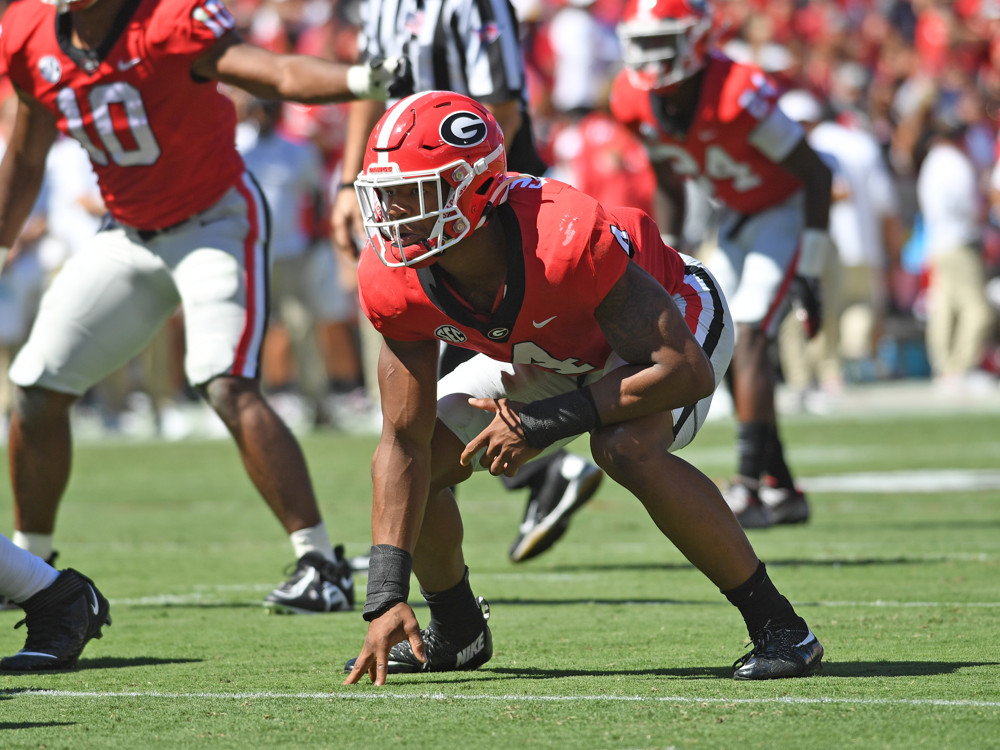
Will Anderson “would be hard to pass up” … but who else is a good fit if the Seahawks decide to go/have to go a different way.
-
NFL Draft AnalySIS: Detroit Lions
By
It could be the third straight season that arguably the best player in the Draft falls to the Lions. But who might that player be?
-
2023 NFL Draft AnalySIS: Las Vegas Raiders
By
Do you want a guy who can get the QB or a QB itself? We’ve got the options covered.
-
2023 NFL Draft AnalySIS: Atlanta Falcons
By
This team needs some more defensive prospects, so we’ve got a list of ones (plus a QB) that fit their needs.