I’m sure since the world turned upside down you’re frequently thinking about what life was like in 2019. Let’s take that skill and apply it to the 2019 NFL Draft discourse.
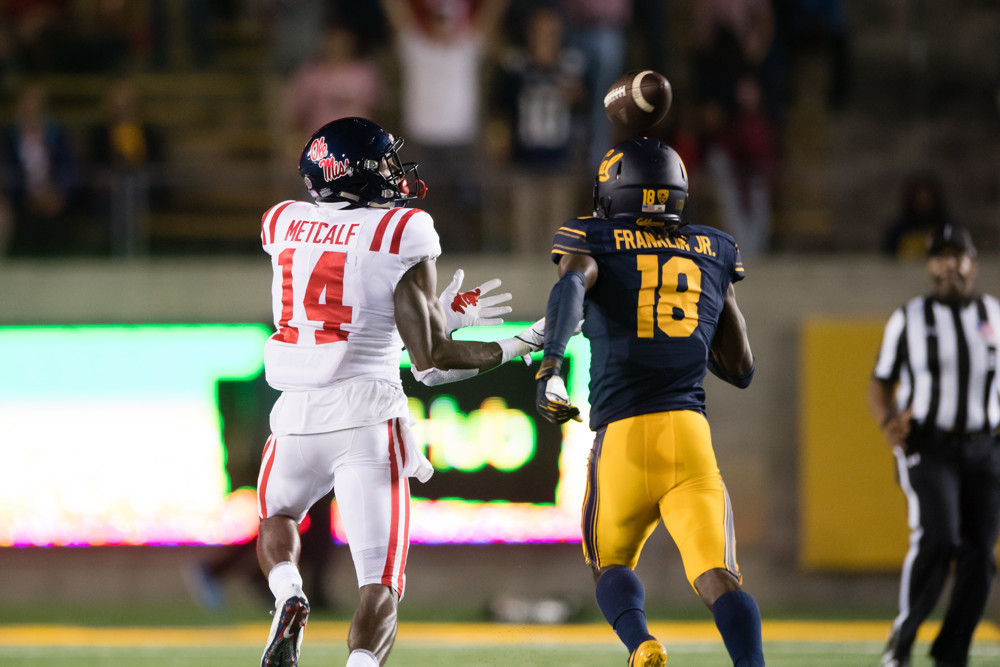
At that time, there were a lot of questions about DK Metcalf. He was a physical marvel who didn’t have enough of a track record—and specifically a track record of running a full NFL route tree—to be a top prospect.
We can frame Metcalf’s limited route diversity at the time in a few ways. A relatively simple version is to just count how many routes he ran at least 5 times over his last two years at Ole Miss. SIS charted just nine, which is fewer than almost every receiver to enter the NFL over the last four seasons (among those with at least 150 routes run in their final two FBS seasons).
Metcalf obviously turned that narrative on its head when he showed his physical tools to be more than sufficient to overcome whatever limitation he had in experience. Most players aren’t in that position.
So what can we learn about the value of a strong route tree in projecting into the NFL?
Below are a few angles at what it means to have a route tree that might be desirable to NFL evaluators, and how useful they might be in identifying quality prospects.
For this, the sample is limited to wide receivers drafted in 2019 or later who ran at least 150 routes over the two seasons prior to being drafted. In terms of their NFL performance, we’ll look at results over their first two seasons as professionals.
When you see references to a player producing a WR1 or WR2 season, we want to show how often they played well enough to be a team’s top receiver or second-best receiver in a given year. So, a population of players having a WR2 % of 36% means that 36% of players achieved a top-64 season at least once in their first two years.
Running a variety of routes
As done above with Metcalf, we can look at players who simply ran a wide variety of routes in college. As we know always and in all situations, more is better!
Are teams selecting for this?
Not really. Receivers drafted in the first three rounds have averaged 15.8 routes run at least 5 times. Those who are Day 3 picks or go undrafted have averaged 15.1. And that’s with more than half of the players in the late/undrafted group being in the bottom third in this metric, which really drags down the average.
Does it project success in the NFL?
A little bit, and not in the way you might expect.
Among receivers selected in the first three rounds, only 2 of the 14 who were in the top third in route variety had at least one top-32 year at the position (by Total Points).
Of the 44 qualifying players in the middle or bottom third in route variety, 14 of them had a top-32 season (more than twice as often by proportion).
Early NFL Production of Top-Three-Round Selections
| WR1 % | WR2 % | |
| Top-third route variety (n=14) | 14% | 36% |
| Lower route variety (n=44) | 32% | 55% |
Early NFL Production of Late Selections and Undrafted Players
| WR1 % | WR2 % | |
| Top-third route variety (n=16) | 0% | 13% |
| Lower route variety (n=82) | 4% | 10% |
This suggests that variety of routes might actually be a red herring in terms of finding top talent (bolded for emphasis)
We don’t see enough top-32 seasons among late picks to say much about that group, but if we expand the search to top-64 campaigns, route variety might have a small benefit in terms of productivity.
Looking at this year’s prospects…
To whatever extent we might be worried about players with “too much” route diversity, the names to look at would be BC’s Zay Flowers and UNC’s Josh Downs.
At the low end, TCU’s Quentin Johnson and Tennessee’s Jalin Hyatt are not nearly at Metcalf level, but they’re solidly in the bottom third.
Running “NFL routes”
Logically, we can think of the routes a receiver prospect runs through the lens of the most common routes NFL receivers run. To put a point on it, more than half of NFL routes come from just the five most common routes, and more than three-quarters come from the top 10.
Most common routes for NFL receivers
- Curl
- Dig
- Go
- Out
- Slant
- Post
- Fade
- Deep Cross
- Corner
- Screen
So, we could think of a player’s NFL-readiness in terms of how often they run routes that NFL receivers run.
Are teams selecting for this?
They’re selecting for it, but not within the draft. The rates of receivers running the top 10 NFL routes are virtually identical between early and late picks. But 80% of the routes run by NFL-caliber college players are NFL-caliber routes, which is roughly the same rate the NFL players run them. So there’s definitely alignment in that sense.
Does it project success in the NFL?
Yes, but specifically when it comes to the players at the bottom of the spectrum. The players in the bottom third in terms of running NFL routes perform worse than others drafted in a similar range.
Early NFL Production of Top-Three-Round Selections
| WR1 % | WR2 % | |
| Bottom-third NFL route volume (n=17) | 12% | 47% |
| Higher NFL route volume (n=41) | 34% | 51% |
Early NFL Production of Late Selections and Undrafted Players
| WR1 % | WR2 % | |
| Bottom-third NFL route volume (n=35) | 3% | 6% |
| Higher NFL route volume (n=63) | 3% | 13% |
Depending on when the player is selected (and what you’d want from a pick in that range), the players who run relatively few routes from the NFL tree are substantially less likely to produce a quality season in their first two. So it seems like variety might not be the key, so much as running the routes that matter to NFL productivity.
Looking at this year’s prospects…
Two Tennessee receivers (Hyatt and Cedric Tillman) sit towards the top of this list, showing that while they might not be running a variety of routes, but the ones they’re running project to NFL usage. Quentin Johnson also shows up here, suggesting reduced route diversity comes along with running a lot of NFL routes.
And would you look at that: The players towards the bottom of NFL route frequency are the variety kings, Flowers and Downs.
Mirroring the NFL route tree
We can take this notion of reproducing the NFL route tree a step further and identify players whose rank order of their routes closely resembles the NFL route tree.
For example, if deciding between two receivers who each ran the same total percentage of NFL routes, all-else-equal we’d prefer the one who ran more curls and outs over the one who was running a lot of deep crosses and corners.
(There’s a bit of a confounding element of the player’s speed here—a promising deep threat might be more likely to run the top end of the route tree. We’ll get to that.)
To get at this question, we can take the average deviation between the player’s rank order of their routes and the NFL average rank order, focusing on the fifteen most common routes. That group makes up 90% of NFL routes, and going too deep into the route tree could cause deviations that unfairly skew the results.
Are teams selecting for this?
There’s a little evidence that teams might care about this beyond the first few rounds, but it’s pretty flimsy. Players in the top third or bottom third in this deviation metric are more common among those added after the first two days of the draft. But early selections aren’t running route trees any more (or less) similar to NFL route trees, which is consistent with the previous analysis.
Does it project success in the NFL?
There is a bit of signal here as well. We can see that there is a difference when it comes to players with what we might call a “deviant” route tree—the upper one-third in average deviation from the NFL route tree.
Early NFL Production of Top-Three-Round Selections
| WR1 % | WR2 % | |
| Top-third route tree deviation (n=17) | 6% | 29% |
| Lower route tree deviation (n=41) | 37% | 59% |
Early NFL Production of Late Selections and Undrafted Players
| WR1 % | WR2 % | |
| Top-third route tree deviation (n=35) | 6% | 14% |
| Lower route tree deviation (n=63) | 2% | 8% |
Like with the overall NFL-caliber-route analysis, players who don’t conform to the NFL standard who are drafted early are much less likely to produce a top season early on.
Interestingly we see the opposite relationship among players not drafted early, where the players who deviate from the NFL prototype have done a bit better. Technicians like Amon-Ra St. Brown and Hunter Renfrow are examples of the type of skill set that can buck this trend.
Looking at this year’s prospects…
We get some new names when it comes to adhering to the hierarchy of the NFL route tree: LSU’s Kayshon Boutte and Ole Miss’s Jonathan Mingo.
However, we get even more concerning evidence for the prospects of Zay Flowers and Josh Downs, who are towards the deviant end of the spectrum.
So what did we learn?
Offensive schemes differ enough that there isn’t a one-size-fits-all approach to route tree analysis that’s ever going to give us a great projection into NFL productivity. However, we can see some broad strokes of what teams look for and how useful those traits are.
More is not necessarily better when it comes to route variety. Players drafted in the first three rounds who have been asked to do a lot more in college are actually less likely to show top performance early on in their NFL careers.
If we instead focus on the routes that NFL receivers run most often, and specifically with a frequency that aligns with what NFL receivers run, we start to see an effect.
This is a disqualifier more than a feather in a player’s cap, though, because the biggest effect is for players who are at the low end of the spectrum (i.e. have the least alignment with NFL-level route trees).
Players who come off the board in the first two days without showing they can run an NFL-like route tree are much less likely to produce like a top-level player early on.