Sports Info Solutions
Category: Football
-
Stat-Based NFL Player Comparisons for the 2020 QB Class
By
Joe Burrow = Baker Mayfield? Jalen Hurts = Kyler Murray? There’s math to how we got those comparisons.
-
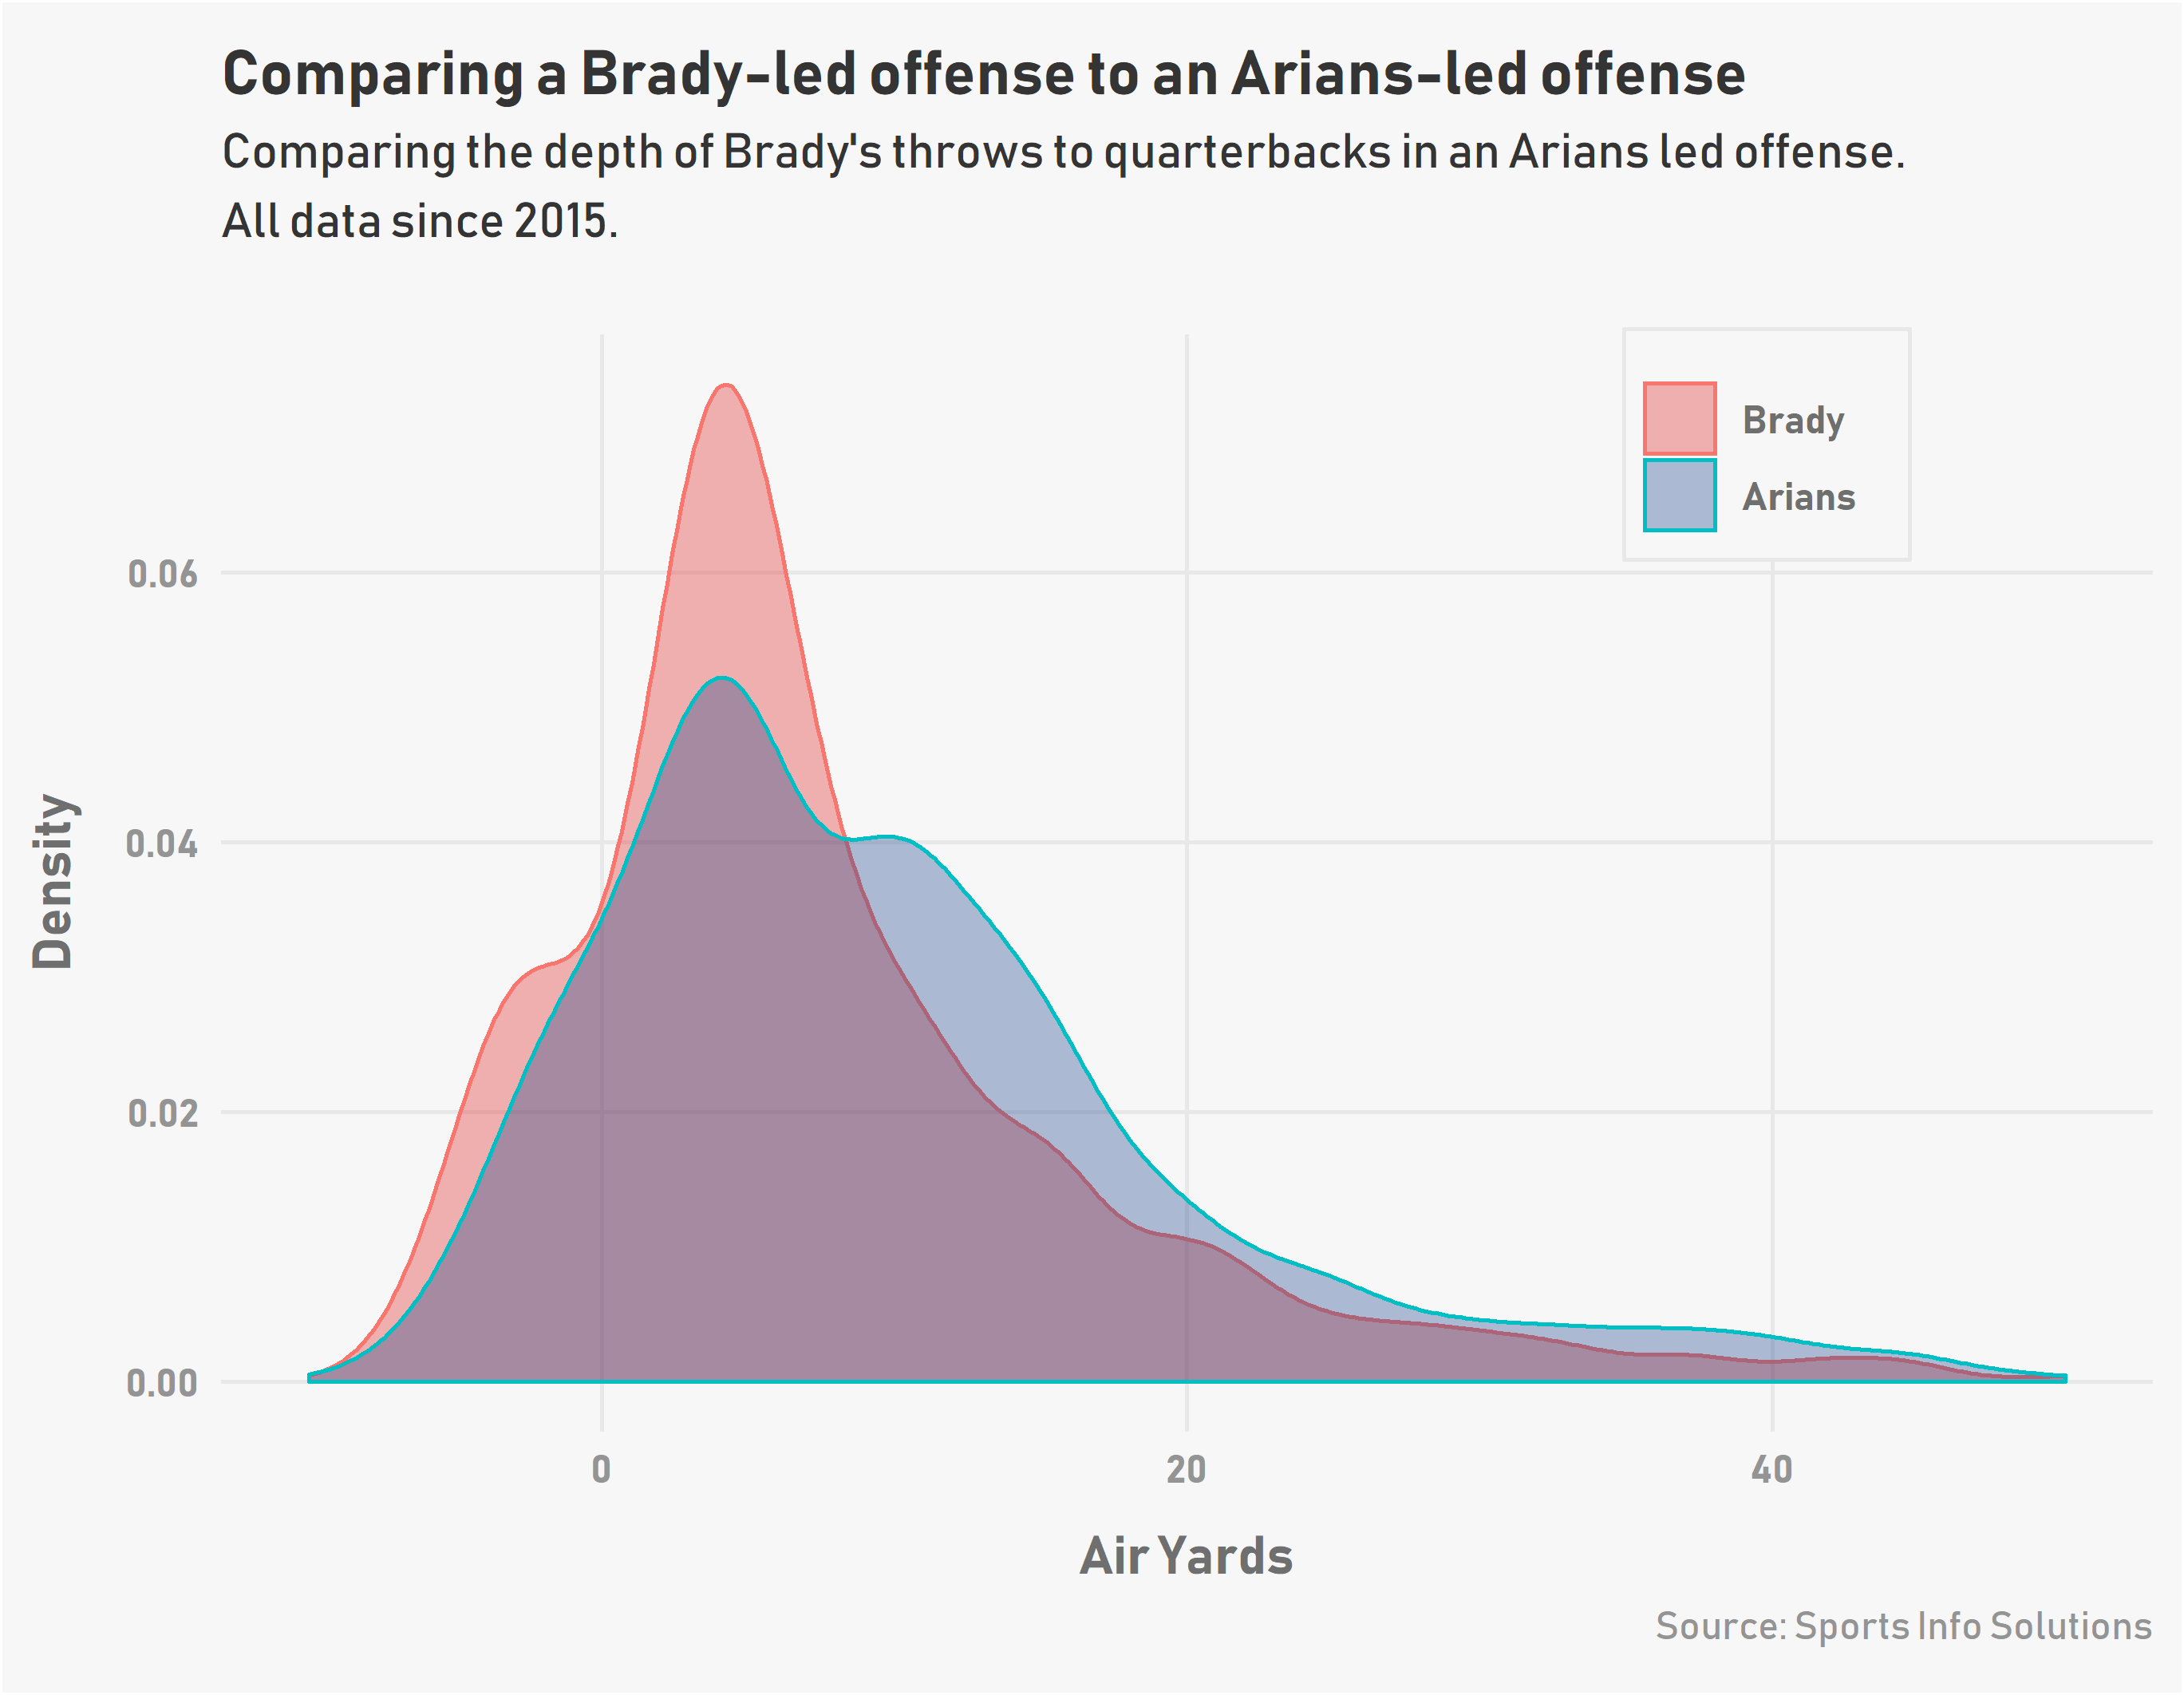
How does Tom Brady fit into a Bruce Arians offense?
By
Does Brady do the things that Bruce Arians likes?
-
Evaluating the best values in free agency by our Total Points metric
By
The really good buys seem to be coming on the defensive side. We explore the best ones using Total Points.
-
New football podcast: Super Bowl props and previews
By
Who do Matt, Aaron, and Corey think is going to win (and how)?
-
New football podcast: AFC/NFC Championship Game Review
By
Newest episode of the Off the Charts Football Podcast
-
A closer look at the Titans’ scoring tendencies
By
The Titans have an unusual ratio of touchdowns to field goals. How did that come to be based on their play calls?
-
New podcast: Conference Championship Preview
By
A look back at last weekend and a look ahead to this one.
-
-
Who were the best quarterbacks throwing long passes in 2019?
By
Is Russell Wilson as good as some say he is?
-
Using SIS Projections for this Sunday’s Draft Kings games
By
Using our tools to come up with the best fantasy lineup