Sports Info Solutions
Category: NFL
-
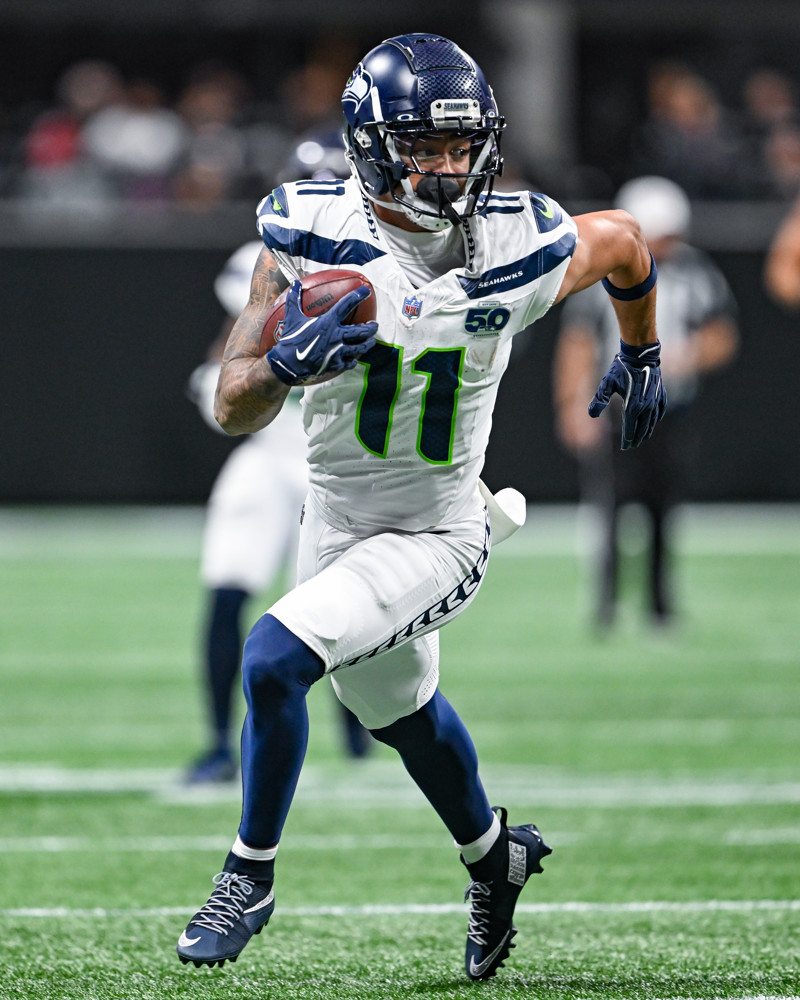
Stat of the Week: The Super Bowl Pass Catchers
By
When we isolate specific receiving skills, we see that the Seahawks and Patriots have two of the top-performing units in the NFL
-
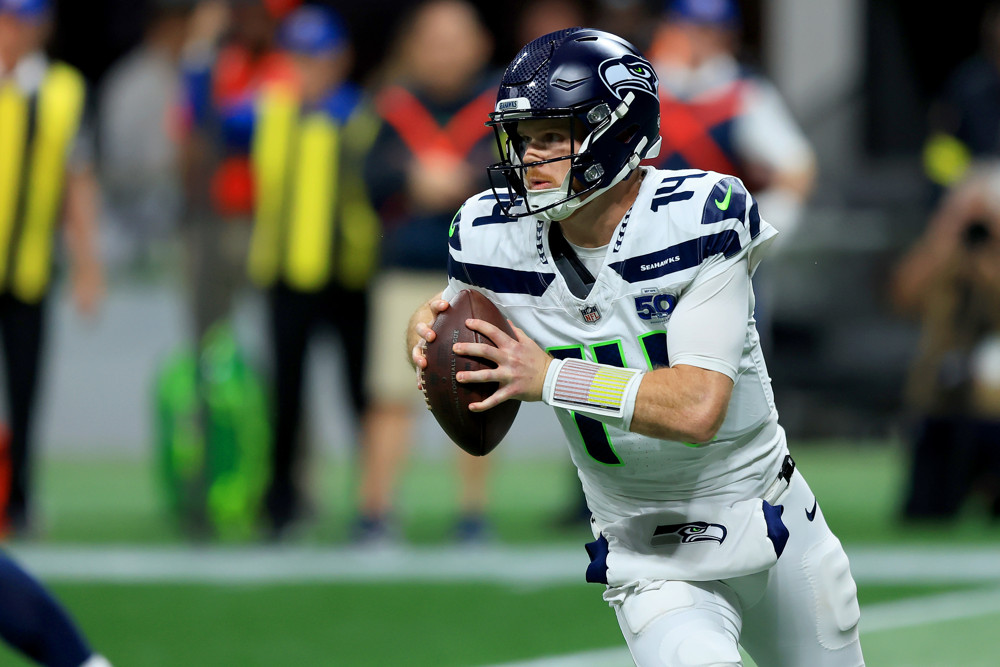
Optimistic and Pessimistic Takeaways for the Seahawks and Rams After Week 16
By
The Seahawks came away with the win in a pivotal division game, but the Rams might have fewer questions to answer heading into the playoffs.
-
-
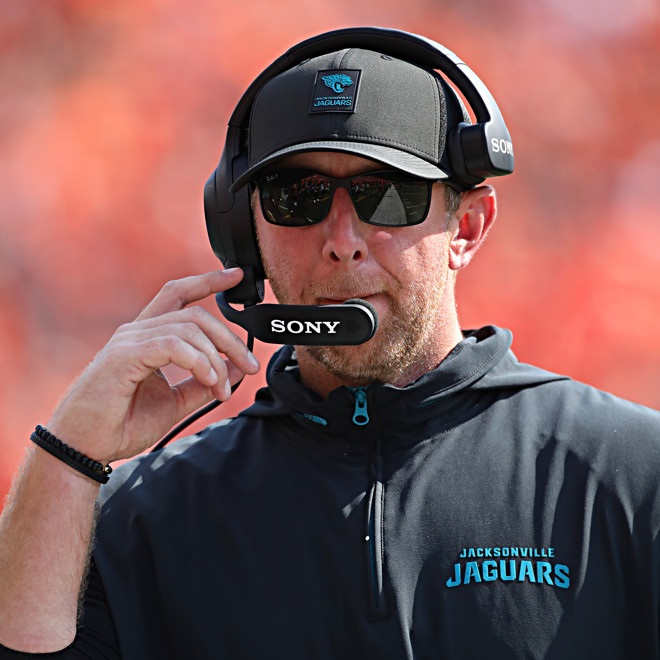
What Liam Coen Means When He Says It’s 100% A Go
By
The Jaguars seemed to pull defeat from the jaws of victory against the Bengals on Sunday, enough so that head coach Liam Coen had to answer for a particular fourth down play late in the game. With just under 4 minutes left and a 3-point lead, they chose to go for a 4th-and-5 from the…
-

A New Expected Points Model
By
Learn about an adjustment we made to make our model more effective at the end of halves and games
-
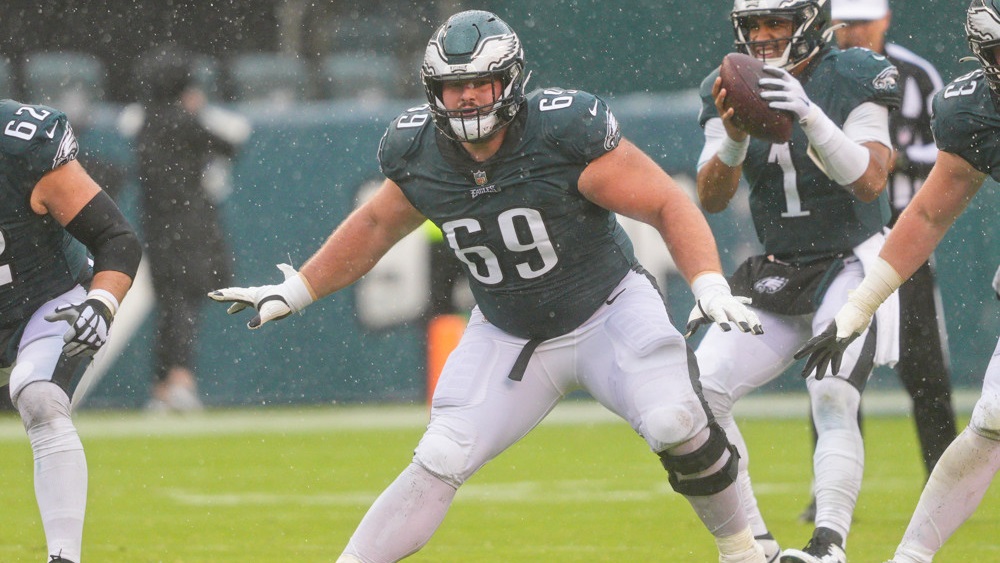
Who would have won NFL Protector of the Year in 2024?
By
We use our stats to evaluate who the best offensive linemen was last season.
-
Reviewing Our Grades for the 2022 NFL Draft Class
By
The Seahawks’ 2022 class ranked 7th in our initial post-draft evaluation. But they vaulted to No. 1 with their actual performance. See how all the teams fared here.
-
Which Teams Had The Best Draft Classes: 2019-2022?
By
The Chiefs rank at the top of the list. But where do the other 31 teams fall?
-
How Does Donovan Jackson Fit With the Minnesota Vikings?
By
Photo: Ian Johnson/Icon Sportswire The Minnesota Vikings came into the 2025 NFL Draft with major needs at defensive back and offensive line. Many mock drafters, including ourselves, had Minnesota taking a safety to provide a spark for their secondary. However, Vikings general manager Kwesi Adofo-Mensah had other ideas. The Vikings selected left guard Donovan Jackson…
-
How Does Nic Scourton Fit With The Carolina Panthers?
By
Scourton will need to get used to playing in a 2-point stance. But he brings a lot of things that fill an immediate need.