Category: NFL

  • 5 Observations About Brock Purdy

    5 Observations About Brock Purdy

    I love a good underdog story as much as anything in sports, so I’m fully into the idea of a player who was picked last in the most recent NFL Draft being one win away from being a starting quarterback in the Super Bowl.

    That got me to looking up stats about Brock Purdy and the 49ers matchup with the Eagles on Sunday. Here are five things I found.

    1) Brock Purdy has been really good

    Purdy made his first appearance in this eight-game run in Week 13 against the Dolphins. Since then (and including postseason), he’s No. 2 in Passing Points Earned Per Play, trailing only Jared Goff of the Lions. He remains No. 2 if we look at Points Above Average Per Play on all plays (not just passes).

    He’s been worthy of the recognition.

    2)Intermediate throws

    What’s been the key to Purdy’s success?

    One important number is how he’s fared on intermediate passes, those thrown 10-to-19 yards downfield.

    He’s 33-of-46 for 648 yards on those passes since Week 13. The 72% completion percentage on those throws is the best in the NFL in that span. He went 5-of-6 for 95 yards on them against the Cowboys in the Divisional Round. Three of those throws helped set up short field goals for Robbie Gould. The other turned into a 30-yard completion to George Kittle that set up Christian McCaffrey’s go-ahead touchdown run in the fourth quarter.

    3)An Eagles edge

    A look at our Trenches tool on The 33rd Team’s website shows a distinct advantage for the Eagles pass rush against the 49ers pass blockers.

    Philadelphia ranks No. 1 in Pass Rush Points Saved on a per-play basis this season. Their opponents have had the highest blown block rate on pass attempts of any team in the league.

    The 49ers offensive line ranks 26th in Pass Block Points Earned Per Play. In other words, this is a highly unfavorable matchup for them.

    For his part, Purdy ranks 7th in Passing Points Earned Per Play when under pressure since Week 13 among the 30 quarterbacks with the most attempts.

    4)Berry, Berry Good

    Purdy is also going to have to deal with the best-playing cornerback he’s seen in his run of success in James Bradberry.

    Bradberry ranked tied for 4th in Total Points among defensive backs this season (though some might argue he’s not even the best corner on his team).

    Opponents completed 26-of-73 passes against Bradberry this season. The 36% completion percentage against was the lowest in the NFL.

    Daniel Jones didn’t have any luck. He was 0-for-2 with an interception when throwing at Bradberry.

    5) Watch what happens from in close

    Against the Cardinals and Seahawks in Week 18 and the Wild Card Round, the 49ers made it work at a high level of effectiveness once they got inside the red zone.

    Purdy was 8-of-11 for 4 touchdowns in the red zone and 4-of-5 from the 10 or closer. He did this through short passes. All four of the touchdowns came on goal-to-go from the 7-yard line or closer.

    Purdy was 4-of-8 on passes from the 10 or closer from Weeks 13 to 17 and 1-of-2 for 2 yards against the Cowboys.

    The Eagles are tough to pass against inside the 10. Their defense ranks 5th in positive percentage allowed on passes (25%) but last in positive percentage allowed on runs (57%) (for those unfamiliar, positive percentage is the percentage of positive plays allowed that the opposing offense accrues).

  • Stat of the Week: NFL’s Top Quarterbacks

    Stat of the Week: NFL’s Top Quarterbacks

    We’ll take a break from baseball for a week* to touch on one angle from the end of the NFL’s regular season – Who were the NFL’s best quarterbacks?

    We can use our all-encompassing player value stat, Total Points to answer that question.

    Here’s the leaderboard for quarterbacks for Total Points this season.

    Total Points is our answer to the question: “How many points on the scoreboard was this player worth, based on his play-to-play contributions?”

    It takes nearly everything that our Video Scouts measure about a play and uses it to evaluate each player on a scale that allows you to compare them more easily. You can learn more about it here.

    Player Team Total Points
    Patrick Mahomes Chiefs 195
    Josh Allen Bills 140
    Justin Herbert Chargers 131
    Jalen Hurts Eagles 128
    Jared Goff Lions 121
    Trevor Lawrence Jaguars 120
    Joe Burrow Bengals 116
    Kirk Cousins Vikings 104
    Tua Tagovailoa Dolphins 100
    Daniel Jones Giants 100

    What Aaron Judge was to MLB this season, Patrick Mahomes was to the NFL. Mahomes had a Superman level season. He was the runaway leader in Total Points. He led the NFL in passing yards (5,250) and touchdown passes (41) by wide margins.

    The separation between Mahomes and 2nd-place finisher Josh Allen this season was 55 points, three points more than the difference between Allen and Geno Smith, who ranked 11th.

    Mahomes’ 11.5 Total Points per game is the best for any quarterback since SIS began tracking the stat in 2016.

    If Mahomes was Judge, Allen was Shohei Ohtani. He was a dual threat, finishing 9th in Passing Total Points and 3rd among all players in Rushing Total Points, two of the components in the overall Total Points stat.

    Here are the leaders in Total Points among quarterbacks and where they ranked in the stat overall.

    Name Rushing Total Points Overall Rank
    Justin Fields 60.5 1st
    Josh Allen 40.1 3rd
    Jalen Hurts 21.9 8th
    Daniel Jones 19.4 11th
    Lamar Jackson 16.8 13th

    Chargers quarterback Justin Herbert led all quarterbacks in Total Points in 2021. He was good enough to finish 3rd in Total Points in 2022 despite a 53-point drop from last year’s total. Part of the key to his value this season was simply how many plays he was involved in. His 699 pass attempts ranked second in the NFL.

    Jalen Hurts, Jared Goff, and Trevor Lawrence each took big steps forward in 2022 and finished the season ranked No. 4, 5, and 6 in Total Points, respectively.

    Name Passing Total Points
    Patrick Mahomes 180.2
    Justin Herbert 137.6
    Trevor Lawrence 123.5
    Jared Goff 121.3
    Jalen Hurts 105.9

    Hurts, like Allen was a dual threat. He ranked 5th in Passing Total Points and 3rd among QBs (9th overall) in Rushing Total Points. Goff led all quarterbacks in Passing Total Points from Week 10 through the end of the season. Lawrence joined both of them in the Top 5 in Passing Total Points for the season.

    Joe Burrow, who finished 7th in Total Points, picked up where he left off from last year’s postseason. Notably, his sack percentage dropped from 9% to 6%.

    Kirk Cousins, who ranked 8th, finished three spots better than he did in 2021 and five spots better than 2020. The Vikings played an abundance of close games this year. Cousins accrued the 4th-most Passing Points Earned when the score was within eight points.

    We wish the best of health for Tua Tagovailoa, who was the NFL’s best deep passer in 2022. He finished tied with Daniel Jones for 9th. Tagovailoa led the NFL in Passing Points Earned on passes at least 20 yards downfield, completing an NFL best 53% of them. 

    Jones ranked 26th among quarterbacks in Total Points in 11 games in 2021 but thrived under new head coach Brian Daboll in 2022. Jones was another dual threat, throwing for 15 touchdowns against five interceptions (the lowest interception percentage in the league) and rushing for 708 yards and seven touchdowns. 

    Of the top 10 quarterbacks in Total Points only Goff didn’t make the postseason – and the Lions were still alive going into the final week. The other nine will get to continue trying to maintain the excellent level of play that carried them through 2022.

    * If you wish to read some baseball content, check out our piece on the Cubs making a major defensive upgrade with the signing of Cody Bellinger.

  • Sports Info Solutions 2022 NFL All-Rookie Teams

    Sports Info Solutions 2022 NFL All-Rookie Teams

    Sports Info Solutions, a leader in the football analytics space, is pleased to announce its 3rd annual NFL All-Rookie Teams. 

    The teams were selected using a combination of advanced stats and voting among members of our football operations staff, with emphasis placed upon SIS’ player value stat, Total Points. 

    With a loaded edge and secondary class this year, we’ve made sure to honor many of whom have performed extremely well this season.

    The Lions and Seahawks led the way with the most selections this season with four apiece (the Seahawks had three first-teamers, the Lions had two). There were also numerous teams who had three players featured.

    Here are the 2022 Sports Info Solutions All-Rookie Teams and award winners.

    (clicking hyperlinks takes you to their page at The SIS 2022 NFL Draft Website)

    Rookies of the Year

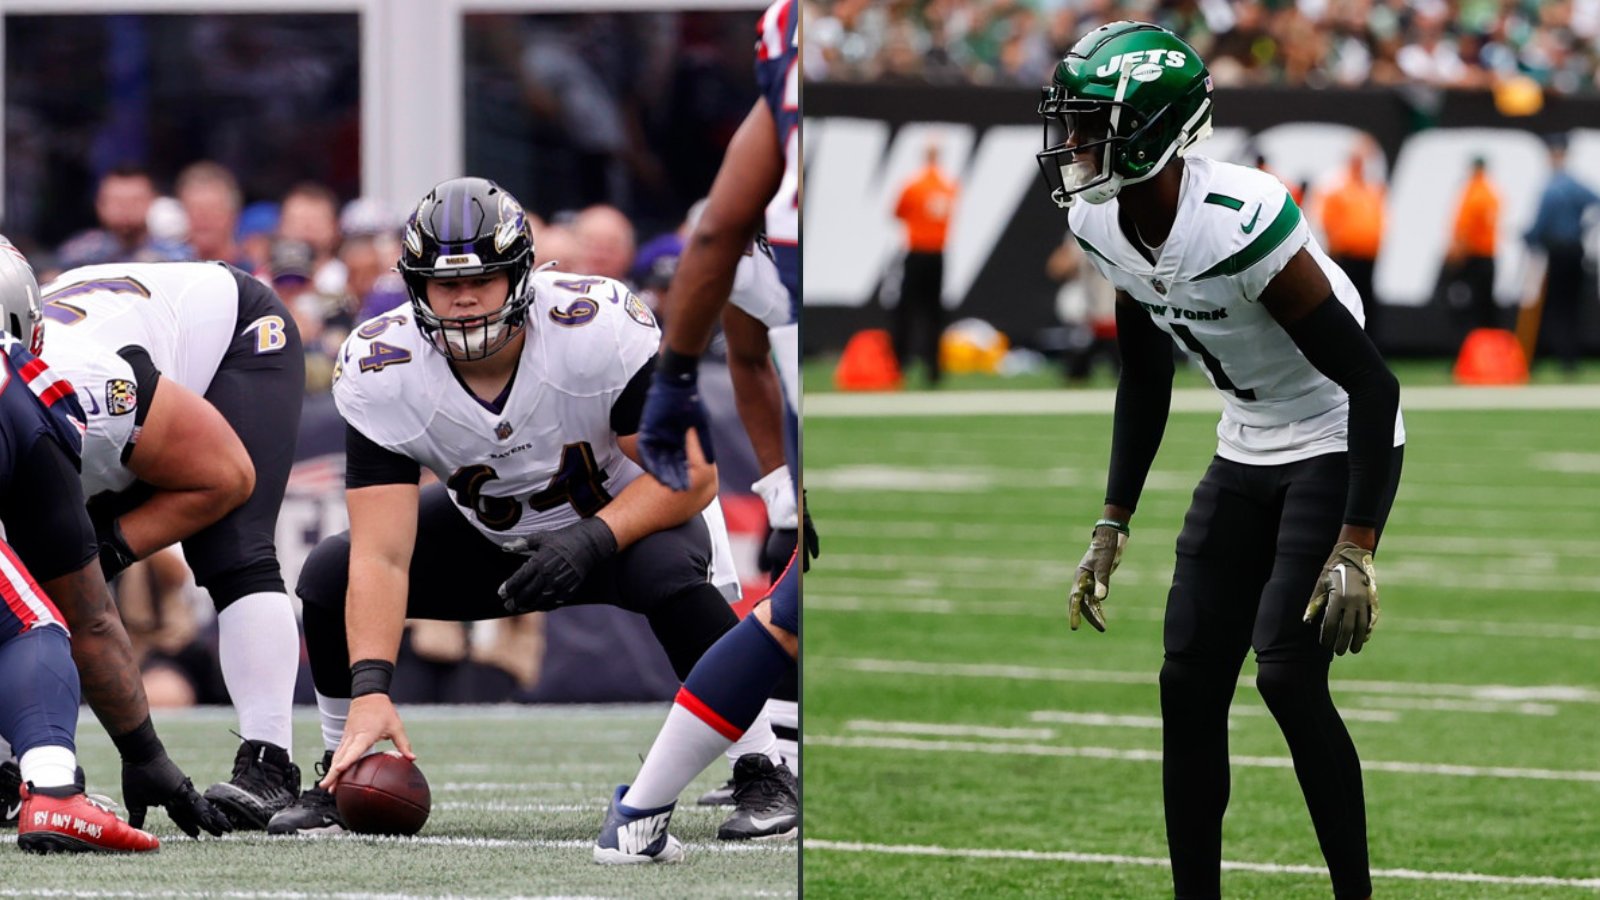
    Tyler Linderbaum of the Ravens wins our Offensive Rookie of the Year after an incredible season. Linderbaum accounted for 43 Total Points this season, helping the wounded Ravens make it into the NFL Playoffs.

    Last season, we had a serious discussion about Creed Humphrey for this award, but we couldn’t justify crowning him over Ja’Marr Chase or Mac Jones. However, this year, the discussion was had and this time the center won out. 

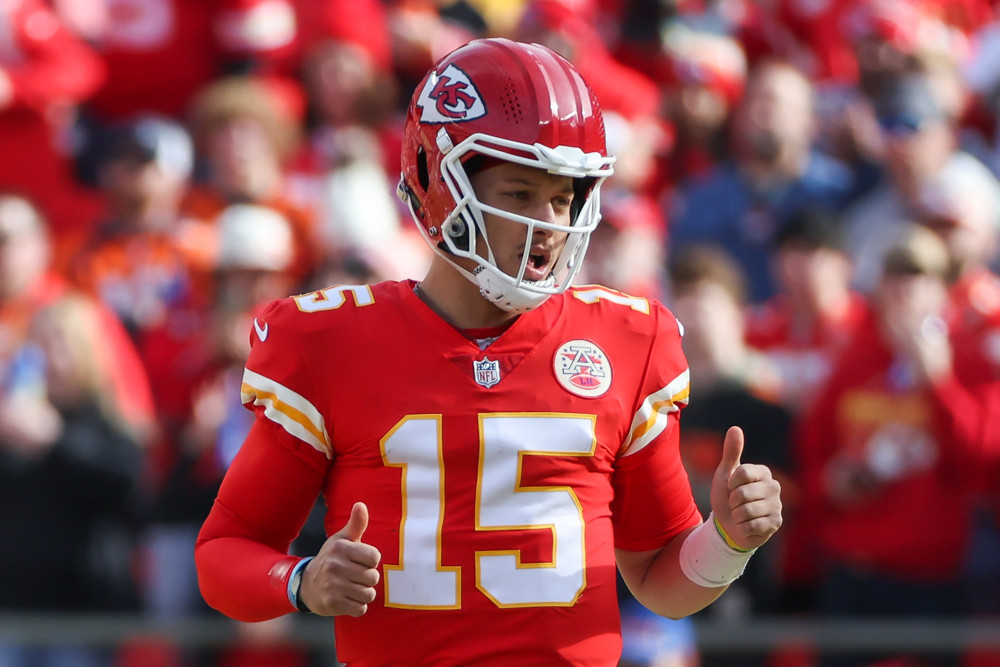
    There were a lot of ways Defensive Rookie of the Year could have gone. Ultimately, we went with the shutdown corner in Sauce Gardner of the Jets. Sauce locked up nearly every weapon opposing offenses threw at him this year on his way to a whopping 64 Total Points, most among rookies.

    Our Special Teams Rookie of the Year goes to a returner. That returner is Patriots CB Marcus Jones. While Jones did contribute well on defense, he was a difference maker as a return man.

    1st-Team Offense
    Position Player Team Total Points
    Quarterback Brock Purdy 49ers 47
    Running Back Tyler Allgeier Falcons 40
    Running Back Kenneth Walker III Seahawks 8
    Wide Receiver Garrett Wilson Jets 28
    Wide Receiver Chris Olave Saints 23
    Tight End Chigoziem Okonkwo Titans 17
    Tackle Abraham Lucas Seahawks 30
    Tackle Tyler Smith Cowboys 27
    Guard Zion Johnson Chargers 35
    Guard Cordell Volson Bengals 26
    Center Tyler Linderbaum Ravens 43

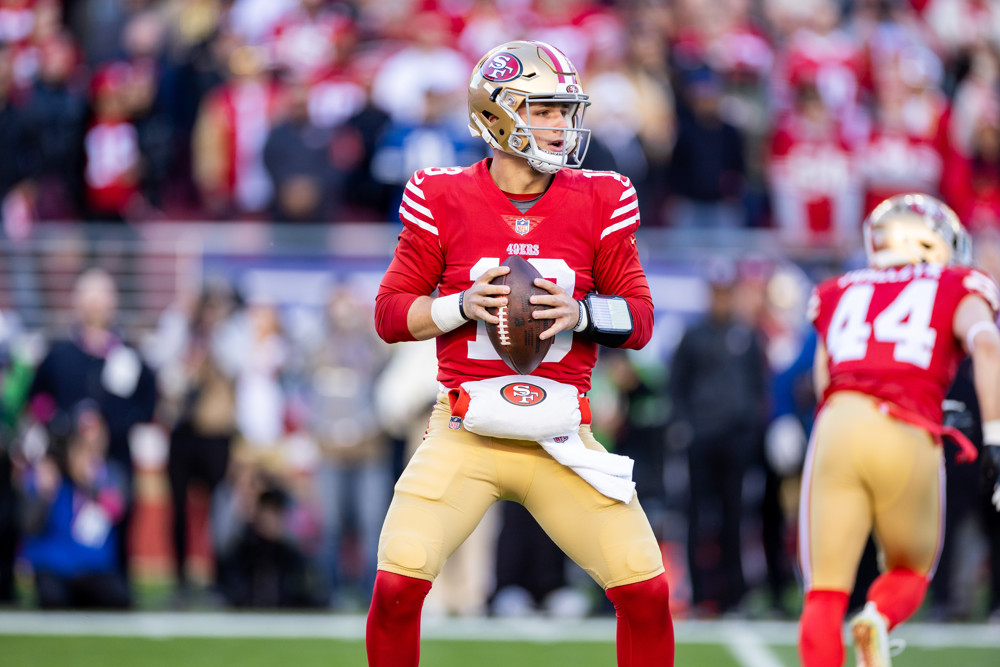
    Quarterback: Brock Purdy, 49ers

    What a story Brock Purdy has been this season. Drafted with the very last pick in the 2022 NFL Draft, Mr. Irrelevant made a huge impact for the San Francisco offense down the stretch. 

    Stuck behind Trey Lance and Jimmy Garrappolo on the depth chart to start the season, Purdy has performed admirably since being called upon. He became the first 49ers QB to win his first three career starts, en route to a 5-0 record after being named the starter. Purdy has the highest IQR (114.2), is tied for the most TD passes (13), and has the 4th-most Passing Total Points (47) among QBs with at least 70 attempts since Week 13.

    Running Back: Tyler Allgeier, Falcons

    After being listed an inactive in Week 1, Allgeier went on to play significant snaps in every game the rest of the season, starting 7 of 16 games. Allgeier, a 5th-round pick out of BYU was 1 of 2 rookies to break the 1,000-yard mark on the ground in 2022. His 1,035 yards broke the Falcons rookie rushing record that has stood since 1979. Among RBs with at least 100 carries, Allgeier ranked 7th in 1st Down rate (25.2%), 3rd in Points Above Replacement (36.5), and had the 7th-best stuff rate (13.8%).

    Running Back: Kenneth Walker III, Seahawks

    Kenneth Walker III was used sparingly in the first five weeks to open the season, but once Rashaad Penny went down in Week 5, the Seahawks turned to their rookie. From Week 6 on, Walker’s 905 rushing yards and 8 rushing TD both ranked 5th-best in the NFL. Additionally, his 21.5% Broken+Missed Tackle rate ranked 3rd. Along with Allgeier, he was the only other rookie rusher to go over 1,000 rushing yards on the season, rushing for 1,051.

    Wide Receiver: Garrett Wilson, Jets

    As the second WR drafted in 2022, Wilson had big expectations coming into The Big Apple, and he didn’t disappoint. His 1,103 receiving yards led all rookies. He and Olave were the only rookies to top the 1,000-yard receiving mark. Even with subpar QB play, Wilson helped elevate a Jets team that narrowly missed the playoffs. He finished the season with a 91% On-Target Catch rate, 7.4 Yards per target, and a Bust rate of just 10.7%. Wilson really excelled with the ball in his hands, as his 22.9% Broken+Missed Tackle rate ranked 8th among all WRs with at least 50 targets.

    Wide Receiver: Chris Olave, Saints

    For a team that desperately needed receiving help coming into 2022, Olave was a perfect fit. Without Michael Thomas for most of the season, Olave stepped in as a new 1,000-yard receiver for the New Orleans offense. While a threat all over the field, he was utilized as a deep threat often, as his 1,793 intended air yards was the 4th-most among WRs in the entire NFL, and he had a 14.6 ADoT. With that said, his 119 targets pales in comparison to the three guys above him, as their lowest target number was 170.

    Tight End: Chigoziem Okonkwo, Titans

    A 4th-round TE, Okonkwo stepped up as a huge receiving threat for the Titans in 2022. Among TEs with at least 25 targets on the season, Okonkwo’s 2.9 yards per route run were a half yard higher than second-place Travis Kelce’s 2.4, albeit with just 46 targets. He also led TEs with 14.1 yards per reception, ranked 2nd with 9.8 yards per target, and 5th in receiver rating (122.6). As a blocker, he was called for only a single blown block, with none coming on 139 run blocking snaps.

    Tackle: Abraham Lucas, Seahawks

    Lucas started all 16 games he played in, missing only Week 17 due to an injury. In total, he was on the field for 96% of the offensive snaps. His 30 Total Points led all rookie OTs, and his 22 blown blocks were fewest. Additionally, his 4.7 Points Above Average as a pass blocker were 7th-best among OTs with at least 500 snaps played.

    Tackle: Tyler Smith, Cowboys

    The tough, nasty tackle out of Tulsa, Smith played 99% of the snaps for the Cowboys offense, starting in all 17 games. His 27 Total Points trailed just Lucas among rookie OTs. Those 27 Total Points were 6th-most in the entire league among LTs. While his 2.9% overall blown block rate ranked in the middle of the pack among LTs, his 1% blown block rate on run plays tied-6th best.

    Guard: Zion Johnson, Chargers

    Johnson played nearly every snap for the Chargers in 2022, starting in all 17 games at guard. His 35 Total Points led the way for rookie OGs, and ranked 12th among all OGs. His 23 blown blocks and 2% blown block rate all stood out from the rest of the rookies at his position.

    Guard: Cordell Volson, Bengals

    A 4th-round pick out of North Dakota State, Volson started every game and played every snap at guard for the Bengals this season. His 26 Total Points were 3rd among rookie guards. He finished with a 2.6% blown block rate, but only a 1.2% blown block rate on run plays, which tied him for 9th-best among guards with at least 500 snaps played.

    Center: Tyler Linderbaum, Bengals

    Our pick for Offensive Rookie of the Year, the center out of Iowa dominated in his first year at the NFL level, starting all 17 games for the Ravens. 

    Linderbaum’s 43 Total Points not only led all rookie offensive linemen, but it also ranked 3rd among all NFL centers. His Total Points (23) and Points Above Average (6.6) on run plays trailed just Jason Kelce. His 1.3% overall blown block rate and 1.1% blown block rate on run plays also stand out in the Top 10.

    1st-Team Defense
    Position Player Team Total Points
    Interior Defensive Lineman Perrion Winfrey Browns 9
    Defensive Lineman Aidan Hutchinson Lions 29
    Edge Travon Walker Jaguars 27
    Edge Kayvon Thibodeaux Giants 24
    Linebacker Quay Walker Packers 41
    Linebacker Devin Lloyd Jaguars 34
    Cornerback Sauce Gardner Jets 64
    Cornerback Tariq Woolen Seahawks 47
    Defensive Back Kader Kohou Dolphins 62
    Safety Kerby Joseph Lions 46
    Safety Jalen Pitre Texans 44

    Interior Defensive Lineman: Perrion Winfrey, Browns

    A 4th-round pick by the Browns, Winfrey still played in 13 games and played over 40% of the defensive snaps in 2022. His 9 Total Points led all rookies that were true DTs. He racked up 22 tackles, 0.5 sacks, and 7 pressures during the season. He finished with a positive Points Above Replacement, and his 39% positive play rate tied 10th-best among DTs with at least 5 pressures.

    Defensive Lineman: Aidan Hutchinson, Lions

    The No. 2 overall pick by the Lions, Hutchinson continually improved in all facets of his game throughout the season. Hutchinson is the first player to finish a season with 9.5 sacks, 3 INT, and 2 fumble recoveries since 1990, is the only rookie to ever do it, and is one of only two DL to ever do it. His 53 pressures led all rookie defenders, and ranked 19th among all DE/LBs. If he continues to refine his skills, he could be the home run Detroit was looking for in a pass rusher.

    Edge: Travon Walker, Jaguars

    Walker, the No. 1 overall pick, had a solid season and helped lead Jacksonville back into the playoffs. Walker played over 75% of Jacksonville’s defensive snaps and started 14 of his 15 games played in 2022. His 27 Total Points were 2nd among all rookie edge defenders. He finished with 33 pressures and an 8.6% Pressure rate. Walker is known  for his athleticism, he showed some coverage ability as well. Walker also had an interception, 3 Total Points in coverage and had a positive Points Above Average.

    Edge: Kayvon Thibodeaux, Giants

    Thibodeaux worked himself into a solid rookie season as the No. 5 pick after some speculation he could be in the top 2. He started all 14 games he played in and saw action on nearly 80% of New York’s defensive snaps. Thibodeaux finished the season with 24 Total Points and 42 pressures. He also garnered 4 sacks, 2 forced fumbles, 2 fumble recoveries, and sported an 11.5% Pressure rate.

    Linebacker: Quay Walker, Packers

    Walker was a difference maker in the middle of the Packers defense who started 16 of his 17 games played. His 41 Total Points led all rookie front-seven defenders. Additionally, Walker’s Broken+Missed Tackle rate of just 7.6% ranked in the top 20 among LBs with at least 40 solo tackles. In coverage, Walker’s 19 Total Points and 5.3 Points Above Average ranked top 10 among LBs. Aside from the two ejections, including the costly one late in the Week 18 finale, Walker has shown he can be the guy Green Bay needs at the linebacker position for years to come.

    Linebacker: Devin Lloyd, Jaguars

    Coupled with No. 1 overall pick Travon Walker in the 1st round, Lloyd himself had a strong year for the Jacksonville defense, and a big reason why the Jaguars are back in the playoffs. He finished with over 100 tackles, added 3 interceptions and 2 fumble recoveries. 21 of Lloyd’s 34 Total Points came in coverage, which ranked 4th among all LBs. Additionally, his Points Above Average (5.5) and Points Above Replacement (7.2) in coverage both ranked in the top 10.

    Cornerback: Sauce Gardner, Jets

    Sauce was everything as advertised coming out of college to the NFL. The No. 4 overall pick’s 64 Total Points led all rookies in 2022. Additionally, his 45 Total Points in coverage was 5th-best among all NFL CBs. Despite Gardner’s reputation as a lockdown corner, QBs still tested him as a rookie, sending 70 targets his way (tied-14th). However, he gave up a completion rate of just 44.3%, a deserved catch rate of just 63.6%, and a Passer Rating against of just 47.3, all ranking in the top 13 among CBs with at least 10 targets faced. Additionally, he added 17 passes defensed, which led all CBs.

    Cornerback: Tariq Woolen, Seahawks

    The long-limbed 5th-round pick out of UTSA, Woolen let NFL QBs know early and often what a difference maker he is at CB, picking off a pass in four straight games early in the season. His 6 interceptions tied for the league lead among all defensive backs. In addition, he added 11 pass defenses which tied for 7th-most among NFL CBs. His Passer Rating against (43.9) and Deserved catch rate (64%) both ranked top 11 among CBs with at least 10 targets.

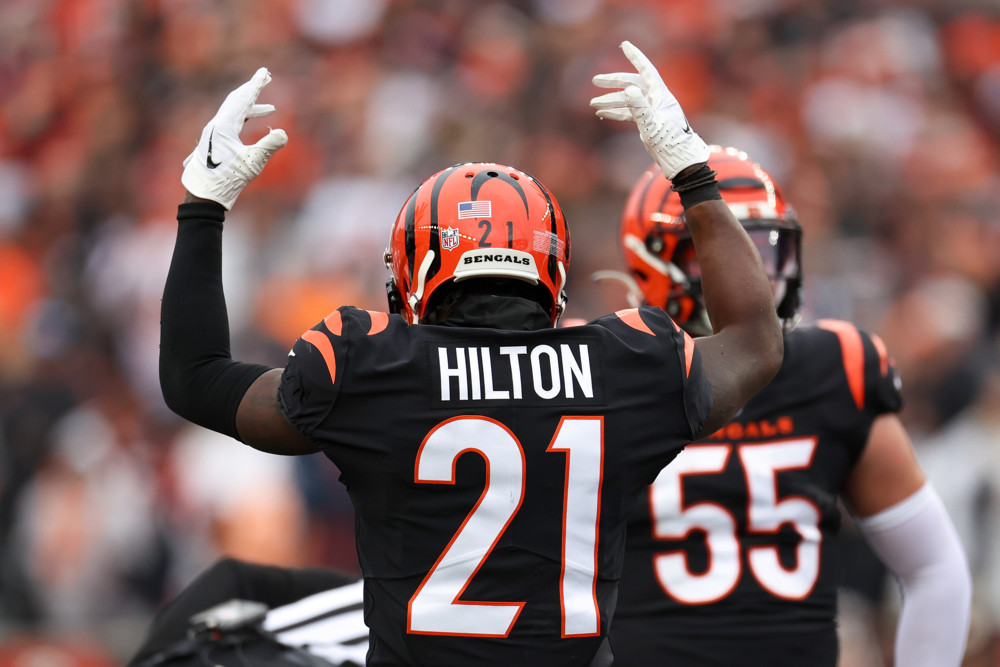
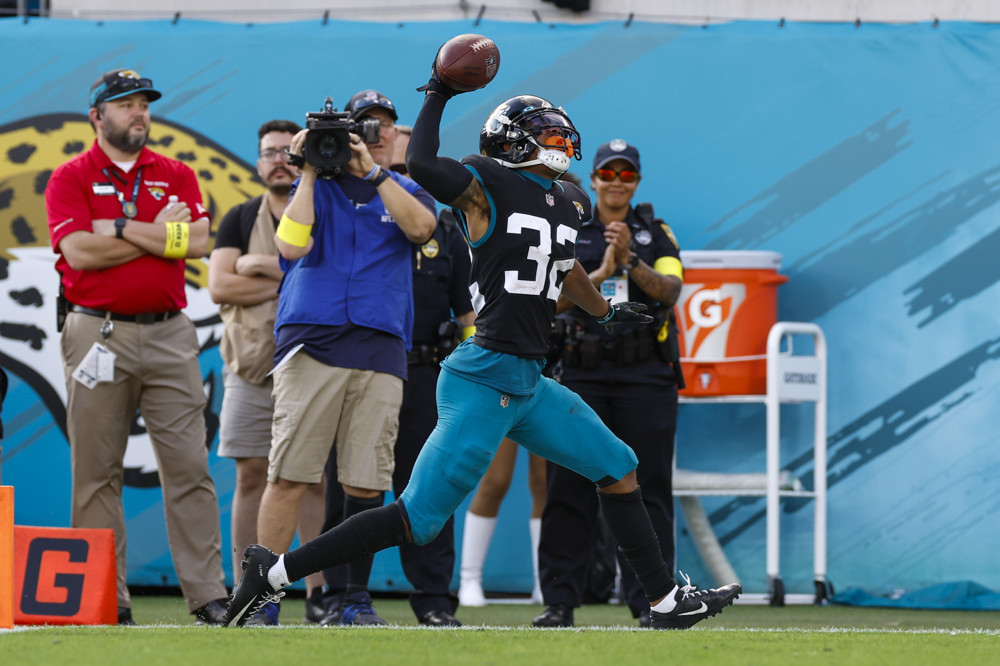
    Defensive Back: Kader Kohou, Dolphins

    One of the best stories in the league this season is undrafted free agent Kader Kohou out of Division II Texas A&M-Commerce. His 62 Total Points trailed just Sauce Gardner for most among all rookies. Kohou played sparingly for the most part in the first five weeks of the season, but saw nearly every defensive snap for the Dolphins from Week 8 on. He saw the most targets among anyone in football in 2022 with 82, giving up a reception on less than half of them. Looking at just Week 8 on, Kohou’s 42 Total Points and 28.3 Points Above Average in coverage led all CBs.

    Safety: Kerby Joseph, Lions

    Joseph didn’t see any defensive snaps until Week 4, a week after starter Tracy Walker went down with a season-ending injury. From Week 4 on, Joseph’s 28 Total Points in coverage ranked 5th among all safeties and his 11.5 Points Above Average ranked 9th. Additionally, he finished the season with 4 interceptions and 4 pass defenses. After picking off Aaron Rodgers in the Week 18 finale, Joseph became the first player to ever have 3 interceptions against Rodgers in one season. He would’ve had 4 (2 on Sunday night) if not for a penalty.

    Safety: Jalen Pitre, Texans

    If you talk about a player who makes plays all over the field, that discussion has to include Pitre. Along with his 44 Total Points, Pitre finished the year with 146 tackles, 9 TFL, 5 INT, and 5 passes defensed. His 24 Total Points against the run ranked 4th among all safeties. Additionally, his 8.1 Points Above Average ranked 8th, but is hit hard by a 18.9% Broken+Missed Tackle rate, something he’ll need to clean up moving forward.

    1st-Team Specialists
    Position Player Team Total Points
    Kicker Cameron Dicker Chargers 13
    Punter Ryan Stonehouse Titans 29
    Returner Marcus Jones Patriots N/A


    Kicker: Cameron Dicker, Chargers

    After going undrafted, Dicker was waived by two teams during training camp before finally signing in Philadelphia in October. He went 2-of-2 in one game for the Eagles, but was reverted to the practice squad and released a couple weeks later. After signing with the Chargers and being elevated to kick in Week 9, he never looked back. Overall, he converted on 21-of-22 field goal attempts and made all 24 of his extra points. From Week 9 on, his 19 made field goals tied for 2nd in the NFL.

    Punter: Ryan Stonehouse, Titans

    Another undrafted specialist in the 2022 NFL Draft, Stonehouse brought his huge leg with him from Colorado State to Tennessee. After winning the job in camp, Stonehouse managed to set an NFL record for highest gross punt average with 53.1 yards per punt, breaking Sammy Baugh’s record of 51.4 which was set in 1940. Additionally, Stonehouse’s net average (45.1) ranked 4th and his number of punts inside the 20 (30) and 10 (11) both ranked 7th.

    Returner: Marcus Jones, Patriots

    As our inaugural selection at returner, Marcus Jones helped make a difference for the Patriots in 2022. His 364 PR yards led the NFL, which included an epic touchdown return to beat the Jets in the final seconds of their Week 11 matchup. As a kick returner, he secured 645 KR yards, good for 5th-most in the league. He also helped out in other ways, intercepting two passes on defense and even scoring a touchdown on offense.

    In all, five offensive 1st Teamers and seven defensive 1st Teamers received a 6.7 final grade or higher from us, as seen on our NFL Draft site, suggesting those players will at least be high-end three-down starters beginning their second season. We’ll see if they begin 2023 the way they played this season to warrant those final grades, but we like their chances.

    Below, you can find our All-Rookie 2nd Teams which include big names like Breece Hall, Drake London, Christian Watson, and Jaquan Brisker.

    2nd-Team Offense
    Position Player Team Total Points
    Quarterback Kenny Pickett Steelers 37
    Running Back Dameon Pierce Texans 11
    Running Back Breece Hall Jets 14
    Wide Receiver Drake London Falcons 24
    Wide Receiver Christian Watson Packers 12
    Tight End Greg Dulcich Broncos 10
    Tackle Charles Cross Seahawks 25
    Tackle Jamaree Salyer Chargers 25
    Guard Dylan Parham Raiders 23
    Guard Cole Strange Patriots 19
    Center Luke Fortner Jaguars 40


    2nd-Team Defense
    Position Player Team Total Points
    Interior Defensive Lineman Logan Hall Buccaneers 8
    Defensive Lineman George Karlaftis Chiefs 20
    Edge Drake Jackson 49ers 18
    Edge James Houston Lions 7
    Linebacker Christian Harris Texans 23
    Linebacker Malcolm Rodriguez Lions 18
    Cornerback Trent McDuffie Chiefs 44
    Cornerback Martin Emerson Jr. Browns 37
    Defensive Back Jack Jones Patriots 27
    Safety Jaquan Brisker Bears 32
    Safety Rodney Thomas II Colts 27


    2nd-Team Specialists
    Position Player Team Total Points
    Kicker Cade York Browns 7
    Punter Jake Camarda Buccaneers 12
    Returner Dallis Flowers Colts N/A

    We want to highlight some of the close calls and honorable mentions who didn’t quite make the cut. 

    Some guys who just missed out include Jaylen Warren (RB), George Pickens (WR), Jahan Dotson (WR), Daniel Bellinger (TE), Ed Ingram (OG), and Jordan Davis (IDL). Ingram actually had the 2nd-most Total Points among rookie OGs, but his 37 blown blocks were 3rd-most among all NFL OGs.

    One somewhat surprising inclusion is James Houston from Detroit. He only had 7 Total Points on the season, but it’s hard to argue with 8 sacks in 7 games. Luke Fortner also gets a shoutout. His 40 Total Points would usually be an easy 1st-Team selection, but a rough draw with Tyler Linderbaum in the draft class has him pushed to 2nd Team.

    As mentioned earlier, each year we change some of the positions to account for the depth at certain areas specific to this draft class. This year, with the lack of depth on the defensive interior, we tweaked the defensive line to highlight the plethora of edge talent from this class. Additionally, with the secondary as packed as it was, it made sense to add in a 5th DB position instead of the normal hybrid position.

    You can check out last year’s article here to see how the positional structure changed. Again, the entire idea of these teams is to highlight the best players across the league, and we feel we did that.

    With all but just seven teams represented among these selections, this once again signifies that plenty of talent is being dispersed throughout the league. In our three years making these selections, every team has had at least one player featured.

    Go check out the SIS NFL Draft site to see what we said about these players coming into their NFL careers, and stay tuned to see what we’ll have to say about the next generation of NFL stars as they head into the 2023 NFL Draft.

  • Snub Season: Who Should Have Made The Pro Bowl

    Snub Season: Who Should Have Made The Pro Bowl

    It’s the most wonderful time of the year – the time where we all gather round to complain about our favorite players missing the Pro Bowl. The NFL’s annual all-star event has lost some of its luster in recent years, but this otherwise-frivolous institution is still used as a benchmark for contract incentives. It’s just a popularity contest to fans, but making or missing the Pro Bowl has real, financial implications for the players. And because it’s a popularity contest, a lot of deserving players miss the cut.

    NFC

    Fred Warner was rightfully selected to the Pro Bowl, but his cohort Dre Greenlaw probably should have made it too. Greenlaw is the only NFC linebacker to rank in the top 10 in both run defense Total Points and pass coverage Total Points, with Greenlaw ranking 8th and 1st in those respective categories. He’s also averaging 8.5 tackles/game with an average tackle depth of just 1.2 yards, which is 2nd-best in the NFC (minimum 30 tackles). Greenlaw was a fifth-round pick in 2019 and has performed really well in a contract year, so making the Pro Bowl could have helped him a ton in contract negotiations this offseason.

    One man’s trash is another man’s treasure. Just a few months after being released by the Giants, new Eagles cornerback James Bradberry leads the NFL in coverage Total Points (49), is 3rd in coverage Total Points/snap (0.09), and ranks 2nd among qualifying corners (200+ cover snaps) in yards/cover snap (0.4). He’s done all this while seeing a high volume of targets across from teammate Darius Slay, who did make the Pro Bowl. 

    Bradberry has been thrown at 62 times and has allowed the lowest completion percentage in the NFL at 34%. Ideally, the goal is to suppress targets, but corner play is volatile and very few players achieve that consistently. Bradberry deserved a Pro Bowl nod this year, and it was surprising he didn’t get it considering just how good the Eagles have been.

    Honorable mention: PHI DT Javon Hargrave ranks 2nd in pressure rate (10.4%) and 3rd in Total Points/pass rush among NFC DTs, but it’s hard to bump any of Aaron Donald, Jonathan Allen, and Dexter Lawrence, especially when all three are better run defenders.

    AFC

    The 6-8 Jaguars don’t get a lot of fanfare, and second-year corner Tyson Campbell predictably did not get a Pro Bowl bid over some of the household names on winning teams. However, he’s had a really good sophomore campaign and, quite frankly, deserved the Pro Bowl slot over Dolphins corner Xavien Howard, who is having an uncharacteristically bad year and ranks last in the NFL in yards allowed. Campbell, meanwhile, ranks 2nd in the NFL in pass coverage Total Points and has the 6th-best positive play rate (33%) among corners who have been targeted at least 10 times. Unfortunately, emergent players on losing teams have a tough time making the Pro Bowl.

    In another instance of a household name making it over a less-established, albeit more deserving player, T.J. Watt, who has played just seven games this year due to injury, made the Pro Bowl as an outside linebacker over the Dolphins’ Jaelan Phillips. Miami’s second-year edge ranks 4th in the AFC in both pressure rate (17.4%) and pass rush Total Points Saved (21) among players with 100+ pass rushes. His 57 pressures rank 9th in the NFL this season, but a low sack rate (2%) and a middling sack total (7) bely just how good he’s been.

    Honorable mention: CIN WR Tee Higgins has had a really good year. He ranks 4th in the NFL in Total Points/route run among wide receivers with 50+ targets, behind Davante Adams, Stefon Diggs, and Tyreek Hill, but it’s hard to argue he’s better than those guys, and the fourth AFC WR is his teammate, Ja’Marr Chase, who draws more attention from opposing defenses.

    This year’s Pro Bowl voting seems to have been a bit better than previous seasons. As always, there were some selections that were based on name-brand recognition more than anything, but the snubs seemed few and far between. As disappointing as that is for a Scrooge like me who loves to complain, it is nice to see that a lot of emerging young stars got their due. Players like Quinnen Williams and Talanoa Hufanga should soon become household names in their own right, and maybe some of this year’s snubs aren’t too far behind.

  • The Effect of Turf On Injuries In The NFL

    The Effect of Turf On Injuries In The NFL

    This article originally appeared in The 2021 Football Rookie Handbook.

    Most people who have played football on turf will generally agree that—well—it hurts! Even as technology has improved and artificial surfaces have gotten better, NFLPA President JC Tretter made the case as recently as 2020 that the NFL should move away from turf fields for both practices and games because of the impact that they can have on players’ bodies.[1] He cited injury data from the NFL that showed elevated injury risk on turf relative to grass to back up his point. Specifically, he pointed to non-contact lower extremity injuries as the main culprit.

    Previous research jibes with Tretter’s argument to varying degrees. Our friend, Dr. Zach Binney, wrote for Football Outsiders in 2017 about how certain turf types performed slightly more poorly in terms of injury risk when compared to grass, but he stopped short of making any definitive conclusions.[2] Additionally, Loughran et al. wrote about knee injury incidence on turf versus grass in college football in the American Journal of Sports Medicine in 2019, finding that artificial turf was a significant risk factor for certain knee ligament injuries.[3]

    Since we have the most comprehensive football injury database in existence, we decided to take a look to see what we could find.

    Are NFL injury rates higher on turf or grass?

    In the NFL over the last four years, there have been both more total injuries and more injuries forcing players to leave the game on games played on turf relative to grass.

    NFL Injuries by Field Type (2017-2020, Regular Season only)
    Field Type Games Injuries Per Game Left the Field Per Game
    Grass 587 5.0 4.1
    Turf 437 5.4 4.5
    Percent Change +7.8% +9.2%

    This indicates that about 48 extra injuries that cause players to leave the field are occurring each regular season needlessly because almost half of NFL teams play their home games on turf.

    To be fair, these numbers could be biased by the teams that play in the stadiums. In other words, any team-level factor from the players to the training staff to the cafeteria could be a confounding factor that is actually responsible for the injury rates. To account for this, we can look at just away players to help control for the fact that the home team’s players make up about half of all snaps played in any given stadium.

    NFL Injuries by Field Type (Away Players only)
    Field Type Games Injuries Per Game Left the Field Per Game
    Grass 587 2.5 2.1
    Turf 437 2.8 2.3
    Percent Change 8.8% 7.7%

    The effect appears to be about as large for the road teams, indicating that our initial finding isn’t a result of home teams biasing the study. For the rest of the article, we will generally use the totals across home and away players for the sake of sample size, but we will indicate if/where there are any differences of note.

    As an aside, if you notice that away players are generally slightly more likely to be injured and leave the game than home players, that is an astute observation by you. This result is consistent from season to season, but it’s not the subject of this article.

    Which body parts are most affected by turf?

    Previous research suggests that lower extremity injuries, specifically, are more likely to see an increase on turf. We found this to be true in the case of ankle/foot injuries, but not so for the rest of the legs, including knees.

    NFL Injuries Per Game by Field Type and Body Part
    Body Part Grass Turf Percent Change
    Head 0.76 0.90 +18%
    Shoulder 0.39 0.42 +9%
    Arm/Hand 0.42 0.43 +1%
    Core 0.34 0.37 +9%
    Upper Legs / Hips 0.46 0.46 -1%
    Lower Legs / Knee 1.25 1.23 -2%
    Ankle/Foot 0.96 1.05 +10%

    It’s worth noting that these results are generally very consistent when we split the sample to look at away players only, injuries that forced the player to leave the field only, and both.

    One thing that sticks out is that shoulder, core, and to an even larger extent head injuries are occurring considerably more often. While it’s not clear why this is happening, when we consider that each team hosts eight regular season games per year, the increase of 0.14 head injuries per game represents an additional 1.12 head injuries per team that chooses to play on turf per season. Another way to think of that is that each year that each turf team continues to play on their surface, they are adding more than one unnecessary head injury every time.

    Still, the most surprising finding was that lower leg and knee injuries decreased on turf fields when compared to grass fields. While the difference was small and inconsistent from year to year, previous research had indicated that these were precisely the injuries that turf seemed to induce, so the finding that there is no real difference in this sample is notable.

    One potential explanation for this is that the makers of the artificial turf that the NFL teams have been using have been able to focus their technological improvements on this previously identified weakness. If that is the case and not a four-year anomaly, then hopefully head, shoulder, core, and ankle/foot injuries can see a positive change as well.

    What types of injuries are occurring more (or less) on turf?

    The specific injury diagnoses that had been found by previous research to increase on turf included knee and ankle sprains. To be clear, sprains include what people colloquially describe as tears. Anytime a ligament is sprained, that just means that there is some level of tearing going on.

    Percent Difference in NFL Injury Diagnoses Per Game on Turf Compared to Grass
    Diagnosis All Players Away Players Only
    Knee Sprain -3% -6%
    Ankle Sprain +4% +6%

    The numbers mostly match up with what we saw when breaking things down by body part. In this sample, knee sprains are slightly down on turf and ankle sprains are slightly up, but neither change by significant amounts. The magnitude of these changes were much smaller than what was observed by previous research, which in some cases found double-digit increases on turf.

    How do contact vs non-contact injuries factor into this?

    NFL Injuries per Game by Field and Contact Type (2017-2020)
    Field Type Non-Contact Contact with Ground Contact with Player
    Grass 0.82 0.80 3.39
    Turf 0.80 0.85 3.76
    Percent Change -3% +6% +11%

    Once again, our findings are at odds with previous research. We’re again seeing a slight decrease in injury rates on turf relative to grass where we expected to see an increase, this time in the form of non-contact injuries. Still, injuries involving contact between two players are much more common, and the magnitude of increase in those sorts of injuries on turf compared to grass offsets the decrease in non-contact injuries several times over.

    The effects are consistent whether we look at all players, only away players, only injuries that cause players to leave the field, or away players whose injuries cause them to leave the field.

    Percent Difference in NFL Injuries Per Game By Contact Type

    On Turf Compared to Grass

    Contact Type All Injuries Injuries to Away Players Only Significant Injuries (Left The Field) Away Players & Left The Field
    Non-Contact -3% -14% +1% -13%
    Contact with Ground +6% +8% +10% +8%
    Contact with Player +11% +15% +11% +13%

    What about non-contact lower body injuries?

    JC Tretter mentioned three specific data points when he called on the NFL teams to adopt grass practice and playing surfaces in September of 2020:

    “Specifically, players have a 28% higher rate of non-contact lower extremity injuries when playing on artificial turf. Of those non-contact injuries, players have a 32% higher rate of non-contact knee injuries on turf and a staggering 69% higher rate of non-contact foot/ankle injuries on turf compared to grass.”

    While he was citing the NFL’s own injury data, which is both from different seasons (2012 to 2018) than our dataset covers and seems to mix data from practices and games, these results were not at all consistent with our findings.

    Percent Difference in NFL Non-Contact Injuries Per Game

    By Body Part on Turf Compared to Grass

    Body Part All Injuries Injuries to Away Players Only Significant Injuries (Left The Field) Away Players & Left The Field
    Lower Extremity -12% -17% -11% -15%
    Knee -18% -30% -16% -23%
    Ankle/Foot -3% +6% -2% 0%

    Just about any way we sliced it, non-contact lower extremity injuries were reduced, not increased, on turf relative to grass. It was “Contact with Player” injuries, which are much more common to begin with, that drove the overall increase in injury rates on turf.

    Last Word

    The SIS Injury Database matched previous research on the topic of grass versus turf in that we have observed a clear increase in injuries per game in stadiums with turf in NFL games over the last four years. However, our findings do not match prior research in that we did not find an increase in non-contact and/or knee injuries. Instead, we found that injuries occurring because of contact between players were overwhelmingly what accounted for the increase in injuries. Somewhat concerningly, we saw an increase in head injuries on turf, so we will keep a close eye on how these trends continue to develop in the years to come.

    [1]JC Tretter, “Only Natural Grass Can Level The NFL’s Playing Field,” NFLPA.com, https://nflpa.com/posts/only-natural-grass-can-level-the-nfls-playing-field.

    [2]Zachary Binney, “Turf Type and NFL Injuries Part I,” FootballOutsiders.com, 2017, https://www.footballoutsiders.com/stat-analysis/2017/turf-type-and-nfl-injuries-part-i.

    [3]Galvin J Loughran, Christian T Vulpis, Jordan P Murphy, David A Weiner, Steven J Svoboda, Richard Y Hinton, Dave P Milzman, “Incidence of Knee Injuries on Artificial Turf Versus Natural Grass in National Collegiate Athletic Association American Football: 2004-2005 Through 2013-2014 Seasons,” American Journal of Sports Medicine, May 2019,  https://pubmed.ncbi.nlm.nih.gov/30995074/.


  • What’s Wrong With Joe Burrow And The Bengals Offense?

    What’s Wrong With Joe Burrow And The Bengals Offense?

    As improbable as the Bengals’ Super Bowl run was last year, I don’t think anybody expected them to be this bad in 2022. A cadre of analysts had been trumpeting their impending regression, but consecutive losses to Mitchell Trubisky and Cooper Rush to begin the season have everyone wondering – what the hell is going on in Cincinnati?

    Last year’s Cinderella has quickly turned into a pumpkin, and much of the blame is to be placed on an offense that has been highly dysfunctional through two games.

    One of the company lines for the Bengals this offseason was that they could both run on two-high structures and pass against single-high coverage. Survey says that was a lie. 

    The Bengals have seen the most two-high snaps (101) of any team this season, and they have failed to punish defenses on the ground and force them out of those looks. Part of that has been for lack of trying – they run the ball into two-high just 23% of the time, the second-lowest rate in the league – but they also simply haven’t done it well. They average -0.19 EPA/carry into light boxes and a meager 1.0 YBC on those plays, second-worst in the NFL. 

    Perhaps leveraging RPOs more frequently would help; they’ve dialed up an RPO on only 3% of their offensive snaps, which is well below the league average of 8%.

    It should be unsurprising then that the Bengals haven’t generated big plays through the air like they did last year. Coverage dictates where the ball is thrown, and two-high structures generally force underneath throws. As a result, Cincinnati’s average depth of target (ADOT) is down to 6.5 yards from 8.0 last year, and their boom rate – big plays that generate >1 EPA for the offense – has also dropped from 24.3% to 20.6% year-over-year. 

    Practically speaking, that’s about two big throws a game they’re missing out on. This is a huge deal for an offense that generated negative EPA in 2021 despite ranking 1st in EPA (435) on such plays. Every other team in the Top 10 produced positive EPA on the year. For better or worse, they were something of a glass cannon last year, and we’re currently noticing the extent to which they’ve been reliant on explosives.

    Offenses don’t have to chuck it deep to pick up big yards throwing, though. That helps, of course, but teams with YAC threats are often able to rip off chunks in spite of a low ADOT. Unfortunately for Cincinnati, its receivers haven’t been as dynamic with the ball in their hands as they were last year. In 2021, the Bengals pass catchers ranked 5th in the league in broken and missed tackles/reception; this year, they rank just 26th through two games.

    This is not to place the blame entirely on the receiving corps. Pass protection woes have certainly compounded Cincy’s issues in the passing game, but they have also been somewhat unlucky in terms of the impact it’s had on them. Although nobody is arguing the Bengals offensive line is one of the best in the game, their league-worst 13 sacks belies some less-atrocious advanced metrics:

    Bengals Offensive Line Advanced Stats

    First 2 Weeks of 2022

    Metric Stat Rank
    Pressure Rate 30% 14th
    Blown Block Rate (Passes) 2.3% 16th
    Avg time to pressure 2.61s* 25th

    * League average is 2.76

    So, while this unit has been less-than-good, they’re not as bad as the pummeling of Joe Burrow would lead you to believe. The problem here is largely that their mistakes have seldom gone unpunished. In 2021, pressures turned into sacks 19% across all 32 teams. So far, the Bengals opponents’ have converted a whopping 45% of their pressures into sacks. Only the Saints have been worse in this regard. Sacks typically kill about 80% of drives historically. Cincinnati has failed to convert another set of downs after 10 of its sacks so far.

    Offensive playcalling hasn’t helped, either. The Bengals have shown some pretty stark run-pass tells that opposing defenses are starting to key on. The passing rate disparity between their shotgun and under center splits was 59 percentage points in 2021, second to only the 2019 Jaguars (61 percentage points) over the past four seasons. (Please take a moment to note that Jacksonville offense was led by John DeFilippo, who had three one-year stints as an NFL offensive coordinator, and is now out of work.) 

    That’s not great company Zac Taylor is keeping, but it’s gotten worse. That figure has ballooned to 69 percentage points this year. That is – if Cincinnati is in shotgun, they pass 87% of the time; if they’re under center, they pass 18% of the time.

    It’s admittedly somewhat myopic to view offensive playcalling binarily. It’s also naive to think it’s abnormal for offenses’ modus operandi to change based on whether they are in the gun or under center. However, these splits are pretty staunch and there is some correlation between a playcaller’s tendencies and his offense’s performances within these splits. The defense still has to get into the right call – defending a stick concept is a lot different from defending four verts – but splits this big are not nothing.

    In the past, two losses to start the season has been a death knell for a team’s playoff hopes, though one might expect those odds to be a bit better under the new 17-game season. Still, Cincinnati’s season hangs in the balance this weekend, and a loss might bring the team’s honeymoon period to an abrupt end. At 1-2, they’d still be behind the 8-ball, but each win buys them more time to fix some of their systemic issues and right the ship.

    Unless you’re Tom Brady, NFL championship windows close awfully quickly, and Burrow – despite his strengths and all the cosmetic surgeries he’s undergone – is no Tom Brady. It’s still early and the Bengals have the talent to turn things around, but they’d better do so quickly, lest their window closes. Maybe it already has.

  • World’s No. 1 QB Rankings: Look Who’s No. 1!

    World’s No. 1 QB Rankings: Look Who’s No. 1!

    We’ve been doing this World’s No. 1 Quarterback Rankings thing for a few years now and we’ll open the 2022 season with perhaps the most clickbaitish ranking yet.

    Josh Allen is the No. 1 quarterback by our system.

    Yep!

    The World’s No. 1 Quarterback Ranking is based on a model devised by Bill James to evaluate The World’s No. 1 Starting Pitcher. Bill’s model was based on cumulative evaluation of individual starts over an extended time period using the metric Game Score.

    The World’s No. 1 Quarterback Ranking uses our player value stat, Total Points to make a cumulative evaluation of game performance over a three-year period. The key to our calculation is PAA, the statistical underpinning of Total Points that is centered at zero so that positive numbers are above average and negative numbers are below average.

    Success over time is key to maintaining a good ranking. Prolonged inactivity results in a ranking drop. The most recent performances carry the most weight.

    Our Top 10 currently reads:

    1. Josh Allen
    2. Justin Herbert
    3. Patrick Mahomes
    4. Aaron Rodgers
    5. Tom Brady
    6. Matthew Stafford
    7. Joe Burrow
    8. Kirk Cousins
    9. Derek Carr
    10. Russell Wilson

    So let’s explain what happened here:

    Josh Allen’s two phenomenal games in last year’s playoffs moved him past those quarterbacks you think he should be behind.

    Allen ended the regular season ranked No. 5 behind Aaron Rodgers, Justin Herbert, Patrick Mahomes, and Tom Brady.

    If you’re wondering why Mahomes was No. 3, the gap between Rodgers, Herbert and Mahomes was small enough entering Week 18 that both Rodgers and Herbert leapfrogged Mahomes in the season’s final week.

    Mahomes retook the No. 1 spot during Wild Card weekend with Rodgers slipping to No. 2 and Herbert to No. 3. But Allen narrowed the difference between himself and the four quarterbacks in front of him by throwing for 308 yards and five touchdowns in a dominant win over the Patriots.

    Then in the Divisional Round, though Mahomes and the Chiefs won an epic game, Allen (329 yards, 4 touchdown passes, 68 rushing yards) nearly matched Mahomes in performance (378 yards, 3 touchdown passes, 69 rushing yards).

    Meanwhile, Brady had a lousy game in a season-ending defeat to the Rams, posting -7 Points Above Average. Rodgers too was bad by his standards, finishing -1 Points Above Average in a loss to the 49ers.

    Allen shot past them and Herbert (whose team didn’t make the playoffs) and moved into the No. 2 spot.

    Then, when Mahomes was sacked four times and had two interceptions against the Bengals in the AFC Championship, Allen reaped the benefit of a week of inactivity and slid into the No. 1 position.

    In fairness to Allen, given that there may be some skepticism about this ranking. He’s proven himself pretty well the last two seasons. He ranked 5th in Total Points in the 2020 regular season and 3rd in 2021. If he plays at the level that he did in his two postseason games, he may find himself hanging on the No. 1 for a little while.

    Other things to keep an eye on:

    * Russell Wilson, who dropped from No. 5 to No. 10 from his peak in 2021 to the end of 2022, will try to climb back to the Top 5 with a new team. There were considerable concerns about Wilson for part of last season. He’d dipped to No. 16 in the rankings in Week 10 but finished with 20.6 points above average in his last seven games, most of them coming in the final two weeks of the season.

    * Joe Burrow went ranked No. 21 through games played in Week 13 last season. But he jumped 14 spots with superstar performances against the 49ers, Ravens, and Chiefs in the regular season, and the Raiders in the playoffs.

    Burrow closed with -2.1 PAA against the Titans in the Divisional Round , a 0 PAA game against the Chiefs (technically he was 0.01), and a -1.7 PAA in the Super Bowl

    Will he have staying power among the top quarterbacks this season?

    * Trevor Lawrence ranks 60th behind a slew of backups who barely saw the field in 2021 (a good game in Week 1 would change that). But he ended 2021 with the best game of his career, a win that knocked the Colts out of the playoff race. Can he make the necessary improvements to get into the top half of the league’s QBs?

    Here are our rankings heading into 2022.

    Rank QB PAA Per 60
    1 Josh Allen 6.7
    2 Justin Herbert 6.3
    3 Patrick Mahomes 5.6
    4 Aaron Rodgers 5.3
    5 Tom Brady 4.2
    6 Matthew Stafford 2.9
    7 Joe Burrow 2.0
    8 Kirk Cousins 1.7
    9 Derek Carr 1.4
    10 Russell Wilson 1.3
    11 Kyler Murray 0.9
    12 Teddy Bridgewater 0.9
    13 Dak Prescott 0.8
    14 Mac Jones 0.6
    15 Lamar Jackson 0.3
    16 Ryan Tannehill 0.1
    17 Carson Wentz -0.3
    18 Deshaun Watson -0.3
    19 Matt Ryan -0.8
    20 Jimmy Garoppolo -1.0
    21 Jameis Winston -1.2
    22 Josh Johnson -1.3
    23 Tua Tagovailoa -1.4
    24 Trevor Siemian -1.4
    25 Jalen Hurts -1.5
    26 Jacoby Brissett -2.0
    27 Gardner Minshew -2.0
    28 Kyle Allen -2.2
    29 Colt McCoy -2.2
    30 Ryan Fitzpatrick -2.3
    31 Chad Henne -2.4
    32 Tyrod Taylor -2.4
    33 Case Keenum -2.5
    34 Jared Goff -2.5
    35 John Wolford -2.5
    36 Geno Smith -2.5
    37 Marcus Mariota -2.6
    38 C.J. Beathard -2.6
    39 Mason Rudolph -2.6
    40 Joe Flacco -2.6
    41 Nick Mullens -2.6
    42 Blaine Gabbert -2.7
    43 Jeff Driskel -2.7
    44 Matt Barkley -2.7
    45 Brett Hundley -2.7
    46 Josh Rosen -2.7
    47 Brian Hoyer -2.7
    48 Chase Daniel -2.7
    49 Nate Sudfeld -2.8
    50 David Blough -2.8
    51 Brett Rypien -2.9
    52 Jarrett Stidham -2.9
    53 Daniel Jones -2.9
    54 Ben DiNucci -3.0
    55 Baker Mayfield -3.0
    56 Tyler Huntley -3.0
    57 Drew Lock -3.0
    58 Nick Foles -3.1
    59 Jordan Love -3.2
    60 Trevor Lawrence -3.2
    61 Garrett Gilbert -3.2
    62 Cooper Rush -3.2
    63 Sean Mannion -3.2
    64 Ian Book -3.2
    65 Mike White -3.3
    66 Mitchell Trubisky -3.3
    67 Jake Luton -3.4
    68 Chris Streveler -3.4
    69 Zach Wilson -3.5
    70 Trey Lance -3.6
    71 Brandon Allen -3.7
    72 Phillip Walker -4.0
    73 Tim Boyle -4.2
    74 Justin Fields -4.3
    75 Jake Fromm -4.3
    76 Andy Dalton -4.3
    77 Cam Newton -4.8
    78 Davis Mills -5.5
    79 Taylor Heinicke -5.8
    80 Sam Darnold -6.5
    81 Ben Roethlisberger -7.3
    82 Mike Glennon 0.0
  • Which Steelers QB will start Week 1?

    Which Steelers QB will start Week 1?

    After an illustrious 18-year career as the starting quarterback of the Pittsburgh Steelers, Ben Roethlisberger decided to hang up his cleats and move on to bigger and better things. After his elbow surgery in 2019, everyone could tell that he was not the same “Killer B” as he once was.

    In his final year, Roethlisberger was 40th in Total Points Earned Per Pass, 36th in Positive Play Percentage, and 30th in Independent Quarterback Rating (IQR) out of 42 quarterbacks who had more than 100 pass attempts in the regular season. 

    As a going-away gift, he has left his predecessor with a low floor to improve the Steelers offense. The question is will that predecessor be Mason Rudolph, Kenny Pickett, or Mitch Trubisky?

    Mason Rudolph

    The 26 year old Mason Rudolph has had four seasons in the Steelers offense to prove that he is more than a backup QB. In 2019 after Roethisberger’s elbow surgery, Rudolph was given the keys to the offense full-time with 10 appearances. Even though he was able to keep the Steelers in the playoff hunt, he was unable to take the offense to the next level and performed as a below-average QB statistically.

    Mason Rudolph

    Metric 2019 (Rk)
    Adjusted Net Yards/Attempt 5.0 (35)
    On-Target % 72.9% (35)
    Independent QB Rating (IQR) 91.8 (25)
    Total Points Earned Per 60 Plays 3.4 (34)
    Positive Pass % 41.9% (35)
    INT % 3.2% (32)

    This season is best remembered for being carried off the field against the Ravens with his facemask sawed off and was involved in an incident with Myles Garrett on the field.

    In 2021, he was given another opportunity with Roethlisberger out due to COVID against the Lions at home. Rudolph was unable to pull out the win in a 16-16 tie against a team with the second worst record in the league. He went 30-50 with 242 yards, 1 TD, and 1 INT. 

    With the additions of other QBs via free agency and the NFL Draft, it seems as though time has expired for Rudolph’s opportunity.

    Kenny Pickett

    In 2021, Kenny Pickett was able to take full advantage of the extra year of eligibility due to COVID. Pickett’s 334 completions, 4,319 passing yards, and 42 TD were all good for Top 10 in the FBS and single season records at Pitt, resulting in an invitation to New York City as a Heisman Finalist. 

    Pickett then cemented his legacy by leading the Pittsburgh Panthers to their first ACC Championship since joining the conference in 2011 and a Peach Bowl appearance. All of his success in his final season as a Panther resulted in him being the 20th overall pick in the NFL Draft by the Steelers. 

    Requiring only a 25-step walk across the UPMC Rooney Sports Complex to his new home, how big of a step will Pickett actually have to take to win the starting job? 

    Kenny Pickett

    Metric 2019 (Rk) 2020 (Rk) 2021 (Rk)
    Adjusted Net Yards/Attempt 5.5 (125) 6.1 (72) 8.8 (10) 
    On-Target % 76.6% (28)  80.0% (14) 78.1% (23)
    Independent QB Rating (IQR) 92.3 (95) 94.7 (66) 125.6 (7)
    Total Points Earned Per 60 Plays 13.3 (58) 11.5 (51) 15.4 (19)
    Positive Pass % 40.6% (114) 44.2% (68) 50.6% (10)
    INT % 1.9% (53) 2.7% (76) 1.4% (18)

    Over his final 3 seasons at Pitt, Pickett was able to improve in many key areas that led to the Panthers success offensively. Importantly, Pickett was able to reduce his Interception Percentage from 2020 to 2021, which he will need to keep low if he wants to win the starting job in Week 1.

    Pickett was able to produce these numbers with Pitt offensive coordinator Mark Whipple’s pro-style offense, where the Panthers ran 12 Personnel 38% of the time. His familiarity with a pro-style offense as well as Steelers offensive coordinator Matt Canada (who recruited Pickett at Pitt) is a positive when factoring in the time required to learn the Steelers offense. 

    If Pickett is able to build on his knowledge of the offense, continue to limit turnovers, and improve his accuracy in the Steelers offensive scheme, he will certainly be on the fast track to the starting job in 2022.

    Mitch Trubisky

    In the 2017 NFL Draft, the Chicago Bears traded up to the 2nd overall pick to draft Mitch Trubisky. At the time, Trubisky was considered the top QB prospect in the draft after a prolific career at North Carolina. His best season with the Bears was in 2018, where he amassed 289 completions, 3,223 yards, and 24 TD. This performance helped earn the Bears an NFC North crown. 

    Unfortunately, he was unable to regain the success that he had in 2018 and only led the Bears to one more Wild Card round appearance.

    Mitch Trubisky

    Metric 2018 (Rk) 2019 (Rk) 2020 (Rk)
    Adjusted Net Yards/Attempt 6.6 (16) 5.0 (36) 6.0 (27)
    On-Target % 75.3% (33) 75.0% (24) 75.0% (34)
    Independent QB Rating (IQR) 95.2 (24) 81.2 (38) 87.4 (32)
    Total Points Earned Per 60 Plays 5.0 (31) 2.1 (39) -1.4 (40)
    Positive Pass % 49.8% (14) 43.1% (30) 53.0% (6)
    INT % 2.8% (29) 1.9% (19) 2.7% (32)

    Even though the Bears made the playoffs in 2020, Trubisky was again below-average in his final season as the starter. He was 40th in WAR out of 44 QBs with a minimum 100 passing attempts in the regular season. Additionally, his Interception Percentage spiked back up to 2.7%. 

    Unable to take the Bears offense to the next level, the Bears declined his 5th-year option and Trubisky then signed with the Bills to be their backup.

    In Buffalo, Trubisky only played in 4 games behind MVP candidate Josh Allen. However, he was able to sit and learn in an offense that resulted in 4,284 Net Passing Yards, a 47.5% Positive Pass rate, and 11.5 Total Points Per 60 Plays, all good for Top 10 in the NFL.

    Trubisky’s experience and opportunity to reset behind a successful offense may prove to be the main factor that can land him the starting job Week 1.

    Conclusion

    In OTAs, it was apparent that Trubisky was taking the majority of first team reps, followed by Rudolph then Pickett. When it comes to rookies, Tomlin has historically made every one of them earn their stripes by putting in the grunt work in the offseason. Therefore, Pickett taking the third-team reps comes as no surprise early on. 

    Expect this to be a true battle between Trubisky and Pickett for the starting job in the offseason. Pickett coming in at the age of 24 and running a pro-style system already puts him in a good spot to compete for the job with the experienced Trubisky. 

    Whichever QB can make the least amount of mistakes and make the correct decisions in Matt Canada’s RPO/Play-Action scheme will win the job Week 1.

  • Reviewing The 2019 NFL Draft Class

    Reviewing The 2019 NFL Draft Class

    While many crave all the NFL Draft Team Grades that publications put out the day after the draft, including us on both accounts, there are many others who can’t stand it. Of course, we all have our own NFL Draft prospect rankings heading into that weekend, but those players have yet to play a single snap in the NFL. So, how can we really grade a team’s draft class if those players haven’t yet stepped onto the field?

    It usually takes at least three years to see how well a draft class turned out. While said publications, including us, don’t want to wait three years before putting out their grades on a draft class, we decided to now do both.

    Three years ago, prior to the 2019 NFL Draft, Sports Info Solutions created its first ever draft guide: The SIS Football Rookie Handbook. This book marked a first for SIS, as it was the first football publication since the company added the sport on the data collection front in 2015. After the 2019 NFL Draft, we, just as many others, posted our NFL Draft Team Grades, which can be seen here.

    I’ve developed a system to evaluate the draft classes using Total Points relative to position as the foundation. Now that three seasons have gone by, let’s use that to truly see how each team did with getting value from their selections in the 2019 NFL Draft.

    How much value did teams get?

    Before we get into the process, let’s take a look at how we ranked teams after the 2019 NFL Draft and then who got the most and least value. See the Appendix below to see how all 32 teams ranked in our 2019 rankings and in TP Score.

    Here are the teams we ranked at the top immediately following the draft back in 2019. To see our scouting grading scale, check out our new NFL Draft site.

    Top 5 Teams in 2019 Post-Draft Rankings
    Team Book Rank Grade
    Titans 1 6.63
    Bills 2 6.50
    Cardinals 3 6.46
    Ravens 4 6.44
    Bengals 5 6.44

    TP Score will be defined below, but here are the top 5 teams based on how much value they received from their draft class.

    Top 5 Teams in TP Score
    Team TP Rank TP Score
    Titans 1 84.64
    Broncos 2 82.81
    Raiders 3 77.23
    Buccaneers 4 67.50
    Jaguars 5 62.18

    The No. 1 team in 2019 (the time of our initial evaluation) and in this ranking both worked out to be the Tennessee Titans. Five of their six draft picks have been above average, all playing in at least 38 games over the past three seasons. The only pick who didn’t hit was D’Andre Walker, who appeared in only one game.

    The top 3 teams, the Titans, Broncos, and Raiders, are at the top for a reason. They drafted good players throughout their entire draft class. They were the only teams to draft above-average players on 75% or more of their draft class.

    Conversely, here are the bottom 5 teams from our 2019 rankings.

    Bottom 5 Teams in 2019 Post-Draft Rankings
    Team Book Rank Grade
    Saints 28 6.12
    Browns 29 6.10
    Seahawks 30 6.03
    Lions 31 6.00
    Chiefs 32 5.90

    Based on TP Score, here are the worst teams in terms of getting value from their 2019 draft picks.

    Bottom 5 Teams in TP Score
    Team TP Rank TP Score
    Chargers 28 16.00
    Panthers 29 14.53
    Bengals 30 12.48
    Eagles 31 12.24
    Seahawks 32 10.12

    Determining Total Points Score

    Now that you’ve seen the rankings, let’s explain the process. When looking back to see how good or bad a specific draft class was, there are two main points to detect:

    1. How productive were the draft picks on the field?
    2. How much talent did the team draft relative to the amount of picks they made? 

    As in: Did they hit on one player or did they hit on multiple players?

    To determine the value of the draft classes, I used Total Points, our flagship player value stat, from across the last three seasons. However, for those of you who are familiar with Total Points, it gives a lot of extra weight to quarterbacks. With that said, Kyler Murray, the No. 1 pick, alone would have had the 5th best draft class with his 286 Total Points if we just used raw Total Points.

    While there is a reason we weigh quarterbacks so much more compared to other positions (they are pretty important), using that raw number in this sense isn’t going to make for a perfect match. Yes, the Cardinals got a lot of value in Murray, but when looking at their draft class as a whole, I think many would agree they didn’t have the best draft class. A fate they would have had if just using raw Total Points.

    Now, answering the second question takes into account how well a team drafted throughout the entirety of the draft class. I found the average Total Points per player from the 2019 class at each position, including UDFAs who have taken at least one offensive or defensive snap, since they were also available to be selected.

    The positional averages are shown in the table below.

    Pos TP per Player
    QB 38.1
    RB 8.8
    WR 15.7
    TE 11.2
    OL 25.3
    ED 29.1
    DT 19.8
    LB 23.5
    CB 23.2
    S 30.2


    The TP Score, as referenced earlier, is what’s used to rank the teams. It is calculated as follows:

    1. Add up the Total Points from the entire team’s draft class

    2. Divide that number by the number of selections the team had

    3. Multiply that number by the percentage of draft picks that were above the average Total Points for their given position

    4.Add that to the original Total Points per draft pick

    In these 4 steps, we are essentially answering how productive the draft class was and how many picks were “hits”.

    Let’s run through an example using the Chicago Bears.

    Here is their Draft class:

    Pos Player Total Points
    RB David Montgomery 45
    WR Riley Ridley 4
    CB Duke Shelley 21
    RB Kerrith Whyte Jr. 2
    CB Stephen Denmark 0
    1. Add up the Total Points from the entire team’s draft class
    72
    2. Divide that number by the number of selections the team had
    72 Total Points divided by 5 selections equals 14.40
    3. Multiply that number by the percentage of draft picks that were above the average Total Points for their given position
    David Montgomery was the only player whose Total Points were above average
    14.40 times 20% (1 out of 5) equals 2.88
    4. Add that to the original Total Points per draft pick
    14.40 plus 2.88 equals 17.28, which is their TP Score


    So, to summarize, we took the team’s Total Points gained from these players, dispersed it throughout the entire class and then gave a bump based on how many above-average players they drafted.

    Now that we know how the teams ranked and how the TP Score is calculated, let’s dive into some of the details.

    Other Key Takeaways

    – The Raiders “hit” on 7 of their 9 picks. It is interesting to note that all three of their 1st-Round picks, Clelin Ferrell, Josh Jacobs, and Johnathan Abram, had their 5th-Year Options declined. However, they still played well enough to be above-average players. Plus, that doesn’t include gems they found later in the draft in Maxx Crosby and Hunter Renfrow.

    – Every team drafted at least one player who has played above the positional average compared to the rest of the draft class. However, Dallas (Trysten Hill), New England (N’Keal Harry), Philadelphia (Andre Dillard), Seattle (L.J. Collier), and Washington (Dwayne Haskins) were the only teams whose first draft selection wasn’t an above-average player.

    – The Cardinals draft class accumulated the most Total Points with 446, though as mentioned before, Kyler Murray accounted for 286 of them. They hit on 3 of 11 draft picks on their way to a No. 7 ranking. It’s worth noting that their Supplemental Draft selection of Jalen Thompson and his 73 Total Points isn’t included, as he isn’t part of their original draft class.

    – The fewest Total Points came from the Eagles. They garnered only 51 Total Points across their five draft picks, with 43 coming from Miles Sanders.

    – Hitting on quarterbacks is pivotal to winning in the NFL, as seen by Kyler Murray in 2019. Conversely, missing on quarterbacks can set teams back. Carolina and Cincinnati both took quarterbacks who severely hurt their Total Points number and pushed them down the rankings, even in minimal games played.

    Will Grier accounted for -26 Total Points out of Carolina’s 89 total. Funny enough, Brian Burns had 91 himself. Ryan Finley was even worse for Cincinnati with -39. In nine games in which Grier and Finley played and threw at least one pass, they combined for a 1-8 record.

    It’s possible the teams had a better chance of winning if neither played. If both had never played and accumulated 0 Total Points, Carolina would have improved four spots in the rankings and Cincinnati would have improved three spots.

    How do our Initial Grades Compare?

    56% (18/32) of our initial ranks were in the correct half. Meaning a team we ranked between 1 and 16 or 17 and 32 was ultimately in that tier. And before I get too much further, I want to make sure it’s understood that 2019 was our first year of the Handbook which meant there were plenty of growing pains. Major changes took place beginning in 2020 after studying our initial process.

    The biggest differences in our initial grades and these final rankings were the Bengals (25 spots), Eagles (23 spots), and the Ravens (23 spots). We rated these teams near the top immediately following the draft, but they finished near the bottom based on these rankings.

    For Cincinnati, we’ve already talked about Ryan Finley (who was our No. 4 QB), but they also drafted two running backs. Rodney Anderson (SIS No. 4 RB) has battled injuries his entire career and Trayveon Williams (SIS No. 5 RB) has been buried on the depth chart and has seen minimal playing time.

    The Eagles took four of five players who were featured in the Handbook, with Miles Sanders and Andre Dillard both grading out as a 6.7. As mentioned earlier, Dillard was one of the top picks who has failed to be an above-average player. For Baltimore, all eight selections were in the Handbook, and we graded six of them at 6.4 or higher. They clearly have underperformed based on our initial grading.

    What were some of our biggest misses elsewhere? Not including Mecole Hardman or Sean Murphy-Bunting proved to be a big miss. As mentioned before, immediate action was taken to improve upon our process to make sure we weren’t missing good players and early draft picks.

    Additionally, we ranked Wisconsin OG Beau Benzschawel as our No. 4 guard and New Mexico State LB Terrill Hanks as our No. 5 linebacker. Neither have played a snap in the NFL.

    Nik Needham is first and foremost when we talk about our NFL Draft wins. He’s been a big talking point around the company for the past three years. We ranked him as our No. 4 corner going into the draft, and he currently ranks third in Total Points among 2019 CBs (we were higher on him than any other mainstream draft analyst). His 85 Total Points tops all UDFAs from the 2019 class and ranks 12th overall.

    The table below shows the top Total Points earners across the past three seasons and how we graded and ranked them in the Handbook.

    Rank Position Player Total Points SIS Grade SIS Pos Rank
    1 QB Kyler Murray 286 6.8 2
    2 ED Nick Bosa 120 7.0 1
    3 LB Devin White 99 7.0 1
    4 CB Jamel Dean 97 6.7 6
    T-5 ED Maxx Crosby 96 6.5 11
    T-5 CB Byron Murphy 96 6.9 3
    T-5 WR Deebo Samuel 96 6.7 4

    While we were a little low on Dean and Crosby, all eight of these guys were tabbed as starters in some form by our scouts.

    Conclusion

    Nobody really knows how a draft class is going to turn out immediately after the draft, as stated before, yet it still makes sense to grade and rank the teams based on player grades for an initial reaction. Post-draft grades are great in a sense, but they should be taken with a grain of salt. Once three years go by and we’ve seen what these players have done in the NFL, we can get a better sense of how good the team drafted.

    These rankings are all about finding which teams drafted the best draft class as a whole, not just who got the best player. While there are some players who didn’t play for the team that drafted them for the entirety of the past three seasons, that wasn’t taken into account since those decisions came after the initial drafting of these players, which is what this is based off of. It’s not a perfect science, but it does a good job at pulling player value and seeing how well teams drafted as a whole class.

    Three years later, the comparison between our initial rankings and these rankings aren’t terrible for Year 1 (in both our grading and our scouting process). Though, we hope this article next year takes a large positive swing given the process changes we made heading into the 2020 cycle.

    As with everything we do here, we hope this improves year over year and can look back and say we kept getting better every day.

    Appendix

    2019 SIS Post-Draft Rankings based on the SIS Football Rookie Handbook

    Team Book Rank Grade
    Titans 1 6.63
    Bills 2 6.50
    Cardinals 3 6.46
    Ravens 4 6.44
    Bengals 5 6.44
    Raiders 6 6.40
    Broncos 7 6.38
    Eagles 8 6.34
    Jaguars 9 6.33
    Cowboys 10 6.30
    Patriots 11 6.30
    Rams 12 6.30
    Falcons 13 6.29
    Giants 14 6.28
    Panthers 15 6.24
    Packers 16 6.24
    Dolphins 17 6.22
    Steelers 18 6.21
      Commanders 19 6.21
    49ers 20 6.20
    Buccaneers 21 6.20
    Jets 22 6.20
    Texans 23 6.17
    Vikings 24 6.14
    Bears 25 6.14
    Chargers 26 6.13
    Colts 27 6.12
    Saints 28 6.12
    Browns 29 6.10
    Seahawks 30 6.03
    Lions 31 6.00
    Chiefs 32 5.90

    TP Rank based on TP Score and how much value each team got from their draft picks over the last three seasons

    Team TP Rank TP Score
    Titans 1 84.64
    Broncos 2 82.81
    Raiders 3 77.23
    Buccaneers 4 67.50
    Jaguars 5 62.18
    49ers 6 60.19
    Cardinals 7 51.60
    Packers 8 48.38
    Saints 9 48.16
    Chiefs 10 44.50
    Commanders 11 43.68
    Dolphins 12 41.00
    Giants 13 40.80
    Texans 14 37.96
    Bills 15 36.00
    Rams 16 34.72
    Jets 17 32.89
    Browns 18 30.00
    Colts 19 29.25
    Lions 20 27.77
    Falcons 21 25.16
    Vikings 22 22.00
    Cowboys 23 21.72
    Steelers 24 18.81
    Patriots 25 18.60
    Bears 26 17.28
    Ravens 27 16.25
    Chargers 28 16.00
    Panthers 29 14.53
    Bengals 30 12.48
    Eagles 31 12.24
    Seahawks 32 10.12


  • Study: College Football Injury Overview

    Study: College Football Injury Overview

    Every player in our NFL Draft site has had their injury history reviewed. Each player page has a space to indicate two types of injury designations: long-term injury risk or currently injured. Long-term injury risk measures how problematic or detrimental a player’s injury history may affect  their participation at the next level. If a player is deemed to be at high risk of injury he is given a red flag. Moderate risk players are given a yellow flag and low-risk players are given a green flag. 

    This season, each long-term injury risk flag was determined and supported by published research. Injuries such as ACL tears, spinal injuries and shoulder injuries requiring surgery are likely to prompt a yellow or red flag depending on the player’s position.

    For example, meniscectomies (surgery to treat damaged meniscus) to specifically linemen, running backs, defensive backs and linebackers have been a significant hindrance to the number of snaps and games played in the NFL – and thus given a red flag.1

    This isn’t to say that unnamed position groups are scot-free with a history of meniscal damage, but there is simply evidence that the named groups are at a higher risk.

    Currently, 77% of the players in the SIS NFL Draft site have been given a green flag. They carry unremarkable injury histories to suggest long-term injury risks leading up to the big draft day. Many of these players have been injured in college and high school, but the injuries have little cause for concern. 

    The yellow flag has been given out to 20% of the players as moderate risk which leaves 3% for the dreaded red flag. The ‘currently injured’ tag is used for players dealing with an injury that will limit their participation in the draft process, but will not necessarily have lasting effects during their career. For example, Jeremy Ruckert has not been able to participate at the combine or Ohio State’s pro day due to a minor foot injury. 

    All of the 2021 injury data displayed below has been collected here at Sports Info Solutions. The injury data is accumulated via our Video Scouts recording every injury event that occurred in the FBS. Every tagged injury is video-audited by our injury department and updated using media reports until the player has healed. Along with tagging the injured players during a play, scouts will also record the initial injury severity, using a scale from 1 to 5 with objective definitions.

    • Severity 1 equates to an apparent injury with no visible reaction by a player. These are particularly difficult to notice, like when a lineman gets rolled up on from behind but shows no signs of pain after the play. 
    • Severity 2 occurs when a player physically shows pain, but stays on the field for at least one more play. 
    • Severity 3 takes place when an injury forces a player to remove himself from a play.
    • Severity 4 happens when the player requires a timeout on the field prior to receiving assistance leaving the field. 
    • Severity 5 injury is reserved for an extreme situation when a player requires a cart or stretcher to be removed from the field. 

    Injuries by Team

    Below are the 25 most-injured teams in the FBS during the 2021 season. The table breaks down each team’s injuries by two initial severity groups – Severe (4, 5) and Not Severe (1, 2, and 3). The injuries column is the sum of all in-game injuries tagged and off-field injuries reported. Games missed equates to the total number of absences due to injury for the entire team over the course of the season.

    Tennessee tops the list at 81 in-game injuries in 2021 and happened to suffer the 15th-most injuries of 2020 as well. Oregon and Clemson stand out in total games missed due to injury over the season. Both teams had relatively successful seasons despite having to overcome tremendous absences.

    Last season’s most often injured team, Florida State, turned things around by being outside of the 75 most injured teams of 2021. FSU made this reversal while bringing on the only quarterback to be tagged with the red flag, McKenzie Milton.

    Milton suffered a devastating dislocated right knee in a game during the 2018 season. Surgery saved his leg after ligament, arterial and nerve damage threatened his chances of ever playing again. He was able to play 6 games in 2021 after 2 seasons of rehabilitation. He’s a talented player, but his injury will be something NFL Draft war rooms discuss when Milton’s name is brought up.

    Team Conf Severe Not Severe Injuries Games Missed
    Tennessee SEC 60 21 83 39
    Texas A&M SEC 34 32 77 63
    Pittsburgh ACC 55 21 77 24
    Penn State BIG10 26 41 69 11
    Oregon PAC12 29 25 68 105
    Rice CUSA 45 23 68 31
    Virginia Tech ACC 39 21 67 46
    Texas BIG12 36 22 66 41
    Virginia ACC 34 27 66 24
    Georgia Tech ACC 37 22 66 22
    Kentucky SEC 46 17 65 17
    North Texas CUSA 41 22 64 31
    Clemson ACC 24 23 63 97
    Arizona State PAC12 26 26 63 51
    Ole Miss SEC 43 18 63 10
    Wisconsin BIG10 21 22 61 49
    Purdue BIG10 30 22 60 57
    Alabama SEC 21 25 59 58
    Eastern Michigan MAC 46 12 58 20
    Colorado State MW 28 26 58 14
    Oklahoma State BIG12 19 24 57 43
    Utah State MW 35 19 55 22
    Mississippi State SEC 22 60 54 12
    Indiana BIG10 32 17 53 49


    Injuries by Position

    When taking a look at injuries that occur during a game, it’s particularly interesting to break down the data by position. In the positional table below, the ‘Severe’ and ‘Severe%’ columns denote injuries that were charted as Severity 4 or 5. The 2021 data aligns with the same findings in the previous 2 seasons – the defensive line is the most dangerous position to play.

    We have 6 defensive linemen with a red flag and another 17 with a yellow flag. Particularly concerning injuries for the d-line are shoulder injuries that damage the rotator cuff, labrum, or capsule causing instability to the joint. Defensive linemen with these injuries have historically had a shorter career in the league and a decreased chance of being drafted.2

    Tyler Johnson of Arizona State is one of those players with an unfortunate history of a shoulder labrum and rotator cuff injury in 2018. He admitted he almost retired due to the pain that lingered in his shoulder over the course of the following season.

    PositionName Injuries Games Missed Severe Severe %
    DL 873 408 646 79%
    WR 873 583 267 35%
    LB 720 431 481 72%
    QB 658 431 139 23%
    CB 673 418 451 74%
    RB 610 316 181 33%
    OL 601 533 402 75%
    S 542 387 358 71%
    TE 250 239 89 41%


    Injuries by Body Part


    When the 2021 injury data is broken down by region injured it’s no surprise to see knee and ankle injuries at the top of the totals. There were 1,386 injury timeouts (severity 4) in FBS due to knee and ankle injuries alone. When speaking of knees, the dreaded ACL tear is often spoken of in an overly cautious manner for these prospects.

    Surprisingly, a single instance of an ACL tear and reconstruction only warrants a yellow flag for all position groups besides OL, DL and LB (red flag). Historically, prospects from all positions with an ACL injury have been picked lower in the draft on average.4 This could perhaps lead to hidden value in players like George Pickens, Treylon Burks, John Metchie and Jameson Williams who all have been given a yellow flag. 


    Part Injuries Games Missed
    Knee 1065 1186
    Ankle 897 530
    Shoulder 582 314
    Neurological 560 154
    Calf 243 35
    Chest 179 37
    Hamstring 155 33
    Hand 127 69
    Ribcage 105 28
    Foot 90 180


    Injury Designations

    The player injury designation table summarizes only the players within the draft site who have been identified in their player profile as having at least one of a yellow flag, red flag, or currently injured tag. On this list you will see players such as Justyn Ross as he has dealt with a congenital fusion in his cervical spine plus a stress fracture in his foot – both requiring surgery. 


    Position Player Red Flag Yellow Flag Currently Injured
    QB Davis Cheek, Elon x
    QB EJ Perry, Brown x
    QB D’Eriq King, Miami FL x
    QB McKenzie Milton, Florida State x
    QB Skylar Thompson, Kansas State x
    QB Jack Coan, Notre Dame x
    QB Carson Strong, Nevada x
    RB Vavae Malepeai, USC x
    RB Brittain Brown, UCLA x
    RB LD Brown, Oklahoma State x
    RB Shamari Brooks, Tulsa x
    RB Ronnie Rivers, Fresno State x
    RB Jerrion Ealy, Ole Miss x
    RB Zamir White, Georgia x
    RB Malik Davis, Florida x
    RB Kevin Harris, South Carolina x
    RB Master Teague III, Ohio State x
    RB Cam’Ron Harris, Miami FL x x
    RB Mataeo Durant, Duke x
    RB Ricky Person, Jr., NC State x
    RB Zonovan Knight, NC State x
    RB Max Borghi, Washington State x
    RB Kennedy Brooks, Oklahoma x
    RB Abram Smith, Baylor x
    WR Drake London x
    WR Christian Watson, North Dakota State x
    WR Demetris Robertson, Auburn x
    WR Changa Hodge, Virginia Tech x
    WR Reggie Roberson, Jr., SMU x
    WR Corey Sutton, Appalachian State x x
    WR George Pickens, Georgia x
    WR Treylon Burks, Arkansas x
    WR John Metchie, Alabama x x
    WR Jameson Williams, Alabama x x
    WR David Bell, Purdue x
    WR Justyn Ross, Clemson x
    WR Tre Turner, Virginia Tech x
    WR Britain Covey, Utah x
    WR Jalen Tolbert, South Alabama x
    WR Khalil Shakir, Boise State x
    TE Nick Muse, South Carolina x
    TE Trae Barry, Boston College x
    TE Chase Allen, Iowa State x
    TE John FitzPatrick, Georgia x
    TE Jeremy Ruckert, Ohio State x
    TE Peyton Hendershot, Indiana x
    TE Austin Allen, Nebraska x
    TE Braden Galloway, Clemson x
    TE James Mitchell, Virginia Tech x x
    TE Charlie Kolar, Iowa State x
    OL Justin Shaffer, Georgia x
    OL Thayer Munford, Ohio State x
    OL AJ Arcuri, Michigan State x
    OL Navaughn Donaldson, Miami FL x
    OL Jarrid Williams, Miami FL x
    OL Jack Wohlabaugh, Duke x
    OL Denzel Okafor, Texas x
    OL Josh Sills, Oklahoma State x
    OL Zachary Thomas, San Diego State x
    OL Chasen Hines, LSU x
    OL Brodarious Hamm, Auburn x
    OL Case Cook, Missouri x
    OL Andrew Stueber, Michigan x
    OL Alec Anderson, UCLA x
    OL Dawson Deaton, Texas Tech x
    OL Luke Goedeke, Central Michigan x
    DL Jayden Peevy, Texas A&M x
    DL Perrion Winfrey, Oklahoma x
    DL Kobie Whiteside, Missouri x
    DL Julian Rochester, Georgia x
    DL Miles Fox, Wake Forest
    DL Keyshon Camp, Pittsburgh x
    DL Ralfs Rusins, Liberty x
    DL Jordan Jackson, Air Force x
    DL DeMarvin Leal, Texas A&M x
    DL Kalia Davis, UCF x
    DL Viane Moala, Utah x
    DL Jeremiah Moon, Florida x
    DL Ryder Anderson, Indiana x
    DL Tomon Fox, North Carolina x
    DL Ryan Bowman, Washington x x
    DL Scott Patchan, Colorado State x
    DL Arron Mosby, Fresno State x
    DL Christopher Allen, Alabama x
    DL Kingsley Enagbare, South Carolina x
    DL David Ojabo, Michigan x x
    DL Tyreke Smith, Ohio State x
    DL Luiji Vilain, Wake Forest x
    DL Tyler Johnson, Arizona State x
    DL Mika Tafua, Utah x
    DL Alex Wright, UAB x
    LB Troy Andersen, Montana State x
    LB James Houston IV, Jackson State x
    LB Aaron Hansford, Texas A&M x
    LB JoJo Domann, Nebraska x
    LB Jake Hansen, Illinois x
    LB James Skalski, Clemson x
    LB Nate Landman, Colorado x
    LB Riley Whimpey, Boise State x
    LB Damone Clark, LSU x x
    LB Nakobe Dean, Georgia x
    LB Jaylan Alexander, Purdue x
    LB Khalan Tolson, Illinois x
    LB Nephi Sewell, Utah x
    LB Terrel Bernard, Baylor x
    LB Drew White, Notre Dame x
    LB Chad Muma, Wyoming x
    DB Matt Hankins, Iowa x
    DB Coney Durr, Minnesota x
    DB Caesar Williams, Wisconsin x
    DB Meiko Dotson, Florida State x
    DB Damarri Mathis, Pittsburgh x
    DB Christian Holmes, Oklahoma State x
    DB Derek Stingley Jr., LSU x
    DB Josh Jobe, Alabama x x
    DB Jalyn Armour-Davis, Alabama x
    DB Montaric Brown, Arkansas x
    DB Akayleb Evans, Missouri x
    DB Faion Hicks, Wisconsin x
    DB Jermaine Waller, Virginia Tech x
    DB Andrew Booth Jr., Clemson x x
    DB Mario Goodrich, Clemson x
    DB Josh Blackwell, Duke x
    DB Isaac Taylor-Stuart, USC x
    DB Josh Thompson, Texas x
    S Jaylon Jones, Ole Miss x
    S Cameron Lewis, LSU x
    S Deontai Williams, Nebraska x
    S Marquel Dismuke, Nebraska x
    S Marcelino McCrary-Ball, Indiana x
    S Nolan Turner, Clemson x
    S De’Vante Cross, Virginia x
    S Tariq Carpenter, Georgia Tech x
    S Tycen Anderson, Toledo x
    S Shaq Bond, Utah State x
    S Daniel Wright, Alabama x
    S Smoke Monday, Auburn x
    S Scott Nelson, Wisconsin x
    S Bubba Bolden, Miami FL x
    S Isaiah Pola-Mao, USC x
    S Kolby Harvell-Peel, Oklahoma State x
    S Tre Sterling, Oklahoma State x
    S Jalen Pitre, Baylor x
    S Kyle Hamilton, Notre Dame x
    S Percy Butler, Louisiana x

    References

    1. Brophy RH, Lyman S, Chehab EL, Barnes RP, Rodeo SA, Warren RF. Predictive value of prior injury on career in professional American football is affected by player position. Am J Sports Med. 2009;37(4): 768-775.
    2. Brophy RH, Gill CS, Lyman S, Barnes RP, Rodeo SA, Warren RF. Effect of shoulder stabilization on career length in National Football League athletes. Am J Sports Med. 2011;39(4):704-70.
    3. Kluczynski, M., Kelly, W., Lashomb, W., & Bisson, L. (2019). A Systematic Review of the Orthopaedic Literature Involving National Football League Players. Orthopaedic Journal Of Sports Medicine, 7(8).
    4. Provencher MT, Bradley JP, Chahla J, et al. A history of anterior cruciate ligament reconstruction at the National Football League Combine results in inferior early National Football League career participation. Arthroscopy. 2018;34(8):2446-2453.
    5. Wang, D., Weiss, L., Abrams, M., Barnes, R., Warren, R., Rodeo, S., & Taylor, S. (2018). Athletes With Musculoskeletal Injuries Identified at the NFL Scouting Combine and Prediction of Outcomes in the NFL: A Systematic Review. Orthopaedic Journal Of Sports Medicine, 6(12).