By MARK SIMON & ALEX VIGDERMAN
There was some significant movement in our World’s No. 1 Quarterback Rankings as the 2020 NFL regular season concluded.
One product of our system is that inactivity hurts. As such, Aaron Rodgers did enough in his Week 17 showing to edge past Patrick Mahomes into the No. 1 spot entering the playoffs. Rodgers had closed the gap considerably in Week 16, as Mahomes had his worst game by Points Above Average (PAA) in the last three seasons in the Chiefs’ win over the Falcons.
Rodgers has been what most quarterbacks have not been–ultra-consistent. He put up 10 straight games with a positive PAA, with his only negative being a -0.3 in Week 17 (in which three dropped interceptions served to counteract his stellar base-level stat line of 19-for-24 with four touchdowns).
Given that our tracking continues into the postseason, perhaps the debate over the World’s No. 1 Quarterback will get settled in the Super Bowl.
The World’s No. 1 Quarterback Ranking is based on a model devised by Bill James to evaluate The World’s No. 1 Starting Pitcher. Bill’s model was based on cumulative evaluation of individual starts over an extended time period using the metric Game Score. The World’s No. 1 Quarterback Ranking uses our player value stat, Total Points to make a cumulative evaluation of game performance over a three-year period. The key to our calculation is PAA, the statistical underpinning of Total Points that is centered at zero so that positive numbers are above average and negative numbers are below average.Success over time is key to maintaining a good ranking. Prolonged inactivity results in a ranking drop. The most recent performances carry the most weight.
The Mahomes-Rodgers flip wasn’t the only notable change in our rankings. Take a look at our new Top 10:
1. Aaron Rodgers
2. Patrick Mahomes
3. Tom Brady
4. Deshaun Watson
5. Josh Allen
6. Russell Wilson
7. Derek Carr
8. Lamar Jackson
9. Ryan Tannehill
10. Kirk Cousins
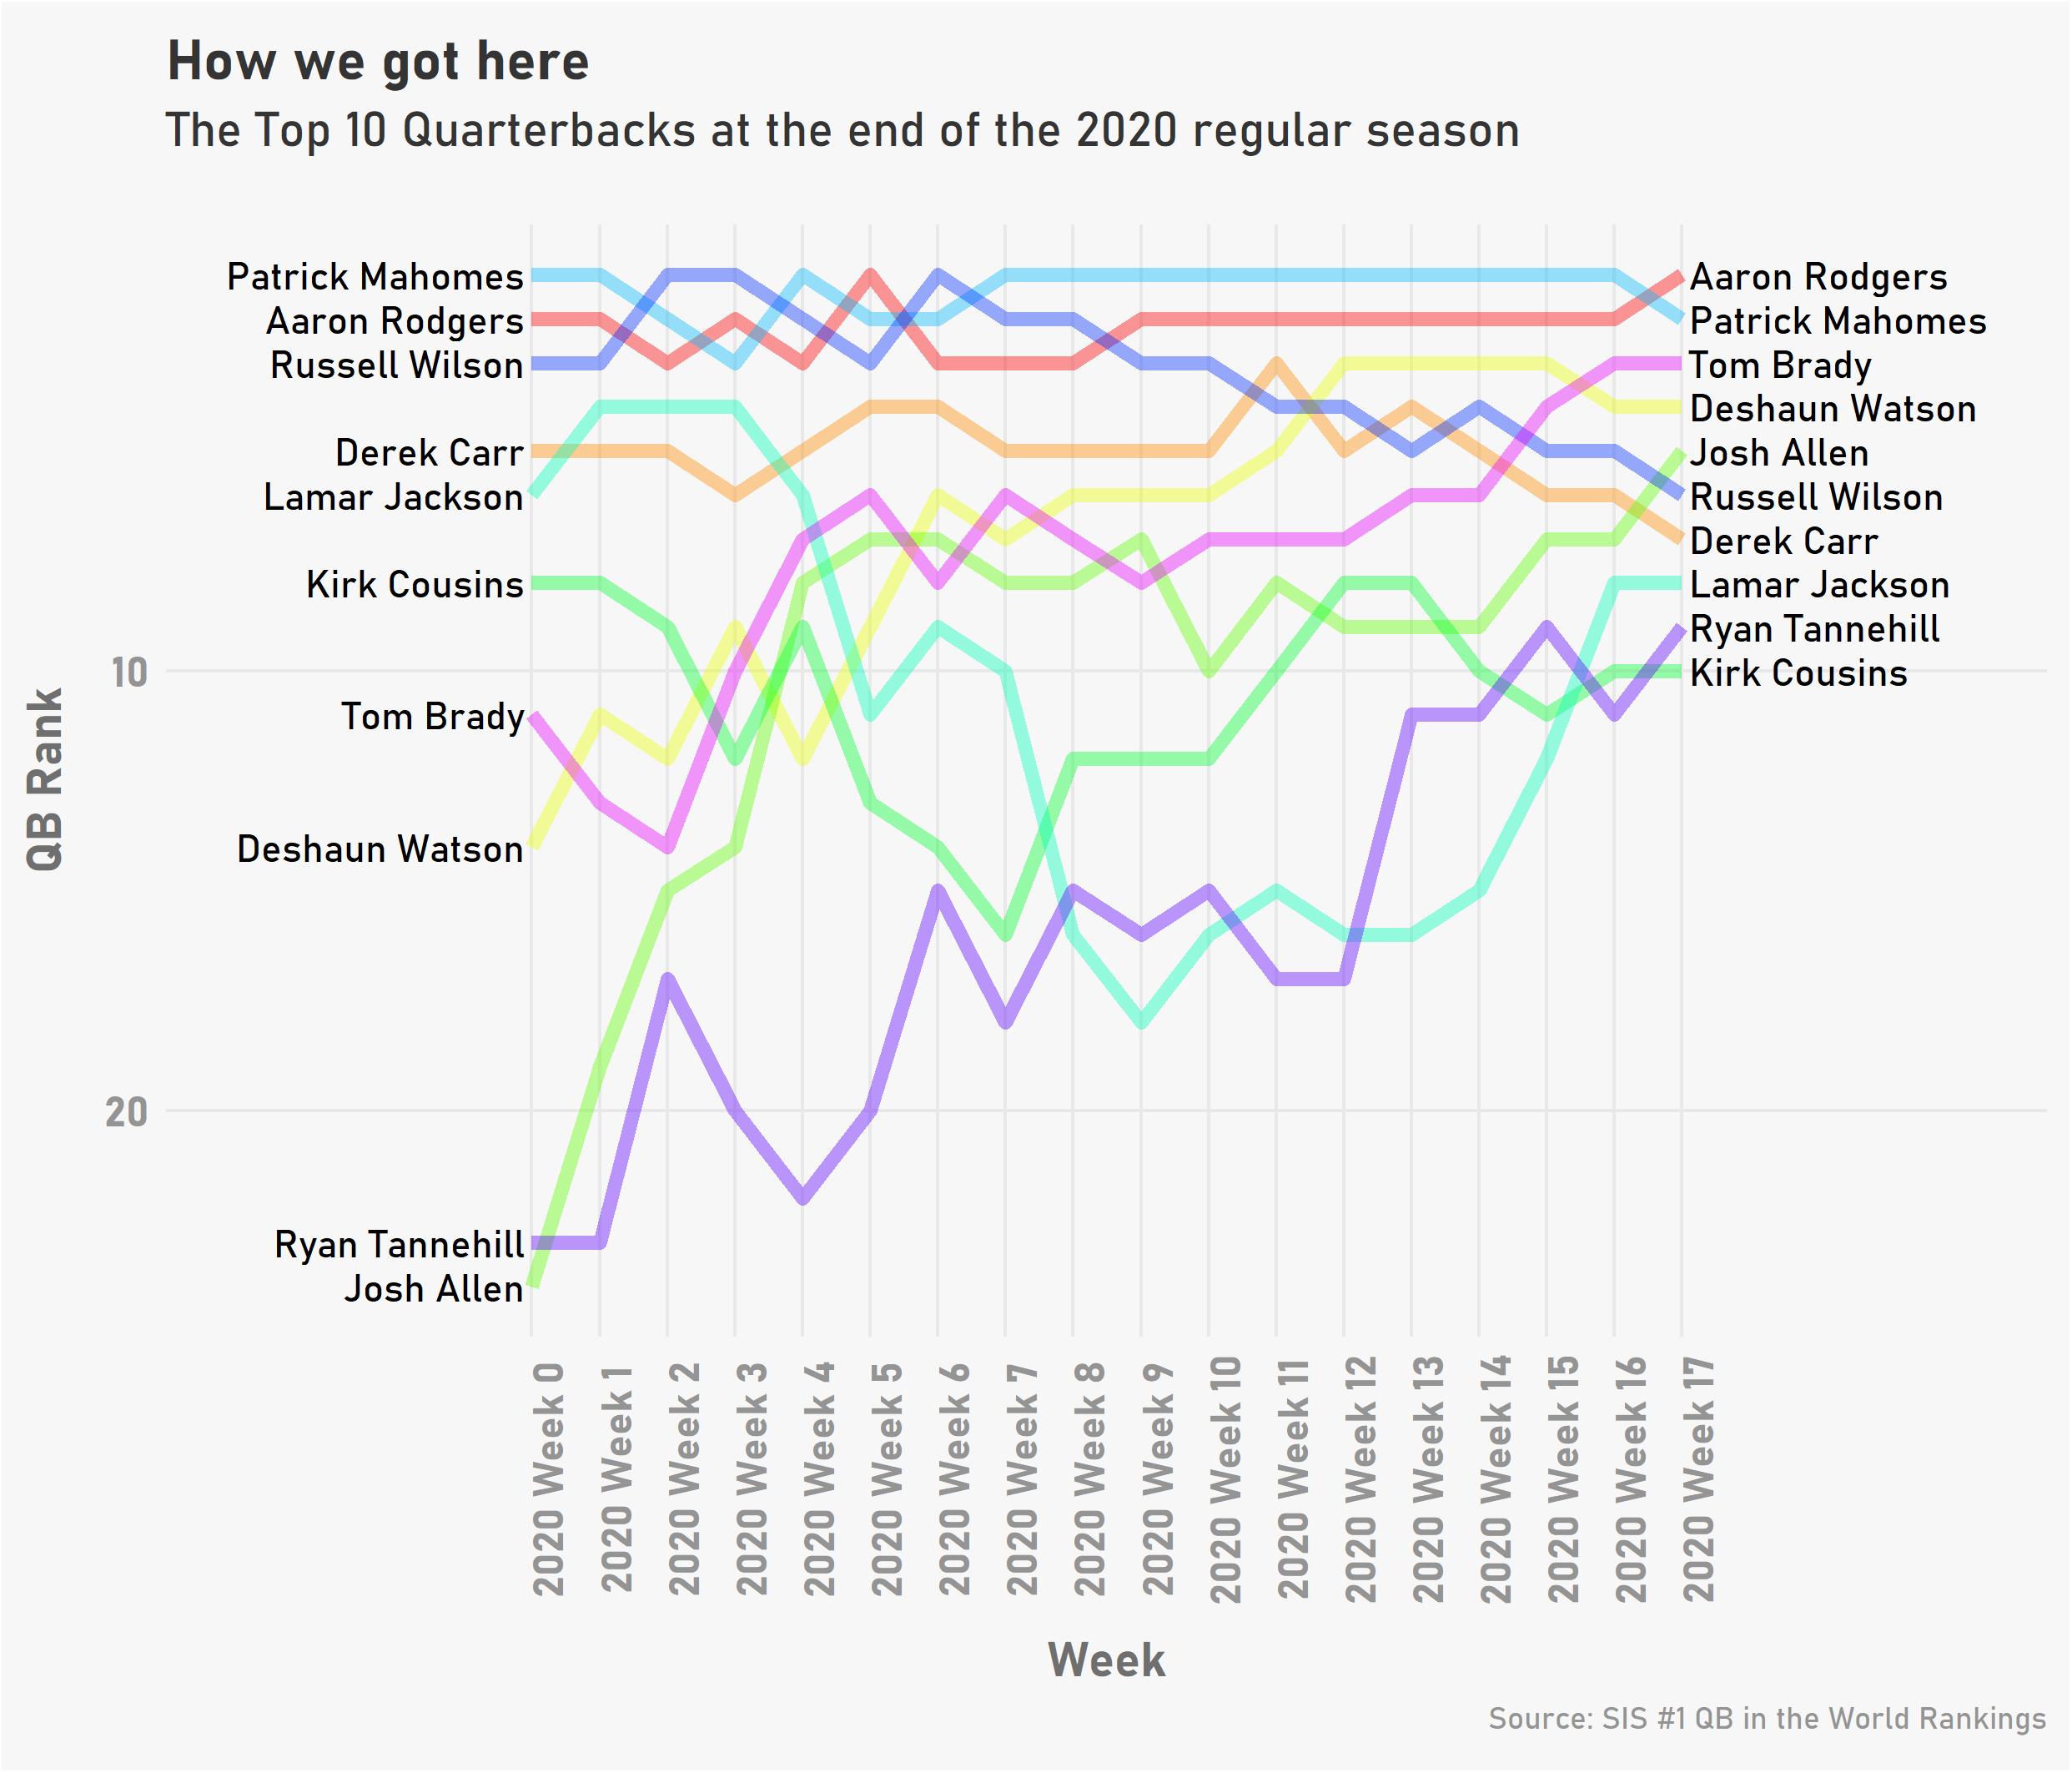
Apparently Tom Brady still had something left. After throwing two interceptions in Week 1, Brady ranked 14th, and even after recovering from that, he was still in the No. 9 slot after throwing three interceptions against the Saints in Week 9.
But Brady got hot at the right time. He had his best and third-best games in the last three weeks of the season. He’s the leader among quarterbacks in PAA since Week 10, nearly nine points ahead of the closest quarterback, Lamar Jackson.
Much of Brady’s value since Week 10 has stemmed from late-down success. He has the most Points Earned of any quarterback on third and fourth downs in that span, due in part to his six third-down touchdowns, second-most of any quarterback. He was also among the best passers in terms of air yards per completion during that run.
Josh Allen’s ascent to No. 5 is also noteworthy. His career-best game by PAA came in Week 16 against the Patriots, one week after he had a big game against the Broncos. After starting the season as the No. 24 ranked quarterback, Allen moved into the top 10 after the Bills’ win in Week 4 against the Raiders. His only significant step back came when he threw two interceptions in a loss to the Cardinals, which dropped him from No. 7 to No. 10. But since Week 13, he’s had the fourth-highest PAA total of any quarterback. His leap to elite status will be tested this postseason.
Lamar Jackson took a circuitous route to his current No. 8 ranking. He started the season as the No. 6 quarterback, bumped to No. 4 after a big game against the Browns in Week 1. Then came a decrescendo including two of the worst games of the season, when he scored -16 PAA against the Bengals and -14 PAA against the Steelers. Jackson slipped all the way to No. 18 before making a steady climb. He’s held the No. 8 spot the last two weeks.
Jackson has been better with both the run and the pass during the Ravens’ five-game winning streak.
|
First 10 Games |
Last 5 Games |
|
|
Comp Pct |
63% |
67% |
|
TD-Int |
15-6 |
11-3 |
|
Sacks |
24 |
5 |
|
Rush Yards Per Game |
57.5 |
86 |
The most prominent drop in the rankings is Russell Wilson’s.
Wilson is often viewed as a Top-3 quarterback but has now slipped to No. 6 overall.
He started the season with seven straight games with a non-negative PAA. But he had five negative-PAA games in his last nine games. He finished the regular season with 13 interceptions and also hurt his rating with a pair of multi-fumble games in those last nine contests.
Here are the full rankings through the final week of the regular season.
| Rk | Player | PAA per 60 | Last Rk | Start Of Season |
| 1 | Aaron Rodgers | 7.2 | 2 | 2 |
| 2 | Patrick Mahomes | 7.1 | 1 | 1 |
| 3 | Tom Brady | 5.4 | 4 | 11 |
| 4 | Deshaun Watson | 5.3 | 3 | 14 |
| 5 | Josh Allen | 4.1 | 7 | 24 |
| 6 | Russell Wilson | 3.9 | 5 | 3 |
| 7 | Derek Carr | 3.0 | 6 | 5 |
| 8 | Lamar Jackson | 2.9 | 8 | 6 |
| 9 | Ryan Tannehill | 2.5 | 11 | 23 |
| 10 | Kirk Cousins | 2.4 | 10 | 8 |
| 11 | Matt Ryan | 2.4 | 12 | 10 |
| 12 | Drew Brees | 2.1 | 9 | 4 |
| 13 | Justin Herbert | 1.9 | 14 | N/A |
| 14 | Philip Rivers | 1.9 | 13 | 12 |
| 15 | Matthew Stafford | 0.9 | 16 | 16 |
| 16 | Kyler Murray | 0.6 | 15 | 17 |
| 17 | Baker Mayfield | 0.4 | 17 | 35 |
| 18 | Ryan Fitzpatrick | 0.0 | 19 | 13 |
| 19 | Dak Prescott | 0.0 | 20 | 7 |
| 20 | Taysom Hill | -0.4 | 21 | 18 |
| 21 | Teddy Bridgewater | -0.7 | 18 | 22 |
| 22 | Jacoby Brissett | -0.8 | 22 | 9 |
| 23 | Jared Goff | -1.1 | 23 | 15 |
| 24 | Cam Newton | -1.2 | 27 | 28 |
| 25 | Joe Burrow | -1.5 | 24 | N/A |
| 26 | Jimmy Garoppolo | -1.8 | 26 | 20 |
| 27 | John Wolford | -1.9 | N/A | N/A |
| 28 | Drew Lock | -2.1 | 36 | 53 |
| 29 | Chad Henne | -2.2 | N/A | N/A |
| 30 | Marcus Mariota | -2.2 | 28 | 40 |
| 31 | Mason Rudolph | -2.4 | 58 | 66 |
| 32 | Matt Moore | -2.4 | 30 | 25 |
| 33 | C.J. Beathard | -2.4 | 61 | 54 |
| 34 | Gardner Minshew | -2.4 | 31 | 41 |
| 35 | Jeff Driskel | -2.5 | 32 | 31 |
| 36 | Chase Daniel | -2.6 | 33 | 26 |
| 37 | Brett Hundley | -2.6 | 34 | 32 |
| 38 | Matt Schaub | -2.6 | 35 | 33 |
| 39 | Blake Bortles | -2.6 | 37 | 34 |
| 40 | Tua Tagovailoa | -2.6 | 25 | N/A |
| 41 | Blaine Gabbert | -2.7 | 38 | 60 |
| 42 | DeShone Kizer | -2.7 | 42 | 49 |
| 43 | Andy Dalton | -2.7 | 29 | 57 |
| 44 | Sean Mannion | -2.7 | 43 | 51 |
| 45 | Joe Webb | -2.7 | 44 | 59 |
| 46 | Joshua Dobbs | -2.7 | 45 | 52 |
| 47 | Josh McCown | -2.7 | 46 | 55 |
| 48 | Ben Roethlisberger | -2.7 | 47 | 36 |
| 49 | AJ McCarron | -2.8 | 51 | 58 |
| 50 | Jameis Winston | -2.8 | 52 | 30 |
| 51 | Kyle Allen | -2.8 | 53 | 76 |
| 52 | Matt Barkley | -2.8 | 54 | 64 |
| 53 | Garrett Gilbert | -2.8 | 55 | N/A |
| 54 | Taylor Heinicke | -2.8 | 56 | 72 |
| 55 | Nate Sudfeld | -2.9 | 41 | 44 |
| 56 | Nathan Peterman | -2.9 | 57 | 77 |
| 57 | Tyrod Taylor | -2.9 | 59 | 63 |
| 58 | Case Keenum | -2.9 | 60 | 38 |
| 59 | Colt McCoy | -3.0 | 62 | 71 |
| 60 | David Blough | -3.0 | 63 | 43 |
| 61 | Chris Streveler | -3.0 | N/A | N/A |
| 62 | Devlin Hodges | -3.0 | 65 | 70 |
| 63 | Joe Flacco | -3.1 | 64 | 62 |
| 64 | Brian Hoyer | -3.1 | 66 | 69 |
| 65 | Brett Rypien | -3.3 | 69 | N/A |
| 66 | Robert Griffin III | -3.3 | 70 | 61 |
| 67 | Phillip Walker | -3.3 | 49 | N/A |
| 68 | Jarrett Stidham | -3.3 | 67 | N/A |
| 69 | Jalen Hurts | -3.4 | 68 | N/A |
| 70 | Ben DiNucci | -3.4 | 71 | N/A |
| 71 | Josh Rosen | -3.5 | 72 | 78 |
| 72 | Nick Mullens | -3.5 | 73 | 37 |
| 73 | Daniel Jones | -3.5 | 77 | 73 |
| 74 | Kendall Hinton | -3.6 | 74 | N/A |
| 75 | Will Grier | -3.6 | 75 | 79 |
| 76 | Alex Smith | -3.7 | 76 | 21 |
| 77 | Mike Glennon | -3.8 | 79 | 39 |
| 78 | Brandon Allen | -3.9 | 50 | 67 |
| 79 | Nick Foles | -3.9 | 78 | 27 |
| 80 | Ryan Finley | -4.4 | 80 | 80 |
| 81 | Dwayne Haskins | -4.4 | 81 | 29 |
| 82 | Jake Luton | -4.7 | 82 | N/A |
| 83 | Mitchell Trubisky | -4.8 | 83 | 68 |
| 84 | Carson Wentz | -5.0 | 84 | 19 |
| 85 | Sam Darnold | -5.7 | 85 | 42 |