By ALEX VIGDERMAN
Sports Info Solutions’ flagship player value system, Total Points, has been upgraded again.
The incorporation of relatively new data points like defensive line techniques and the combination of initial and eventual run directions allow us to evaluate players on both sides of the ball with much more confidence as to who was involved on each play and to what extent. This new methodology combines new data points, improved evaluation strategies, and the usual tweaks and bug fixes that come every season.
Overview of the Methodological Improvements
- Identify the blockers and relevant defenders based on the players’ alignment and the run direction (both the designed run direction and the eventual run direction, where previously only the designed direction was used)
- For the offense, divide responsibility for the yards before contact (plus expected yards after contact) so that the back has more responsibility if he is contacted late in the play and less if he is contacted early in the play. Previously the distribution was a consistent amount across all kinds of runs.
- For the defense, estimate how likely each player is to have made the tackle given his alignment, and compare his actual results with that expectation. Tackles upfield are better than tackles downfield, and both are better than not making a tackle at all. Previously players who made a tackle downfield were losing value relative to not making a tackle, and players who did not make a tackle were not evaluated.
Details on the Methodological Improvements
Using both initial and eventual run direction
For the purposes of this discussion, a “bounce” is any run where the runner eventually ran to a gap further outside than intended, and a “cutback” is any run where the runner eventually ran to a gap further inside than intended.
This enhancement makes each run that features a bounce or cutback evaluated first based on the initial run gap (where the run was designed to go) and then again based on the eventual run gap (where the runner ended up going). The difference between those two evaluations is based on the number of gaps moved and the blocking scheme, treating any moves of at least three gaps as similar. Then, any evaluation of the initially-run-behind linemen is based on the change in expectation for runs with a similar bounce or cutback.
In most circumstances, a back bouncing a run outside or cutting it back means that the frontside linemen will be debited and the backside linemen credited. That’s consistent with the idea that if the play develops as designed the blockers at the point of attack are likely to have done well. And typically, the blockers at the gap the back ends up targeting are doing a good job to allow the cutback lane. That said, for example, cutbacks of three or more gaps are better than most bounces or cutbacks, so the frontside linemen won’t be debited as much (because a cutback isn’t such a bad thing in that spot) and the backside linemen won’t be credited as much (because the result isn’t expected to be as bad).
Adjusting credit based on the yards before contact
SIS uses a stat called “adjusted yards before contact”, which adds the expected yards after contact to the yards before contact on a play based on what typically happens on plays with similar blocking scheme and run direction. In the context of Total Points, the blockers on a play don’t get credit beyond the adjusted yards before contact.
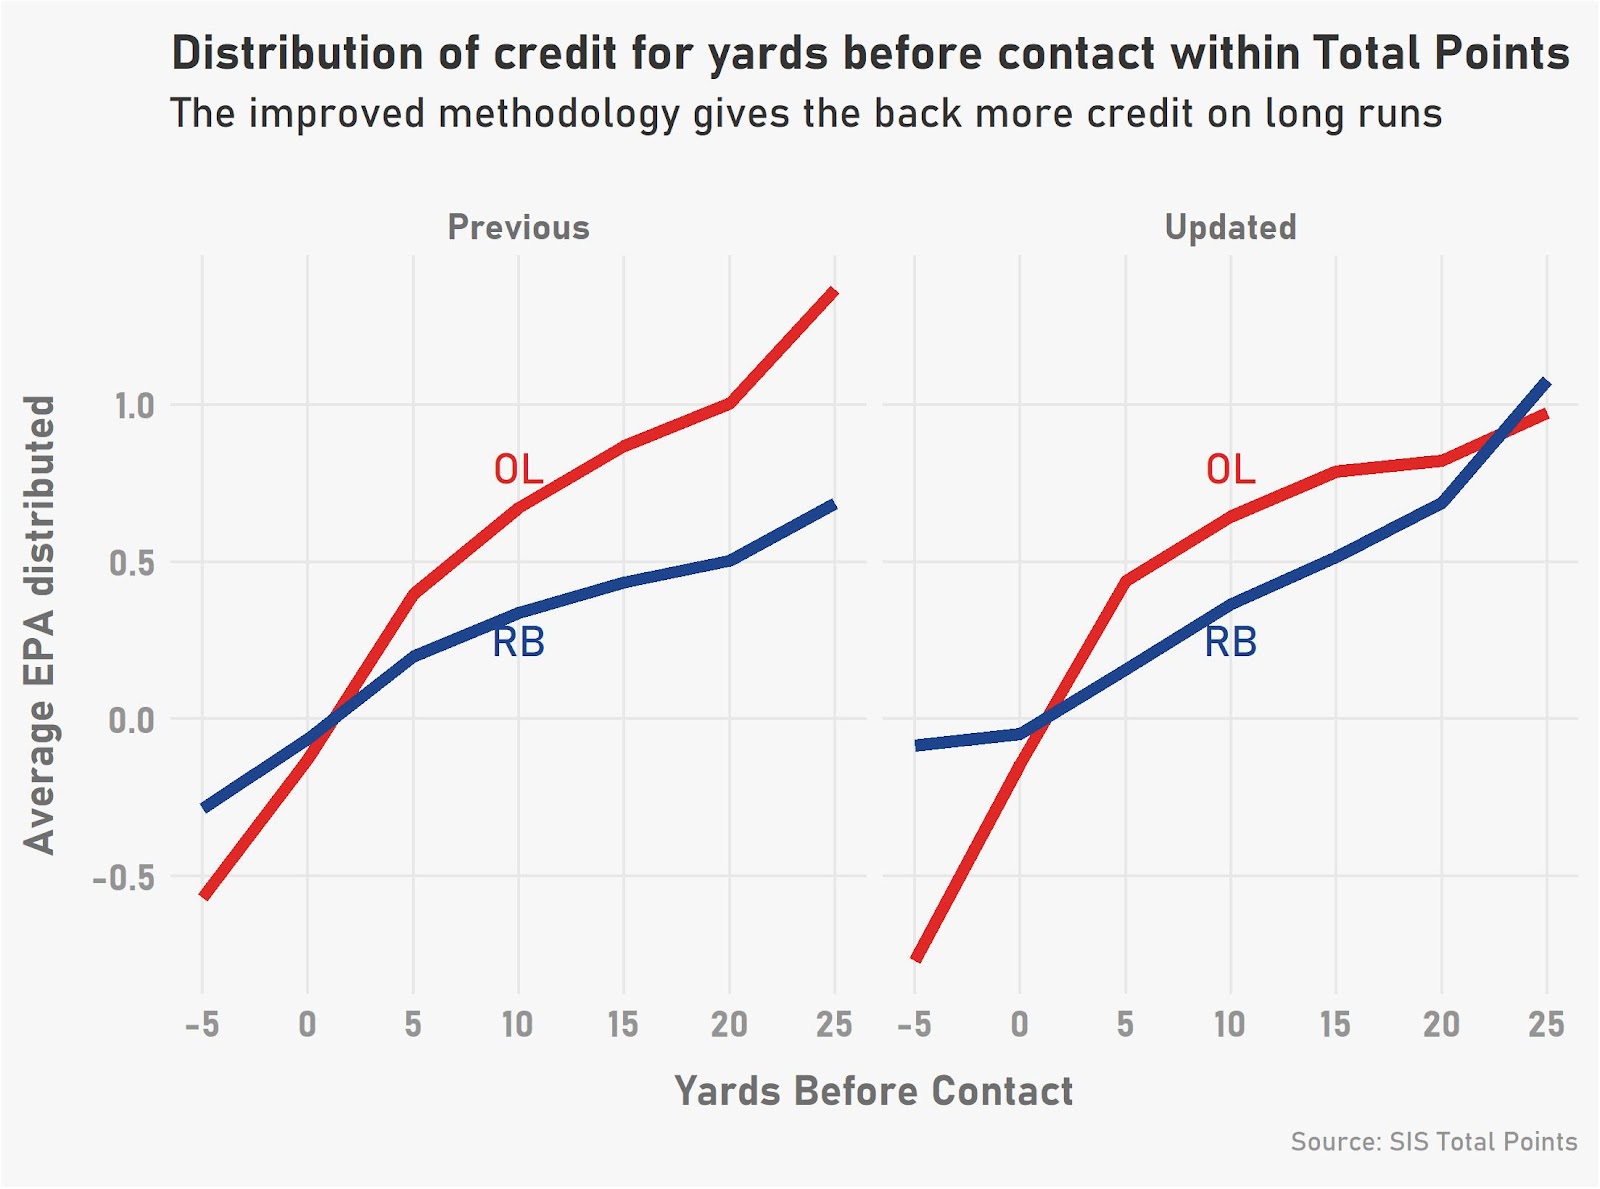
Adjusted yards before contact are now split into “first level” (YBC <= 5), “second level” (YBC between 6 and 15), and “open field” (YBC > 15). In allocating the EPA associated with adjusted yards before contact, the offensive line now receives 3/4 of the credit at the first level, half of the credit at the second level, and 1/4 of the credit in the open field. For runs that are stuffed where the rusher is contacted behind the line of scrimmage, the line is given 90% of the responsibility.
Here is an example of how reworking this breakdown affects how one would distribute EPA responsibility between the back and the offensive line, depending on the yards before contact on the run. The EPA shown is the value of the adjusted yards before contact.

The new system punishes the offensive line much more when the back is contacted early, and dramatically increases the back’s responsibility for downfield yards.
Adding defensive technique data
Defensive alignment data informs which players were run toward, and correspondingly how responsibility for a run’s initial success or failure should go to each player on the defensive front.
From 2019 forward the defensive alignment includes technique info for all down linemen. This allows for much more accurate judging of which defenders are most relevant.
To go with that, the alignment of defenders is now being considered along a continuum, where 0 is an outside cornerback on the offense’s left, 1 is an outside cornerback on the offense’s right, and anyone positioned between them has a number assigned based on their relative position. This makes it so that it’s not assumed that all adjacent defensive linemen are the same distance apart, which helps handle the variety of fronts defenses employ. This is used for determining which defenders are most relevant for runs in a certain direction or blown blocks by a certain offensive player.
Refining how tackles are evaluated
Before the 2019 season, SIS overhauled its evaluation of tackling in the run game to allow players to be measured based on how their tackle compared to the average tackle on similar plays from a similar position. For example, a tackle made by a MIKE on a strongside run into a heavy box would be compared to the average tackle made in those circumstances.
One big improvement is using what’s called a plus-minus system. We measure each player’s odds of making a tackle using his alignment and the run direction, and every player is given credit or debit based on whether he made the tackle and how likely he was to make it. That plus-minus value—which will be positive for the tackler(s) and negative for everyone else—is multiplied by the EPA value of that tackle. For the non-tacklers, that EPA is the average result of similar plays, since we don’t know where they would have made the tackle.
The plus-minus calculation described above is modified such that it’s better to make a tackle than not, even if it was after a big gain.
Here is how this works out for two sample plays from last season.
Each player has a percentage that indicates how likely he was to make a tackle based on historical data, and a decimal value that shows how much value (in terms of EPA) he was credited or debited based on his tackling or lack thereof.
Please keep in mind that the positions of the safeties and off-ball linebackers are estimated based on typical locations for those players and are not the players’ specific locations for that play.
Total Points Run Tackle Evaluation: Pitch to right D-gap for 30 yard run

On this play, the left safety is one of the more likely players to make the tackle, and he does so, getting some credit. Everyone else on the play is dinged slightly, with the linebackers punished most because they were the most likely possible tacklers.
Total Points Run Tackle Evaluation: Goal Line Power to right C-Gap for 0 yard gain

In this case, the left end plugs up the hole and tackles the ballcarrier at the point of attack, getting a decent chunk of credit. The other players get a very small demerit for not being involved on the tackle (even though it was very unlikely for the backside players).
It’s worth noting that in both of these cases, any of the value that these players might have accumulated based on the yards before contact on the play (as described above) are carved out, so that there isn’t any double-counting of responsibility for players on the defensive front.
Other improvements
- In calculating the expected yards after contact on a run play, research suggests that yards after contact is higher when the runner is contacted early or late (and lower around the line of scrimmage). As a result, several tiers of yards before contact (e.g. 0-1, 2-3, 4-5, 6+) are now being used to determine expected yards after contact more accurately.
- To ensure that there isn’t double-counting when evaluating the defensive backfield and defensive front on a pass attempt, the value accumulated by the defensive front is subtracted from that of the defensive backfield when calculating Total Points. For example, if the defense forced two blown blocks and the quarterback attempted the throw under duress, the defensive backfield is punished more if the pass is successful and credited less if the pass is incomplete.
- Over the last couple seasons, SIS has added several detailed route types, including a variety of screens (e.g. bubble, tunnel) which are quite similar to each other. In calculating how likely a throw is to be completed and therefore how valuable a completion or incompletion is, routes are now grouped into about a dozen categories, with screens being bundled as their own group.
Whose Evaluations Changed the Most?
Any of the new numbers can be found on the SIS DataHub. Let’s take a look at some players who were notable movers due to our adjustments.
The Unanimous MVP is a Little More Unanimous
Lamar Jackson set the league aflame last year, winning the MVP award unanimously. Total Points disagreed with the assessment, as his rushing value wasn’t enough to offset his merely above average passing value.
The funny thing was, if you looked at EPA on run plays (designed or scrambles), Jackson’s runs were nearly three times as valuable as any other rusher, while Total Points didn’t even have him as the most valuable rusher in the league.
The new update gives him more credit for his results, particularly on short yardage, and now he’s comfortably the most valuable rusher in terms of Total Points.
2019 Rushing Points Earned Leaders
| Previous | Current | |
| Lamar Jackson | 28 | 46 |
| Ezekiel Elliott | 32 | 31 |
| Nick Chubb | 32 | 28 |
| Chris Carson | 25 | 26 |
| Derrick Henry | 22 | 26 |
That surge in rushing value puts Jackson a bit ahead of Aaron Rodgers, the previous leader in terms of Total Points (139 vs. 133). And considering he didn’t play in Week 17, the gap in performance is a bit larger than that 6 point difference suggests.
Meanwhile, in 2020…
The changes in terms of rusher/blocker division of credit have an impact on big plays as well. The biggest gainers in terms of Rushing Points Earned line up quite well with the players who have had long runs where they were untouched into the open field. To illustrate, here are the players who have gained the most yards before contact beyond the first fifteen this season, and how their Rushing Points Earned change with this update.
Most Yards Gained After the First 15 Yards Before Contact, 2020 (through Week 15)
| YBC Beyond First 15 | Rushing Points Earned Change | |
| Daniel Jones | 130 | +7 |
| Miles Sanders | 101 | +12 |
| Raheem Mostert | 94 | -7 |
| Lamar Jackson | 84 | +15 |
| Russell Wilson | 70 | -3 |
| Kenyan Drake | 67 | +9 |
| Kyler Murray | 62 | +19 |
Moving Defensive Backs Forward
Total Points used to lean its defensive back evaluation slightly in favor of those who made impact tackles in the running game, primarily because other defensive backs were being suppressed for their tackles (or lack thereof).
The new system no longer debits DBs for making a tackle downfield (after all, it’s better to make a tackle than to not make one). As a result, the elite pass defenders bubble to the top in the updated DB rankings.
2020 Defensive Back Total Points Saved Leaders (through Week 15)
| Previous | Updated | Change | |
| Tre’Davious White | 42 | 57 | +15 |
| Xavien Howard | 47 | 55 | +8 |
| Malcolm Butler | 35 | 53 | +18 |
| Carlton Davis | 41 | 50 | +9 |
| Kyle Fuller | 42 | 50 | +8 |
| Jaire Alexander | 30 | 48 | +18 |
What to Expect Next
These updates started as an offseason project to enhance how we evaluated run blocking, and (as projects tend to do) extended from there in a few different directions.
What kind of things can we expect from Total Points heading into the 2021 season?
- Using timing data and drop types to better divide credit between the offensive line and quarterback (and defensive line and defensive backs)
- Enhanced evaluation of quarterback accuracy (i.e. using overthrown/underthrown as well as catchable/uncatchable)
- Using the depth of broken or missed tackles to better measure their value