Sports Info Solutions
Category: John Dewan’s Stat of the Week
-
-
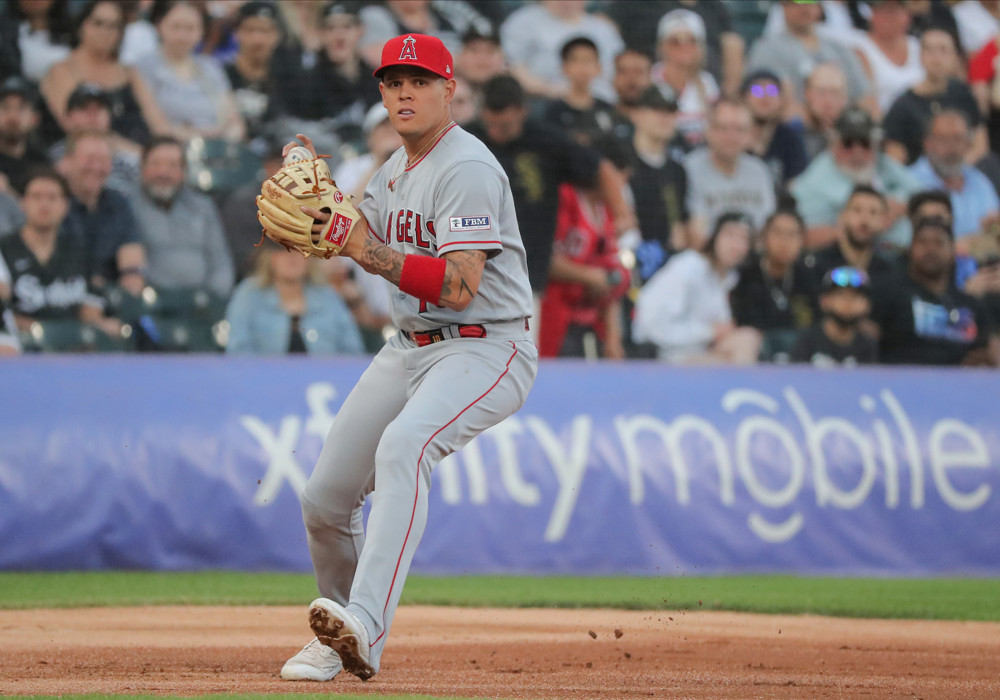
Stat of the Week: Gio Urshela Is A More Meaningful Signing Than You Think
By
The Tigers filled a big potential hole at third base.
-

Stat of the Week: 2023’s Overperforming Pitchers
By
Matt Manning and Tyler Holton head the list of pitchers with the biggest difference between their expected OPS and actual OPS.
-
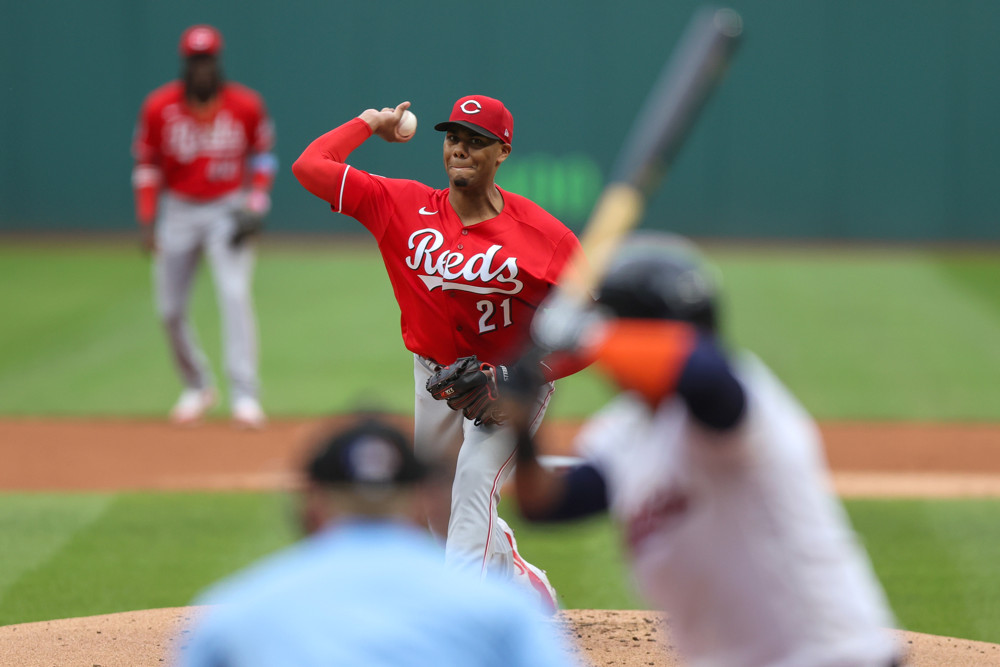
Stat of the Week: Hunter Greene Deserved Better in 2023
By
A look at Greene and other pitchers whose expected stats didn’t match up with their actual stats.
-
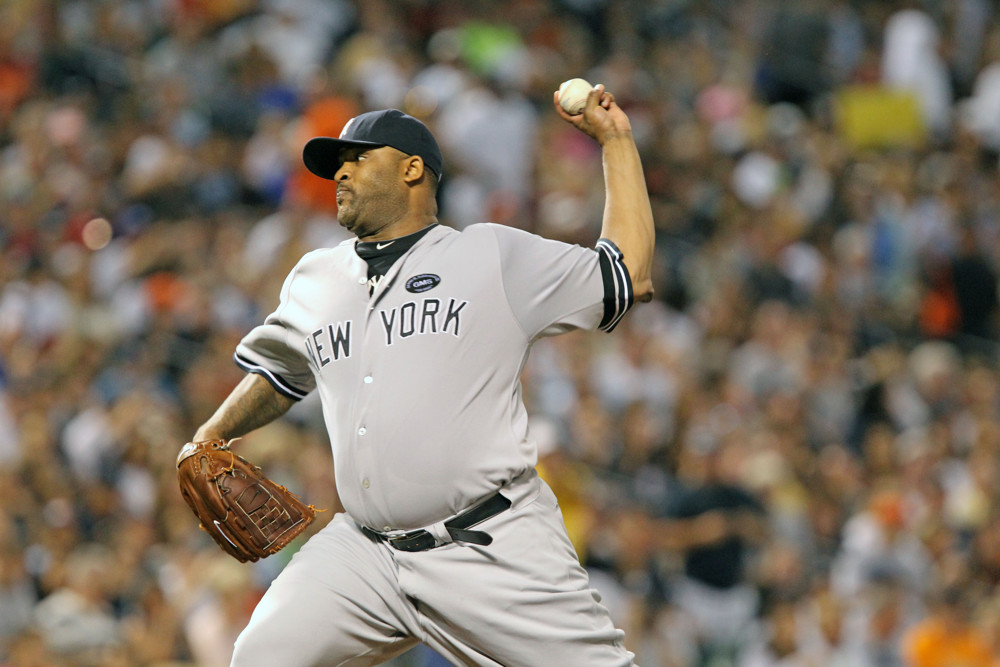
Stat of the Week: CC Sabathia and the Hall of Fame
By
When considering CC Sabathia, don’t just think about how he ranked within his time (pretty well) but also consider what’s happened to the starting pitcher in MLB
-
Stat of the Week: 2023’s Leading Underachiever
By
Which hitters should have fared much better than they actually did?
-
Stat of the Week: 2023 Hall of Fame Ballot
By
Which players are the most deserving according to Bill James’ Hall of Fame Value system?
-
Stat of the Week: 2023 MLB Year-End Awards
By
Who were the best pitch framers, hard hitters, contact minimzers, and more
-
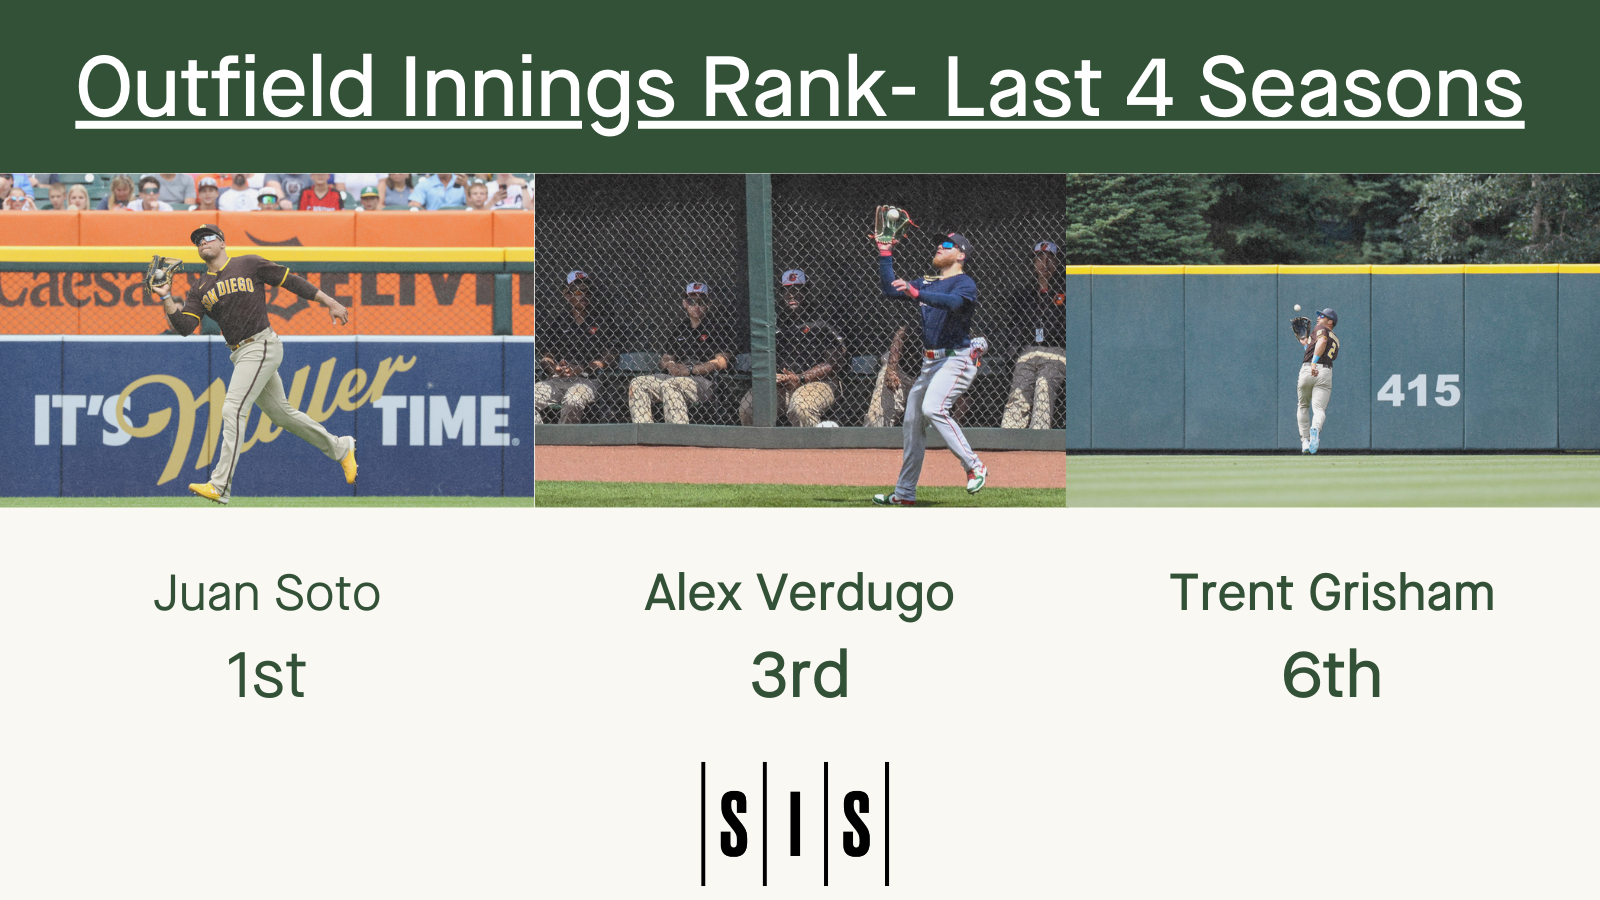
Stat of the Week: The Availability Of The Yankees Outfield Additions
By
We use the term innings-eaters on pitchers. Today we use it on outfielders too.
-
Stat of the Week: MLB’s Most Improved Defenders
By
Between social media and our website we lauded the Blue Jays outfield frequently in 2023 because they were so good defensively. But there was another big reason besides the outfield as to why the team led the majors in Defensive Runs Saved this past season. The Blue Jays had MLB’s most improved defensive player by…