Photo: Steven King/Icon Sportswire
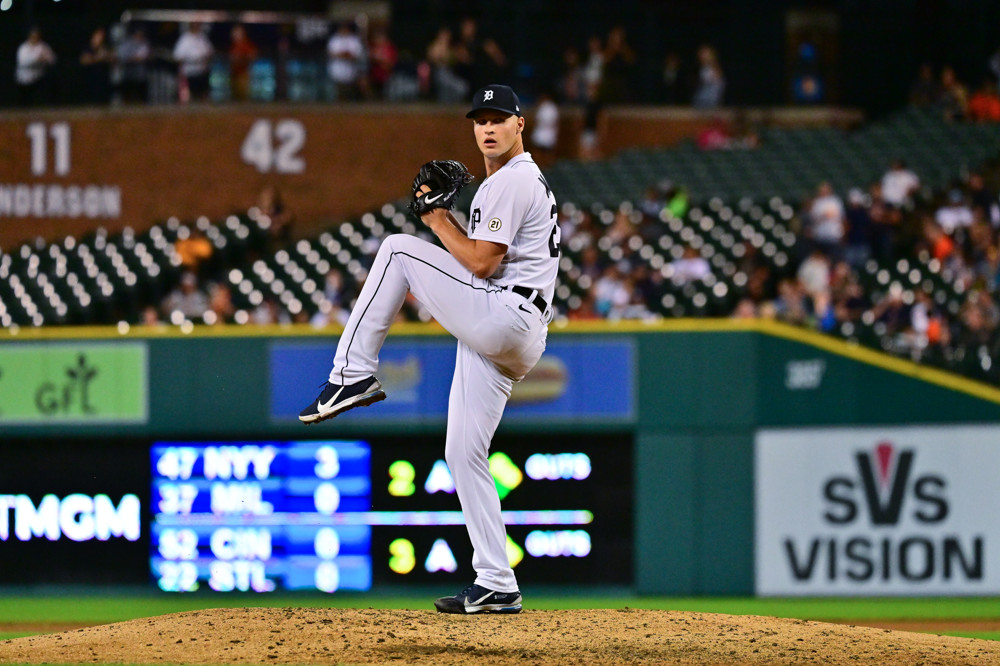
Tigers pitchers Matt Manning and Tyler Holton were each pretty good in their own ways in 2023.
Manning pitched to a 3.58 ERA in about a half-season’s worth of work as a starter. Holton got some of the best results of any reliever in MLB, with a 2.11 ERA in 85 1/3 innings, almost entirely out of the bullpen.
The two of them had something in common. They each did this with strikeout rates that were a bit below MLB average, meaning they were relying on a combination of defense, sequencing (the order in which hits, walks, and outs came), and luck to keep their numbers down. Both pitchers outpitched their FIP by a considerable amount. Manning’s FIP was 4.81. Holton’s was 3.56.
Additionally, Manning and Holton were the pitchers whose expected OPS was the most above their actual OPS among those pitchers who faced at least 300 batters in 2023.
This is our 4th and final Stat of the Week in a series looking at overperforming and underperforming pitchers and hitters from 2023.
A brief point of explanation:
Sports Info Solutions tracks its own version of a player’s expected stats (like what you can find on Baseball Savant). Rather than basing a player’s hit probability (and subsequently single, double, triple, and home run probability) on a batted ball’s exit velocity and launch angle, SIS’ version estimates probabilities based on where balls are hit, how hard they are hit, and how long they spend in the air.
This allows us to compare a player’s actual stats to his expected stats to see if they fared better or worse than perhaps they could have.
Here’s the list of pitchers with the greatest differential between their expected OPS and their actual OPS. Think of them as a group whose actual 2023 numbers could have been worse under different circumstances.
Greatest Differential – Expected Opponents’ OPS vs Opponents’ OPS
2023 Season, Minimum 300 Batters Faced
| Pitcher | Expected Opp OPS | Opp OPS | Differential |
| Matt Manning | .825 | .649 | .176 |
| Tyler Holton | .639 | .536 | .103 |
| Tony Gonsolin | .822 | .722 | .100 |
| Ty Blach | 1.005 | .918 | .087 |
| Corbin Burnes | .684 | .598 | .086 |
| José Berrios | .776 | .696 | .080 |
| Reese Olson | .729 | .649 | .080 |
| Shohei Ohtani | .697 | .618 | .079 |
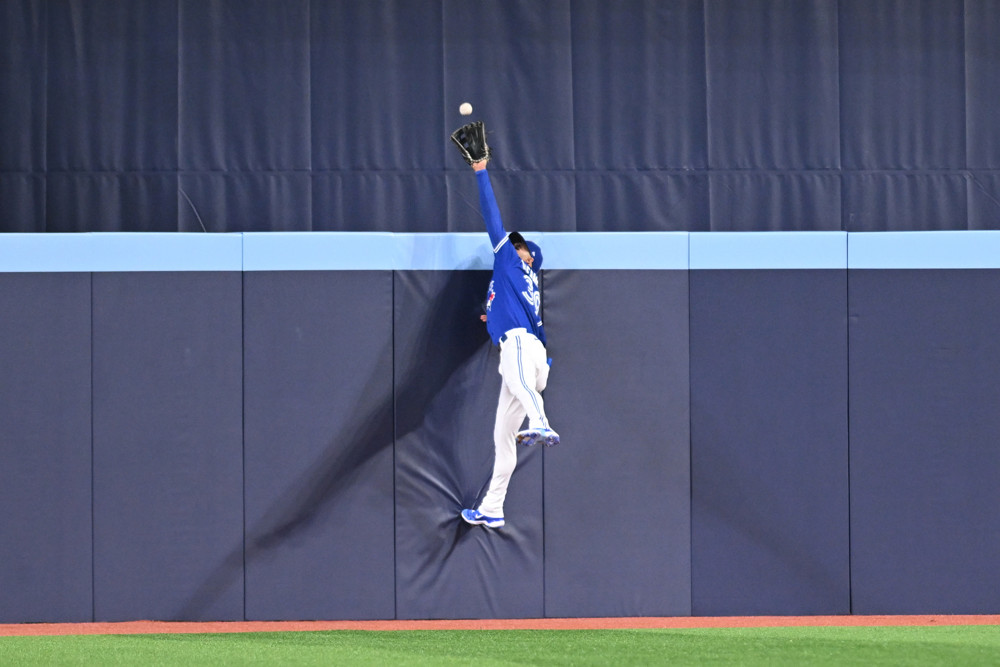
Manning had a Top-20 fly ball rate last season (47%) and the Tigers caught 76% of all balls hit in the air against him, a rate that matched Justin Verlander as 5th-highest in MLB (minimum 100 balls hit in the air).
Manning could thank the walls in Comerica Park being lowered prior to the season for this homer-robbing catch (click here to see it) and he had some good defense played behind him (this was a pretty good catch), but perhaps not overly so. The Tigers’ defense had 3 Runs Saved on batted balls behind Manning, leading us to surmise that perhaps it was factors other than fielding skill that kept Manning’s actual numbers so low.
Holton is not a fly ball pitcher to the level that Manning is. He got 10 Runs Saved worth of support on batted balls, a total that ranked in the Top 20 among pitchers despite his not even having pitched 100 innings.
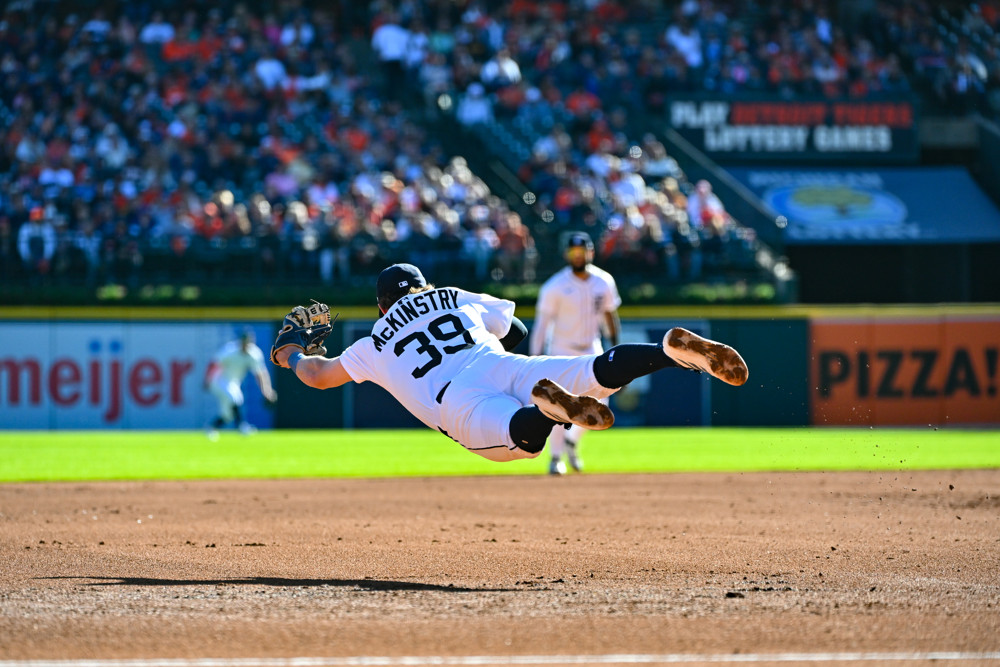
The Tigers turned 84% of grounders and bunts into outs with Holton pitching, the 3rd-highest rate among pitchers who got at least 100 grounders ands bunts last season, and 11 percentage points better than MLB average.
It’s not hard to find examples of the Tigers infield performing very well behind Holton (click here, here, here, and here for examples). And for good measure, the outfield was good behind him too. Here’s a home run saving catch by Riley Greene with Holton pitching.
Manning and Holton were just above the batters faced qualifier we set. If we look a little further down the list of pitchers with the biggest difference between expected and actual OPS, you’ll notice some notable pitchers with higher innings totals.
The most prominent of those is Corbin Burnes, who was recently traded by the Brewers to the Orioles. In Burnes’ case, defense likely played a significant role in the difference between his expected numbers and actual numbers. The Brewers defense saved 17 runs behind him on batted balls last season, the 2nd-highest total in MLB. José Berrios, who is also on our expected vs. actual leaderboard, got the most defensive support, 19 Runs Saved.
Regarding Burnes, the Brewers were the 2nd-best defensive team by Runs Saved in 2023. The Orioles weren’t that far behind, ranking 8th in that stat and they return most of the team that put those numbers up (with No. 1 prospect Jackson Holliday probably in the mix).
Our usual disclaimer: Results in 2023 don’t necessarily mean that those results will repeat themselves in 2024. But perhaps our data will reset your expectations for some of these pitchers heading into the coming season.