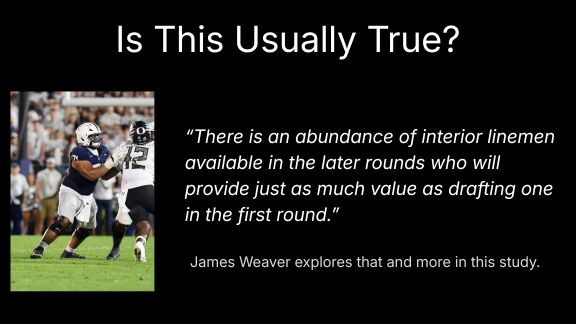
We have all heard how drafting a running back in the first round is a low-value proposition or how there is an abundance of interior linemen available in the later rounds who will provide just as much value as drafting one in the first round. This is especially true for the upcoming 2026 NFL Draft, where the narrative that has been swirling about is how the best prospects in this class play positions that are the least valued in the draft (RB Jeremiyah Love, S Caleb Downs, G Vega Ioane).
How accurate are these statements? Is there a way to crunch the numbers and compare positional value between the first and later rounds?
Why, of course there is!
The goal of this study is to see the percent change in value at each position between the first and later rounds of the draft using both playing time and production factors. Specifically, the data analyzed spans the first four seasons in the NFL for a given player (the duration of their rookie contract) back to 2016. Those factors are:
- Snaps
- Percentage of players who were retained after their rookie contract
- Total Points Per 60 Snaps
By looking at both sets of factors, we can compare the playing time tendencies for a position with the per-play production to see how well they align.
Primary Takeaways
- As you would expect, there is a massive difference in production between Round 1 QBs and QBs taken in any other round
- Running Backs in Round 1 are more distinguishable from those taken in later rounds compared to other positions
- Left and Right Guards generally have the lowest drop-off in production between Round 1 and other rounds
- There is a bigger emphasis on prioritizing the left side of the line of scrimmage given the differences in rank between the left side and right side considering snap counts and retention
Playing Time
Let’s look at the average number of snaps a player played in their first four seasons to see how distinct the playing time delta changes across positions.
Average snaps per player season, by position
| Pos | Round 1 | Others | % Change |
| QB | 679 | 118 | -83% |
| LT | 744 | 182 | -75% |
| LB | 638 | 218 | -66% |
| RB | 542 | 185 | -66% |
| LG | 709 | 290 | -59% |
| WR | 613 | 262 | -57% |
| TE | 611 | 285 | -53% |
| S | 776 | 380 | -51% |
| IDL | 510 | 250 | -51% |
| Edge | 514 | 257 | -50% |
| CB | 591 | 298 | -50% |
| RT | 885 | 460 | -48% |
| C | 717 | 411 | -43% |
| RG | 696 | 543 | -22% |
| SCB | 586 | 469 | -20% |
>>IDL = interior defensive line; SCB = slot cornerback
The biggest drop happens at the quarterback position by a whopping 83%, followed by left tackle at 75%. This is a big difference from the right tackle position, which comes in 4th from the bottom at 48%. What might come as a surprise is that running back cracks the top 5 at 66%. The loyalty to a feature back may come into play here, as later round running backs filter through a rotation.
Retention
Next, we take a look at the percent change in players who were still on the team that drafted them after their fourth year.
Average retention after 4 years, by position
| Pos | Round 1 | Others | % Change |
| LG | 80% | 12% | -85% |
| IDL | 80% | 12% | -85% |
| LT | 79% | 18% | -77% |
| QB | 57% | 13% | -77% |
| RB | 60% | 17% | -72% |
| CB | 37% | 11% | -70% |
| WR | 45% | 17% | -62% |
| C | 67% | 26% | -61% |
| RT | 83% | 38% | -55% |
| TE | 57% | 27% | -52% |
| Edge | 44% | 23% | -48% |
| LB | 27% | 17% | -35% |
| RG | 40% | 27% | -32% |
| S | 38% | 26% | -31% |
Three out of the top four drops in retention between the first round and later rounds come in the trenches. Left guards, interior defensive linemen, and left tackles are all north of a 75% percent drop in retention rates the later one gets in the draft. Quarterbacks are also in the top 4, dropping at 77%. Both quarterbacks and left tackles are in the top of snap count percent changes as well, showing that these positions when taken in the first round are more common to be on the field than others and teams are deciding to keep them on the roster when investing a high pick on them.
With the left side of the offensive line seeming to have the most bankable talent at the top of the draft, the right side can be built on a stricter budget. The right guard and right tackle positions represent two of the lowest percent change drops between the first and later rounds. Coming on the lower end of the snap count difference too, there seems to be more value for the open side of the quarterback’s protection due to later picks not being much worse than the first round selections.
Production
Average Total Points per 60 snaps, by position
| Pos | Round 1 | Others | % Change |
| QB | 3.7 | -0.5 | -113% |
| RB | 2.1 | 0.3 | -86% |
| WR | 1.3 | 0.5 | -60% |
| LT | 1.6 | 0.7 | -55% |
| Edge | 2.1 | 1.1 | -47% |
| IDL | 1.9 | 1.0 | -44% |
| TE | 1.7 | 1.0 | -42% |
| C | 1.7 | 1.2 | -32% |
| LB | 1.8 | 1.3 | -29% |
| CB | 1.9 | 1.3 | -29% |
| RT | 1.7 | 1.2 | -29% |
| SCB | 2.3 | 1.7 | -27% |
| S | 2.4 | 1.9 | -22% |
| LG | 1.5 | 1.2 | -21% |
| RG | 1.4 | 1.4 | -2% |
Now taking a look at the production side of things through Total Points per 60 snaps (roughly the duration of a game), it is evident at a 113%(!) drop that the quarterback position shows the biggest difference between the first and later rounds. However, the running back position finds itself near the top again with an 86% drop. Wide receivers and left tackles round out the top 4, both coming in above a 50% drop.
At the bottom, we see both guard spots with right guard at only 2%. Linebackers at only a 29% drop contrasts with the playing time advantage for first rounders.
Conclusions
Ranks by position by biggest difference between first and non-first rounds
| Pos | Snaps | Retention | Production |
| QB | 1 | 4 | 1 |
| RB | 4 | 5 | 2 |
| WR | 6 | 7 | 3 |
| TE | 7 | 10 | 7 |
| LT | 2 | 3 | 4 |
| LG | 5 | 1 | 14 |
| C | 13 | 8 | 8 |
| RG | 14 | 13 | 15 |
| RT | 12 | 9 | 11 |
| IDL | 9 | 2 | 6 |
| Edge | 10 | 11 | 5 |
| LB | 3 | 12 | 9 |
| S | 8 | 14 | 13 |
| CB | 11 | 6 | 10 |
| SCB | 15 | – | 12 |
The running back position is an interesting case study here. There is a significant drop in both their playing time as well as their production between the first and later rounds. Running backs drafted in the first round are more distinguishable from those taken in later rounds compared to what happens at other positions. Backs taken in the later rounds are more likely to fall into a rotation and not be given the chance at a lead back role, but their per-play production lags behind regardless.
The difference between the left and right tackles testifies to how important teams view keeping the blind side of the quarterback clean. The production drop off is there too, supporting that drafting a left tackle early provides more value when compared across positions.
Going into this draft, there is a sentiment that the guard position is deep, so waiting until the later rounds can provide just as much value. This generally bodes to be true from a production standpoint, with both left and right guards having the lowest drop off between the first and later rounds.
Considering positional value can be important on a draft by draft basis, but there are general tendencies on how value disperses across a draft. Whether drafting for want or having a few different positions of need, looking at the marginal value is imperative when deciding how to attack a draft plan.