At SIS we collect a ton of different granular charting data points, but the data set we’ve been most excited to explore is our offensive line and pass rush detail data. We’ve charted blocking assignments, block types, pass rush moves, and stunts for every pass play since the 2023 season.
With data as granular as this, it can take some time to get enough sample to feel confident in what to trust, but now we’re really opening the floodgates.
Those of you who listen to the Off the Charts Football Podcast will by now have heard us wax rhapsodic about the fun we’ve been having digging into this data. And if you haven’t, check out each of our defensive and offensive deep dives!
For today, we’re just going to give the lay of the land for some of the particular kinds of charting we do, and provide a couple of deeper insights from each.
Pass Rush Moves
We chart up to three sequenced pass rush moves for every rusher on the play. There isn’t a super-high rate of multiple-move use and they often come on longer-developing plays that have funky circumstances, so for this discussion we will focus on first-move use.
Here is a breakdown of the usage of each relatively common move by the alignment of the defender. Bull rush is the most common move, and you can think of it as the default or replacement-level move, as it’s also fairly consistently the worst-performing one.
Pass Rush Move Rates by Defender Alignment
| Interior | Edge | |
| Bull Rush | 53% | 27% |
| No Move / Unblocked | 9% | 13% |
| Swipe | 10% | 8% |
| Stunt-Loop | 6% | 6% |
| Rip | 6% | 6% |
| Speed-to-Power | 0% | 12% |
| Long Arm | 3% | 5% |
| Swim | 5% | 2% |
| Inside Cross | 2% | 5% |
| Speed | 0% | 6% |
| Cross Chop | 2% | 4% |
| Stunt-Crash | 2% | 1% |
| Spin | 1% | 2% |
| Push-Pull | 2% | 1% |
In general there is a more diverse move repertoire for edge rushers, particularly leaning into the use of speed over power. There is also a little more hand use and outside-to-inside maneuvering (long arm, inside cross, cross chop).
Speaking of a diverse repertoire, one of the things we were most excited to explore with this data is the idea of predictability in pass rush plan. Which players mix it up the most, and are they more successful?
At least on the extremes, that appears to be true. If we compute the variability in rush moves using the concept of entropy, we can see that the least predictable edge rushers are a murderer’s row. And on the opposite end of the spectrum, you can see that you don’t need to be diverse if you’re an animal, as is the case with Will Anderson Jr. (or Chris Jones on the DT leaderboard.)
Least Predictable Edge Rushers, 2024-25
| Player | Most common move |
| Aidan Hutchinson | 13% Bull Rush |
| Brian Burns | 18% Bull Rush |
| T.J. Watt | 19% Bull Rush |
| Myles Garrett | 17% Bull Rush |
| K’Lavon Chaisson | 14% Bull Rush |
Most Predictable Edge Rushers, 2024-25
| Player | Most common move |
| Byron Young | 27% Bull Rush |
| Greg Rousseau | 33% Bull Rush |
| Will Anderson Jr. | 29% Bull Rush |
| Jonathon Cooper | 24% Bull Rush |
| Yaya Diaby | 34% Bull Rush |
Block Types
We chart about a dozen different block types, although many of them are less common or involve things like run blocking on RPO plays. For the most part, there are four types of blocks on true pass sets.
Here is a quick breakdown of how common things are, since the start of the 2024 season.
Block Types by OL Position
| Center | Guard | Tackle | |
| Vertical | 56% | 46% | 66% |
| Quick | 13% | 24% | 7% |
| Slide | 20% | 18% | 15% |
| Wide | <1% | 1% | 6% |
The biggest discrepancies between positions are that guards are much more likely to use quick sets and tackles are much more likely to try to get back or wide quickly to avoid getting beaten by edge rushers lined up at a 9 technique or wider. There are a bunch more block types that we track, but they’re more sparing.
Tying some of the different pieces of the puzzle together, it’s interesting to look at the rates of different pass rush moves against certain block types. Here’s one example:
While bull rushes are overwhelmingly the most common rush move overall, rushers dip into their bag of tricks against vertical or wide sets. Bull rush is used more than half the time against quick or slide blocks, but closer to one-third of the time against vertical or wide sets. They generally opt for speed (-to-power) rushes, which occur at more than double the rate they do against the other block types. Cross chops are also more common than usual as a way to cut back inside against a tackle who overextends.
Blocking Help
We chart blocking assignments in such a way that we can judge four different levels of ‘blocked’: a true double team, a block with help (like a hand or a brief shove), being 1-on-1 or “on an island”, and not being blocked at all.
Here’s how often each happens against different types of defenders.
Help Types by Defender Alignment
| Interior | Edge | LB | |
| Double Team | 1% | <1% | <1% |
| Help | 34% | 14% | 17% |
| Island | 62% | 76% | 55% |
| Unblocked | 4% | 10% | 28% |
Even for the most common position, true double teams aren’t that common, while getting some amount of help is quite common against interior rushers. Unblocked rushers (particularly edge rushers) are probably more common than you thought; it’s worth keeping in mind that we’re not pruning the data set to filter out screens and RPOs that might willfully leave players unblocked.
On the offensive side: for those plays with help, how does the type of helper affect things?
To standardize things, we’re looking at just plays helping an offensive tackle, where there’s just as much opportunity for help to come from an interior lineman, running back, or tight end / slot receiver.
The performance measure is our Pressure Rate +/-, which is a measure of actual pressure rate compared to an expectation determined by the player’s alignment and the game situation. This allows us to adjust for heavy-pass situations where help is more likely to come.
| Position | % of T snaps | Pres% +/- |
| OL | 12% | -4% |
| TE/Slot | 3% | -5% |
| B | 1% | -2% |
| Island | 84% | -1% |
The most interesting finding here is that help from a player who starts at the line of scrimmage is more impactful at reducing the pressure rate than a back coming in. There also might be a bit of a size/length effect given the difference in body type between tight ends and backs.
You might find it odd that the “Island” category has a lower pressure rate than average, but it’s worth noting that we’re clipping off the cases where an edge rusher or linebacker is coming in unblocked, which would have a very high pressure plus-minus.
Pass Rush Stunts
We track the use of more complex pass rush games, identifying up to three players involved per side of the defense and the order in which they rushed. We then annotate them using the simple N=nose, T=tackle, E=end, B=linebacker. For example, a TE stunt involves a tackle crashing first and an end looping around to rush up the middle.
Here is a breakdown of the per-play rates of each of these stunts. It’s listed as a percentage, but it really is “stunts per play”, because they could occur on either side of the line.
Stunt Rates (on either side)
| Stunt | Per Play |
| TE | 13% |
| 3-Man | 6% |
| ET | 6% |
| TT | 6% |
| TB | 2% |
| EB | 2% |
| NT | 2% |
| BE | 2% |
| EE | 2% |
| TN | 1% |
| BB | 1% |
Defensive playcallers have pretty consistent profiles when it comes to their use of these games.
For example, Brian Flores (MIN) leads in the use of three different kinds of linebacker-based stunts (BB, BE, NB), but not the one that’s the most common generally (TB).
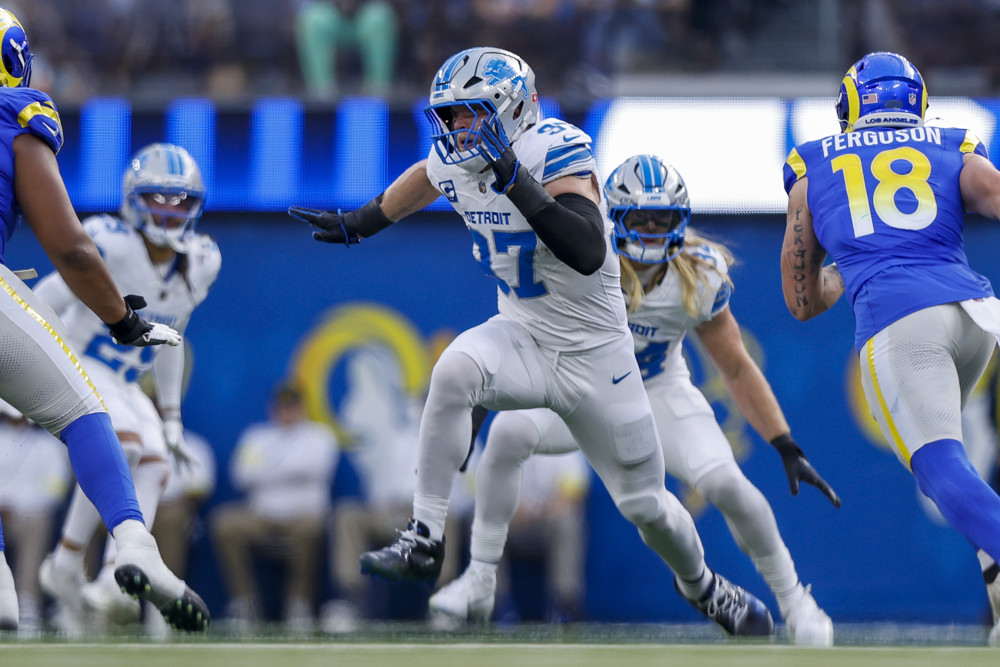
While Flores plays around with his lighter defenders, the Rams’ Chris Shula leans into the heavy guys. He easily leads in TE stunt use, also leads in TT use, and is top 5 in ET use. He also is the most likely defensive playcaller to call two games on one play.
Shula does not rank highly in the use of three-man games. The leader there is the Bears’ Dennis Allen, who’s a full percentage point above anyone else (and in this context that’s a meaningful gap).
We’re really excited to delve more into this data; our conversations around it have resulted in as many new questions as we have insights. What would you dig into next? Let us know on social media on Twitter and Bluesky