Time and time again we hear descriptions about how a pass rusher was able to get to the quarterback on a specific play. “Beat him to the edge” or “walked right through him” are common phrases used by broadcasters while dissecting the play in slow motion. But what plan did the pass rusher have in order to successfully beat his opposition?
With our pass rush and offensive line detail data, we wanted to take a deeper look into the specific pass rush moves and answer questions as to how players may group together in their plans. Which players use more power moves like the bull rush? Which ones use their hands more? Are there groups of players that fall into the same category and plan the same way?
Methodology
Our pass rush detail data goes back through the 2023 season. Each pass rusher is tagged with their first three moves in a sequence (if applicable), a stunt move type, and the side and technique they lined up in. We chart 14 unique pass rush moves.
The k-means clustering technique was used in order to cluster players together based on engineered features within the pass rushing data structure. Looking at a player’s career back through 2023, the features calculated include the percentage of time a player used a unique move, lined up in a certain technique, utilized a sequence (move than one pass rush move on a play), and utilized a stunt, as well as their average height, weight, and number of unique moves used.
Using a hierarchical clustering technique, the first clustering round was built using a grouping of the pass rush moves as well as the other features listed above. The second round was built solely using the individual pass rush moves to find more unique definitions of clusters.
The players were broken up into five position categories: nose tackles, defensive tackles, defensive ends, edge rushers, and blitzers. They were categorized given the percentage of times they lined up in certain techniques. For example, if a player lined up in the 0, 1, or 2i over 50% of the time, they were categorized as a nose tackle. The clustering analysis was conducted within each position group.
Summary
- For nose tackles and defensive tackles, the main clusters are broken up into power rushers vs. non-power rushers, with some additional alignment separators too.
- There aren’t many defensive ends who spend their time aligned in the 4,5, or 7 technique on a consistent basis. The ones that do might have their preferred move, but there isn’t a large enough sample size to define real clusters from them.
- Edge rushers are broken out by stance type at the general level, but then break out more at the sub-level. There are 8 sub-clusters for the 2-point stance group that all feature a unique move. There are 2 sub-clusters for the 3-point stance group that break down the power rushers vs. players who are more balanced.
- The speed and spinners from a 2-point stance have the highest pressure rate, while strict power rushers from either stance have the lowest.
Nose Tackles
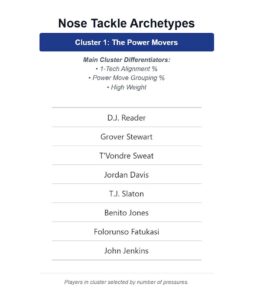
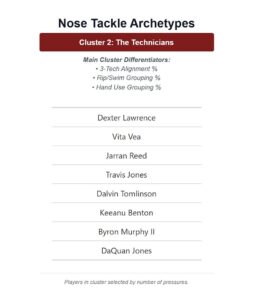
The two main nose tackle clusters broke out guys who play a true nose on a higher percentage of snaps and use power rush moves (bull rush, inside cross, etc.) and guys who are a little bit more versatile and have more creativity at the point of attack. The more versatile guys have been more successful in applying pressure, doing so 6% of the time as opposed to the other cluster’s 4.6% average.
The first cluster was then broken into 6 sub-clusters where the power moves were prominently the main factors, but the differentiation occurred by mixing in some of the other moves. The 3rd sub-cluster contains the second-most players and features moves that are balanced across the board when compared to league average.
| Move | Cluster | League | Diff |
| Bull Rush | 69.2% | 67.8% | 1.4% |
| Rip | 6.4% | 5.0% | 1.4% |
| Push-Pull | 2.2% | 1.3% | 0.9% |
| Speed-To-Power | 0.4% | 0.1% | 0.4% |
| Speed | 0.2% | 0.3% | -0.1% |
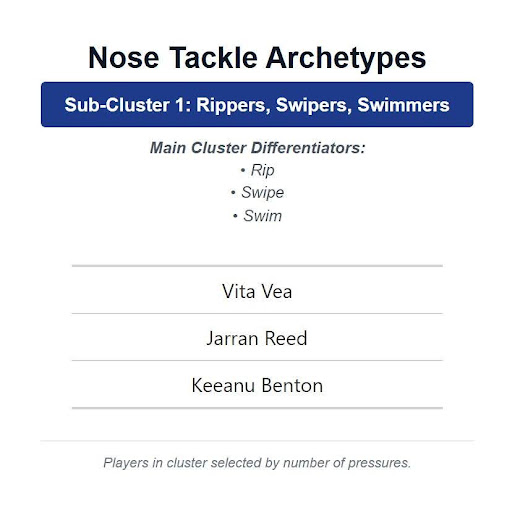
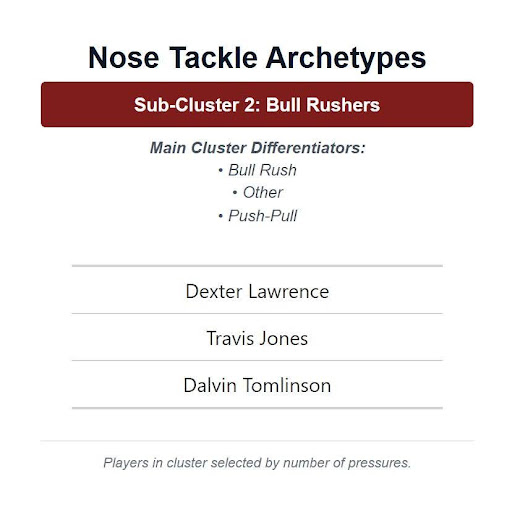
Breaking down the sub-clusters in the second main cluster is where things get interesting. Most notable being that Dexter Lawrence and Vita Vea find themselves in each of the two different sub-clusters.
Lawrence uses the bull rush 66.4% of the time compared to Vea’s 57.2%. On the flip side, the main driver between the sub-cluster differences is Vea’s 8.4% use of the swipe move, compared to only 3.6% for Lawrence. Vea likes to use his hands more while Lawrence likes to power his way to the quarterback’s lap.
Defensive Tackles
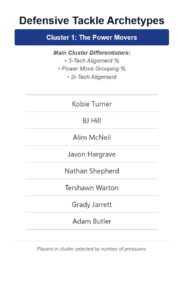
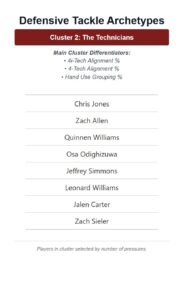
Like the nose tackles, the two main clusters for defensive tackles are separated by technique alignments and a power vs. technician dichotomy. Once again, the technician group gets pressure on the quarterback at a higher clip (8.5% vs. 6.0%).
Looking at the second cluster, there are guys who have balance across the hand use move grouping and some guys who have a distinct use case. Jeffery Simmons and Quinnen Williams, for example, are balanced when comparing their hand use moves to the cluster averages, as the four hand use moves all fall around the average mark for players in their cluster.
On the other side of that group, Chris Jones is well above average using the swipe move, utilizing it at a 19% clip. Jalen Carter also uses his swipe move 18% of the time. Cameron Heyward uses the long-arm 9%, well above the 3.5% average among DTs.
Defensive Ends
Players who primarily line up in the 4, 5, and 7-techniques are few and far between. The clustering that took place here did not lead to any solid breakouts of players and more so pointed to each player’s unique move that they like to use. Citing a sample size issue, we move onto the most interesting alignment from the analysis.
Edge Rushers
The two main clusters for edge rushers are mainly separated by alignment. Cluster 1 includes the players who find themselves aligned in a 2-point stance primarily in 3-man fronts, while the second cluster includes players who are mostly aligned with their hands in the ground in a 4-man front.
Where things get interesting with this position group is within the sub-clusters and grouping by the specific moves.
2-Point Stance Cluster
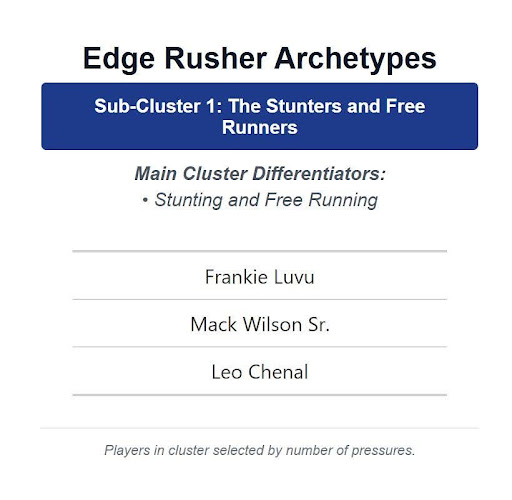
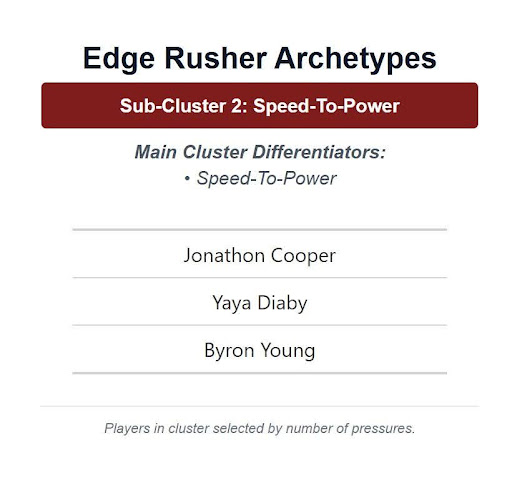
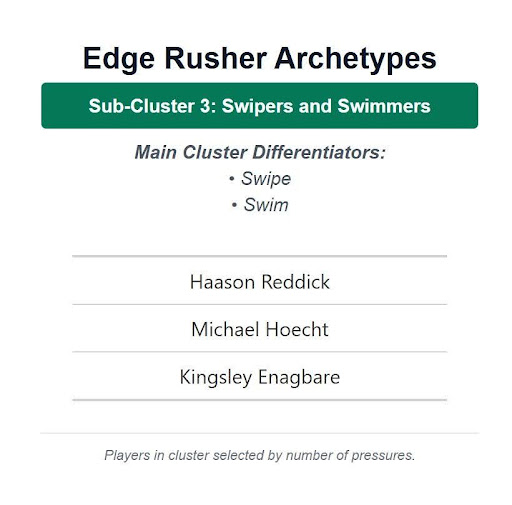
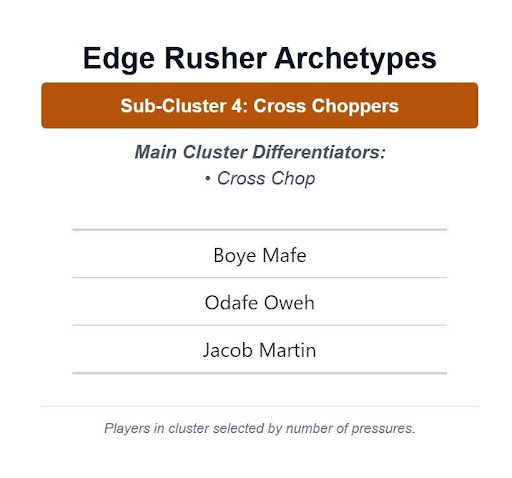

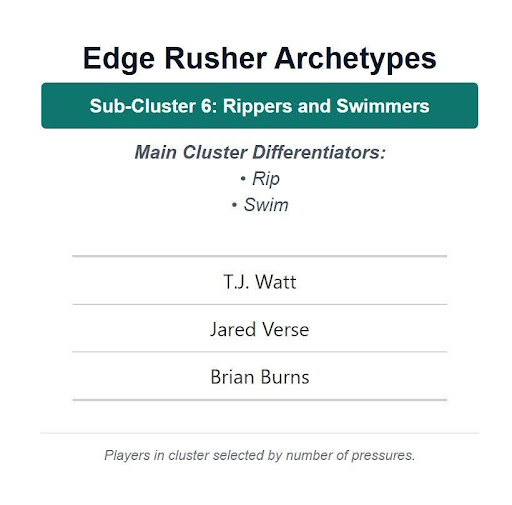
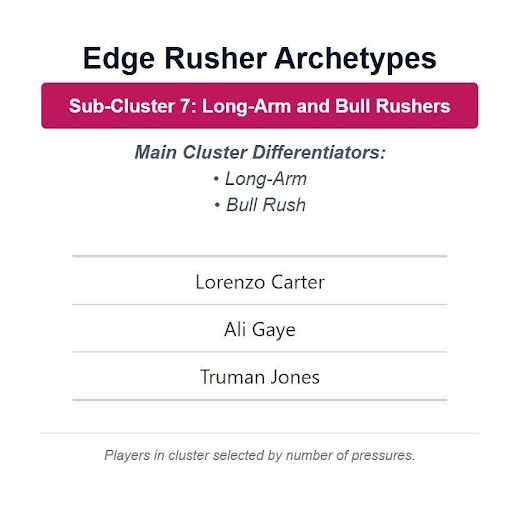
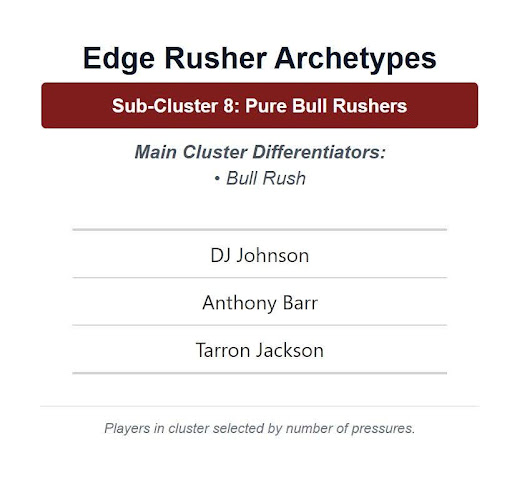
Each sub-cluster here has a distinct pass rush move profile. The 2-point stance edge rushers present the most unique sub-clustering out of all the alignments with 8, and there are no fewer than 5 players to a sub-cluster.
3-Point Stance Cluster
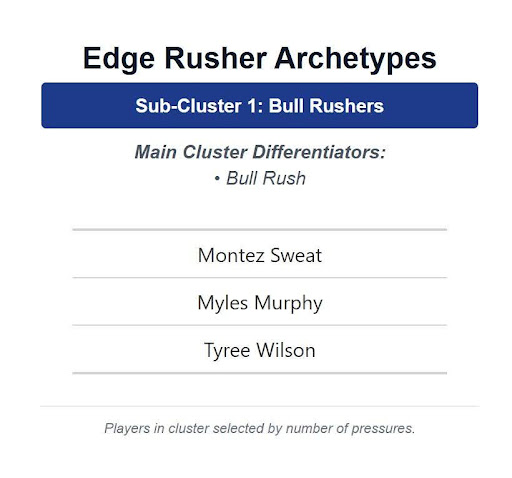
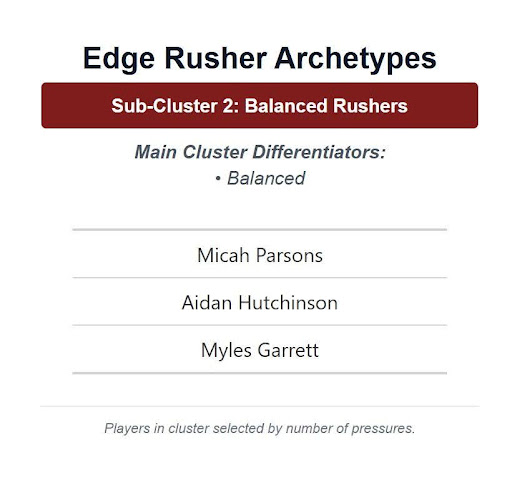
From a hand-in-the-ground perspective, there are two sub-clusters, bull rushers and balanced rushers. The bull rushing cluster utilizes this move at an 8% higher clip than the league average, while the balanced rusher’s highest deviation is a 3% greater usage of the rip move, but nothing else differing more than 1.5%.
Within the second sub-cluster is where the variation from player to player lies. Trey Hendrickson, Myles Garrett, and Maxx Crosby all use rip and swim moves roughly a quarter of the time, while Crosby uses power moves at the lowest rate of players within the 3-point stance cluster at 29.8%, the only player below 30%.
Danielle Hunter and Aidan Hutchinson are very similar in that they use speed, rip, and swim moves at very similar rates. Hutchinson also uses a speed-to-power move at a high rate for his cluster (13%). Will Anderson Jr. uses it frequently too, 22% of the time.
EDGE Pressure Rates by Cluster
| Main Cluster | Sub-Cluster | Pres% |
| 2-Point | Speed and Spinners | 14.5% |
| 2-Point | Rippers and Swimmers | 14.1% |
| 3-Point | Balanced Rushers | 14.0% |
| 2-Point | Cross Choppers | 13.1% |
| 2-Point | Speed-To-Power | 12.9% |
| 2-Point | The Stunters and Free Runners | 12.7% |
| 2-Point | Swipers and Swimmers | 12.1% |
| 3-Point | Bull Rushers | 10.6% |
| 2-Point | Long-Arm and Bull Rushers | 8.0% |
The 2-Point Stance, Pure Bull Rushers subcluster did not meet the threshold of any players with at least 200 pass snaps to be included in the average pressure rate analysis. A testament that players who only bull rush have issues getting on the field without a more diverse portfolio of moves.
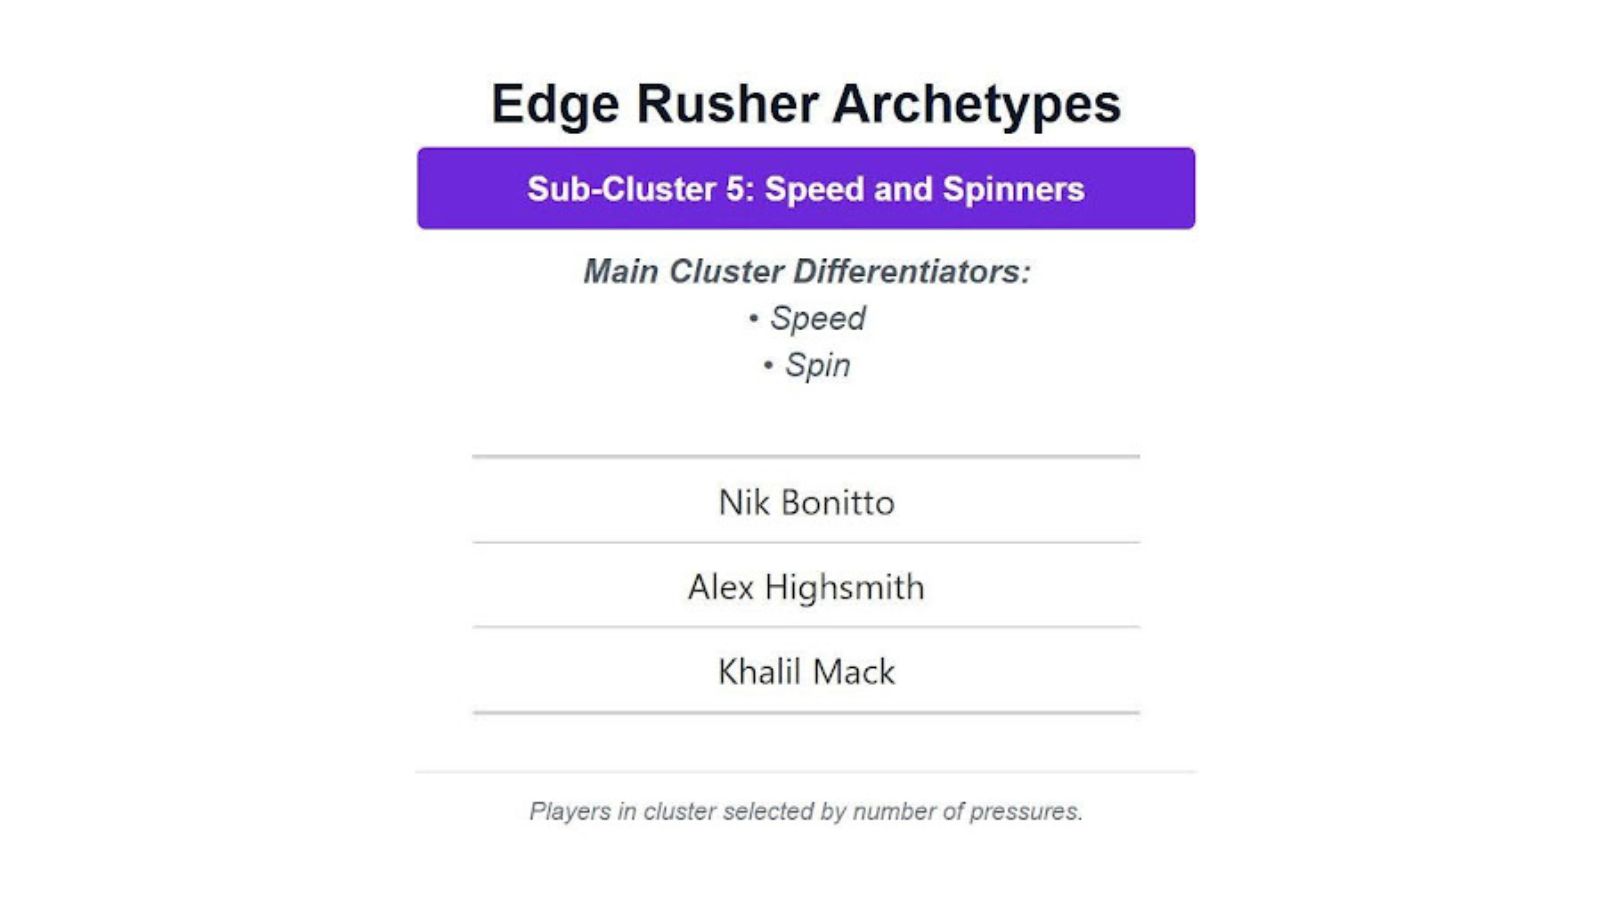
The speed and spin rushers from the 2-point stance cluster lead in average pressure rate. This cluster includes the likes of Nik Bonitto, Khalil Mack, Harold Landry III, Andrew Van Ginkel, and Nick Herbig. Bonitto has had 27.5 sacks in the last two seasons and was 7th in pressures last year with 74.
The balanced rushers from the 3-point stance include a lot of the premier names listed in the previous section, as Hutchinson, Anderson Jr., and Garrett were 3 of the top 4 in total pressures last season.
Looking at the table holistically, we see that the power clusters fall at the bottom. Since we are looking at percentages, we have to take into account that the bull rush and power moves are the most frequently used moves. However, the clusters have separated these players out as the ones that use this move even more than average, and we see that when used at an even higher rate than their peers, the results are lacking.
We are just getting started in terms of diving into this dataset. This study is just an example of how we can look into the plan and skills of each pass rusher individually, including specific matchups, and draw conclusions at a finer level of detail. What individual moves garner the most success? What sequences are players using as a full plan of attack? From one play to the next, how are these pass rushers keeping their opponents guessing? These are all questions we look forward to answering in the near future.