Sports Info Solutions
Author: Mark Simon
-
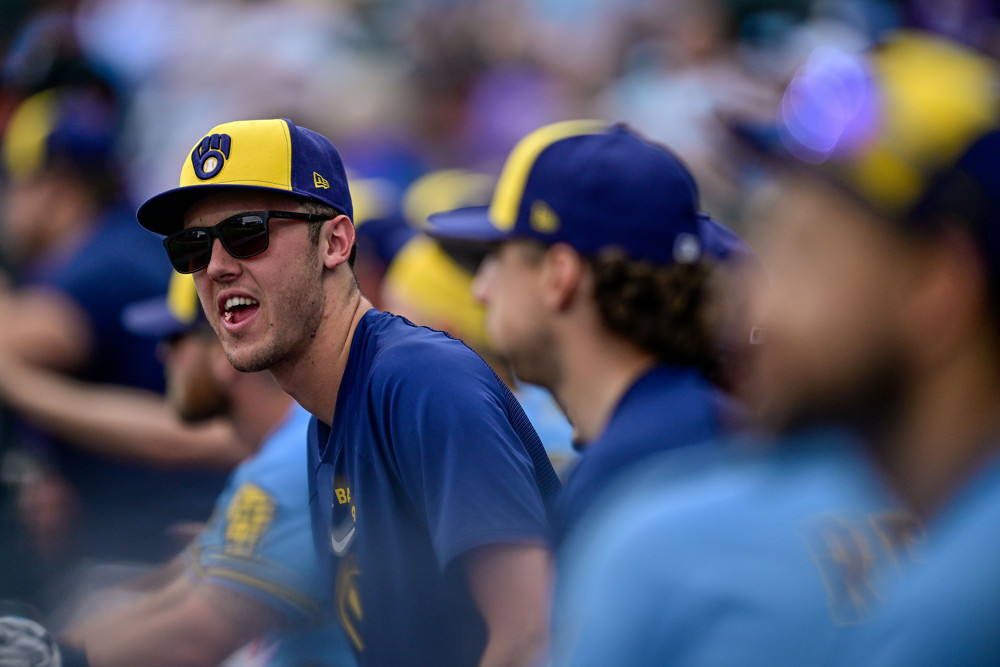
Even If You Make Contact vs Jacob Misiorowski, You’re Probably Not Doing Much
By
The Brewers defense has done well for their ace.
-
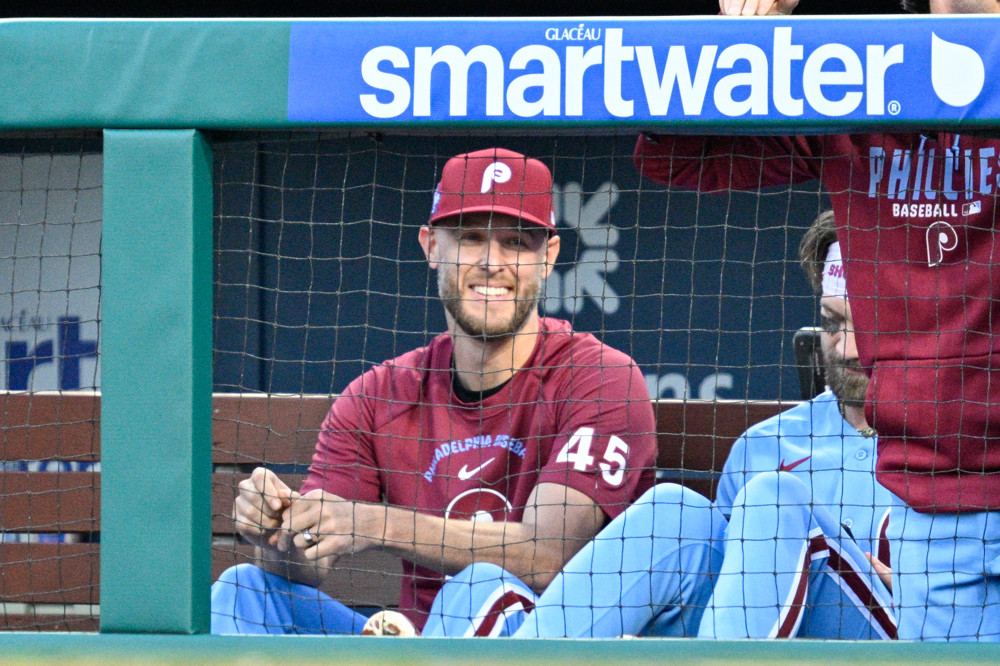
The Phillies Infield Defense Has Been At Its Best For Zack Wheeler
By
Zack Wheeler can smile in the knowledge that the Phillies defense has helped out his ERA considerably.
-
Inside Cody Bellinger’s Huge Lead In Defensive Runs Saved
By
Sprinting catches have played a significant role in Bellinger’s great numbers in left field this season.
-
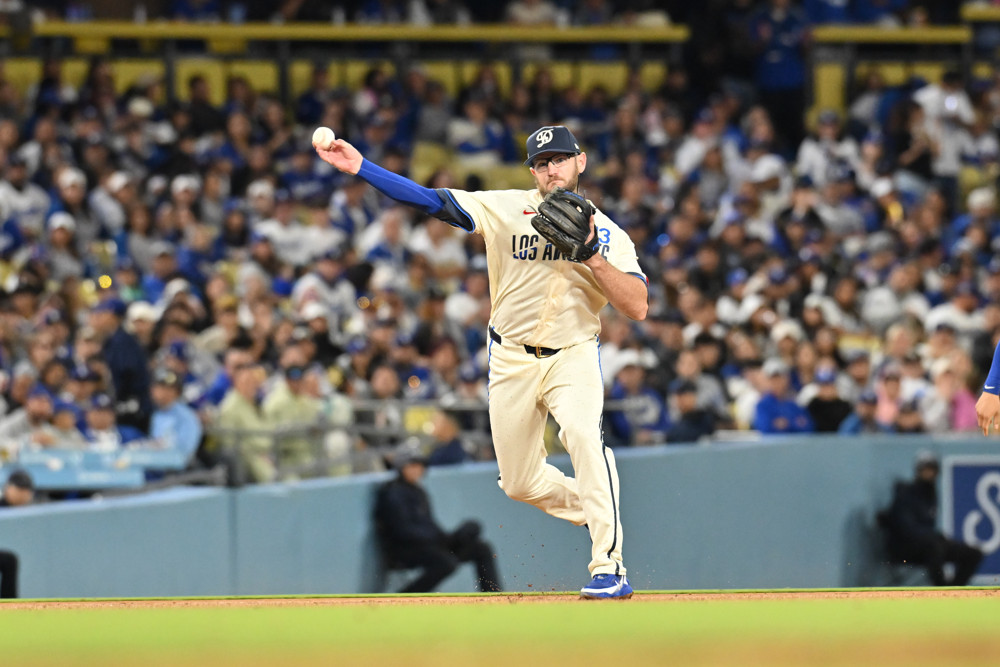
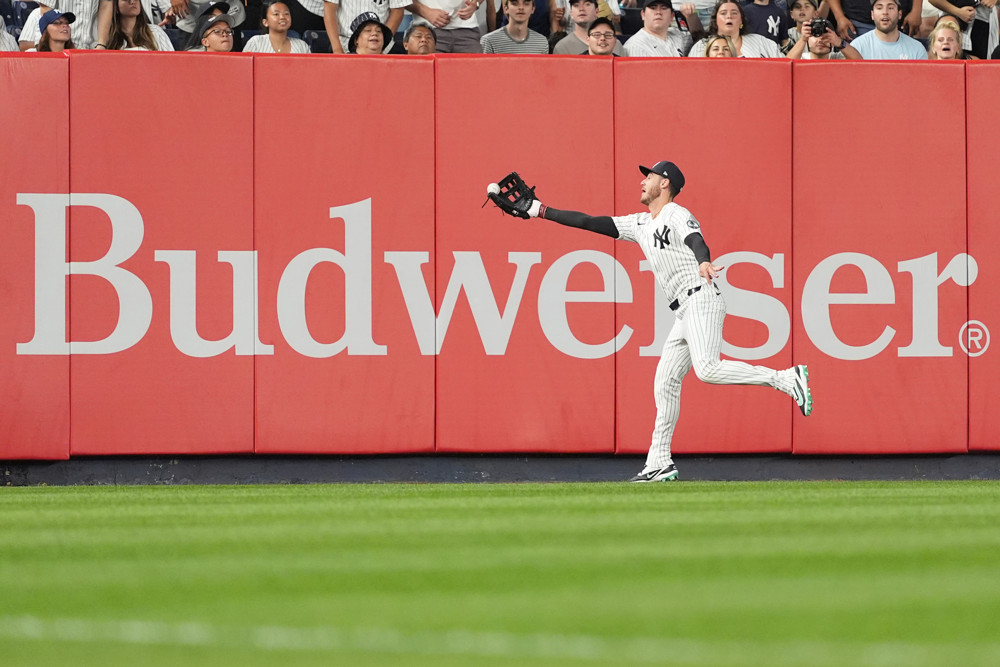
Stat of the Week: The Dodgers’ Different Defensive Excellence
By
They lead the majors in Defensive Runs Saved because of skill rather than positioning
-
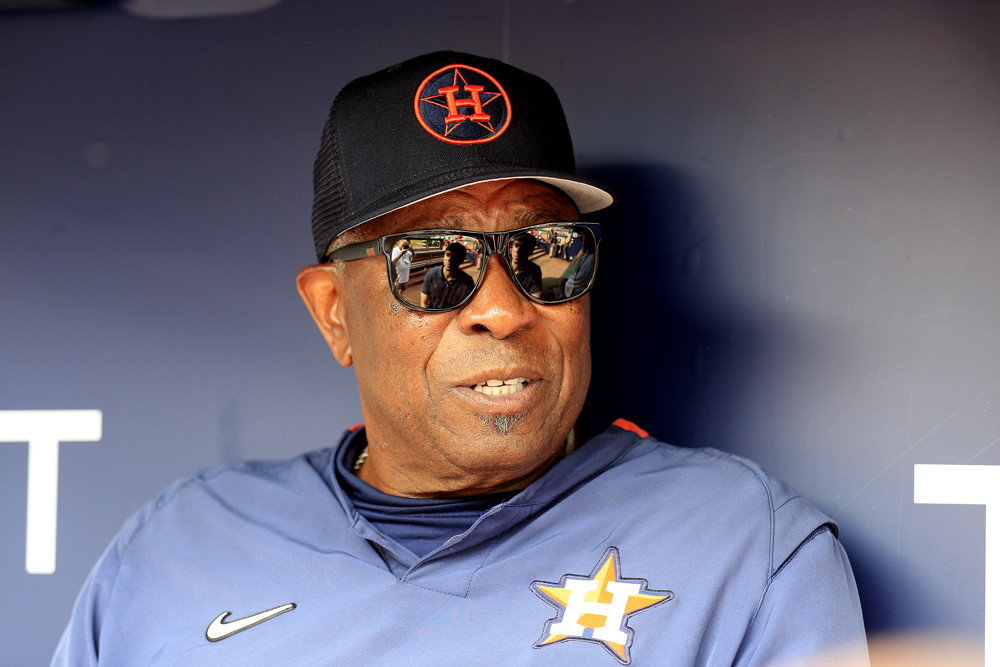
Q&A: Dusty Baker On Analytics Before There Were Analytics, His New Book
By
On Hank Aaron and defensive positioning, why Dusty started a bad hitter in the World Series, and much more
-
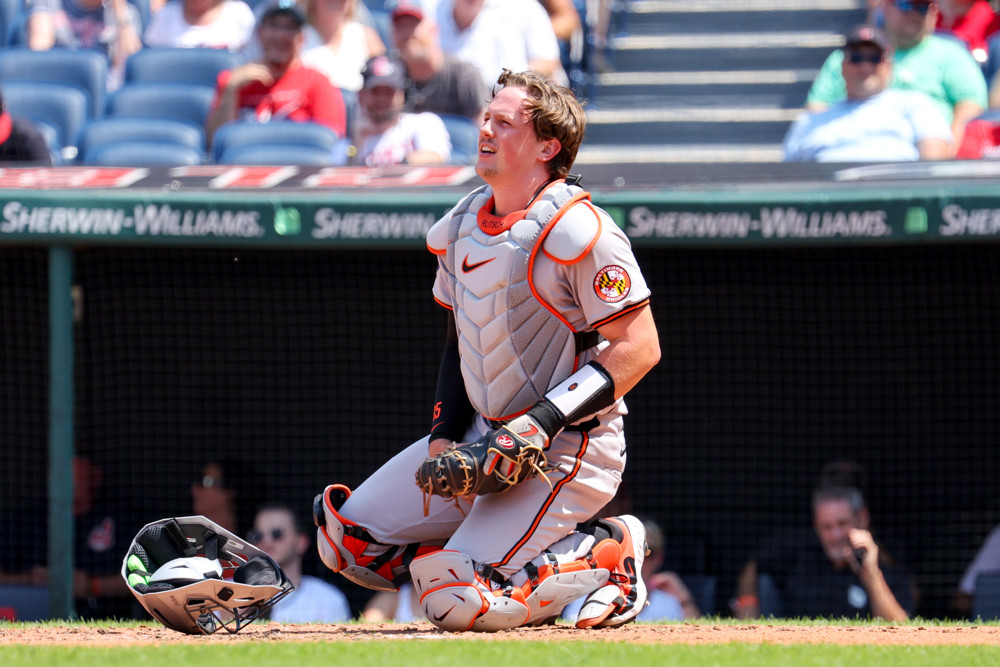
Stat of the Week: How Often Are Catchers Getting Hit With Foul Balls In Bad Spots?
By
Quantifying how catchers are getting hit by foul balls in sensitive spots since the rise of the one-knee-down stance
-
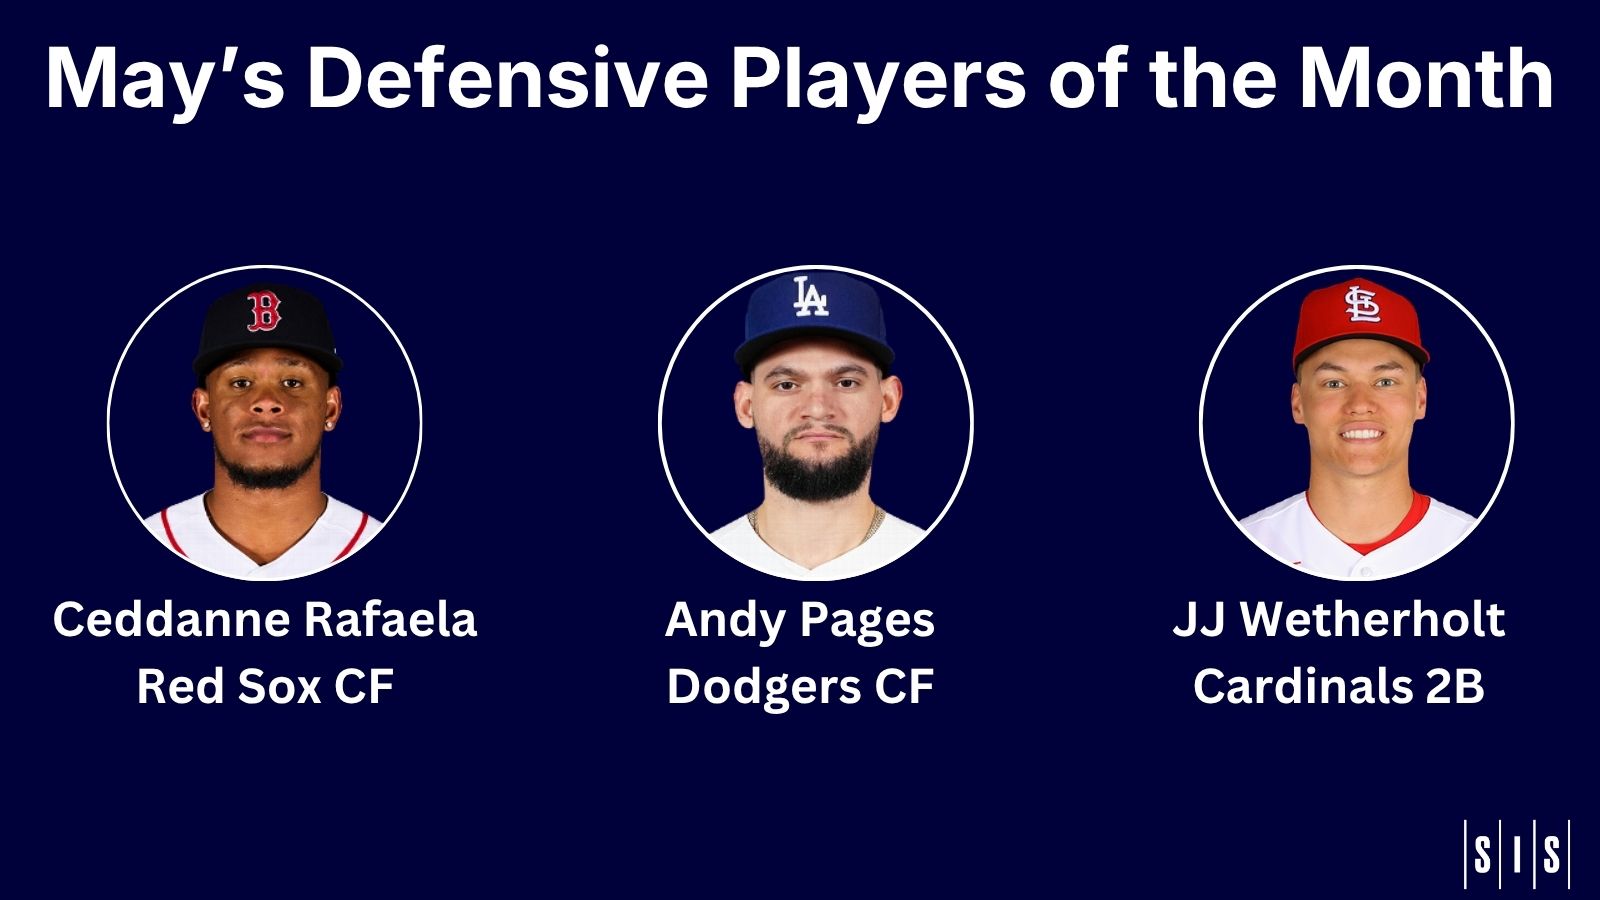
May’s Defensive Players of the Month
By
We selected three players whose defense was stellar this past month.
-
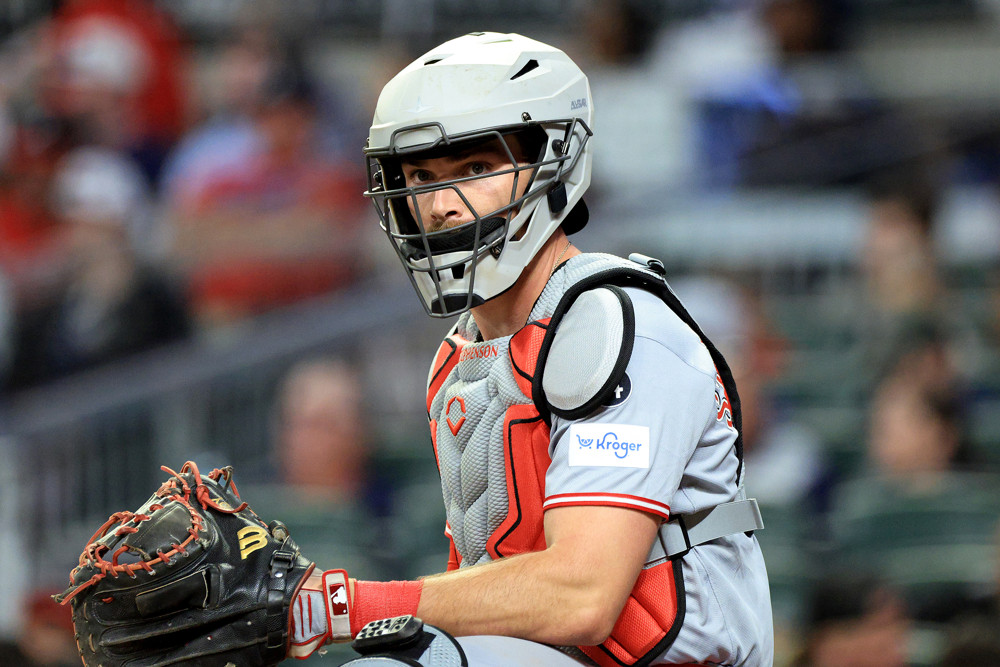
Bad Pitch Framers Lead in ABS Challenge Success
By
Tyler Stephenson is among the catchers who can overcome some of their lack of framing success with effective pitch challenging.
-
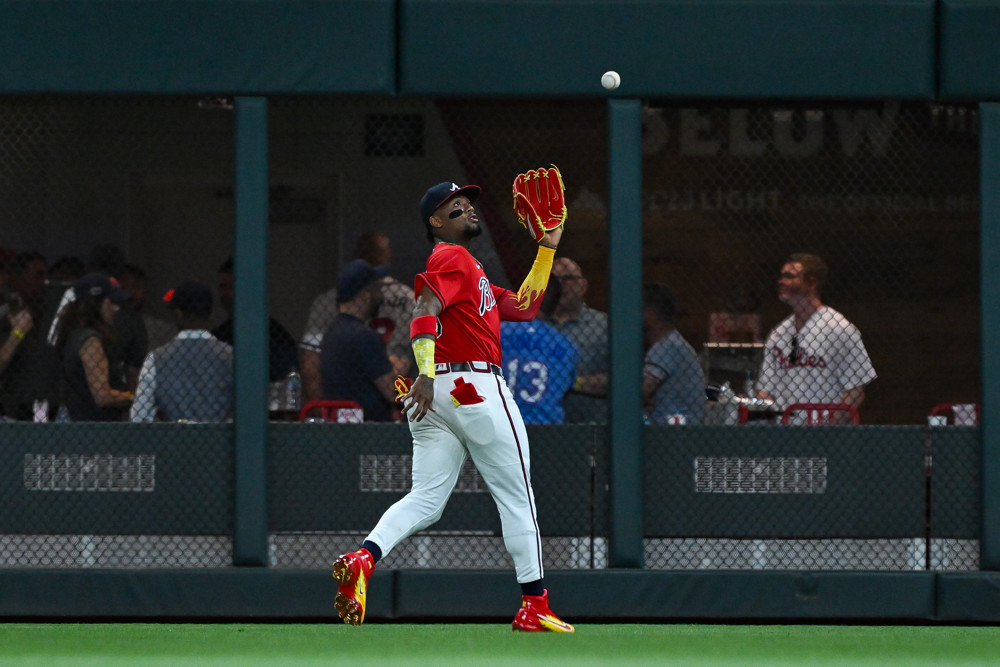
Defense A Big Part Of The Braves’ Early-Season Success
By
The Braves have two great infielders and chase down fly balls better than just about anyone else in the sport.
-
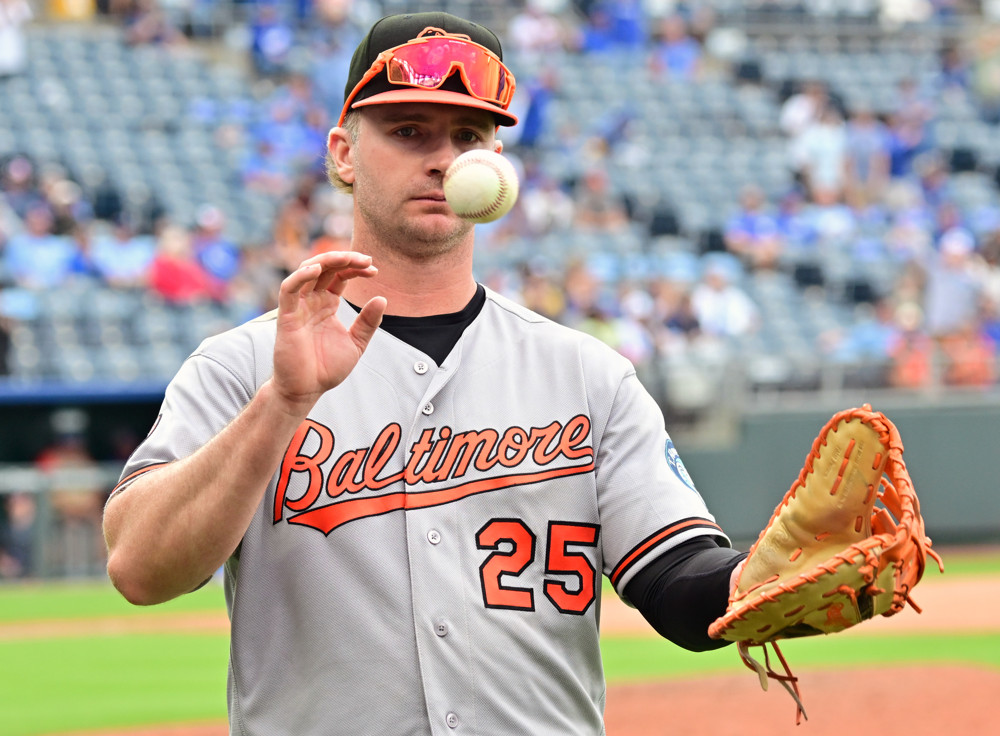
Pete Alonso’s Defensive Game Seems To Be Much Improved
By
On Thursday afternoon against the Rays, Orioles first baseman Pete Alonso hit a game-tying home run in the top of the sixth inning and made a nifty scoop of a throw in the dirt from his shortstop, Gunnar Henderson to end the inning. Nonetheless the Orioles were defeated when the Rays rallied from a 3-1…