Sports Info Solutions
Category: Football
-

2023 NFL Free Agent Analysis & Projections
By
We developed a Marcel-like system to evaluate the future potential of some prominent NFL signees.
-

The 2023 QB Conversation: How Teammate and Schematic Context Impacts It
By
We use SIS data on receiver quality and playcalling to make a better projection of how good the top-end QBs will be .
-
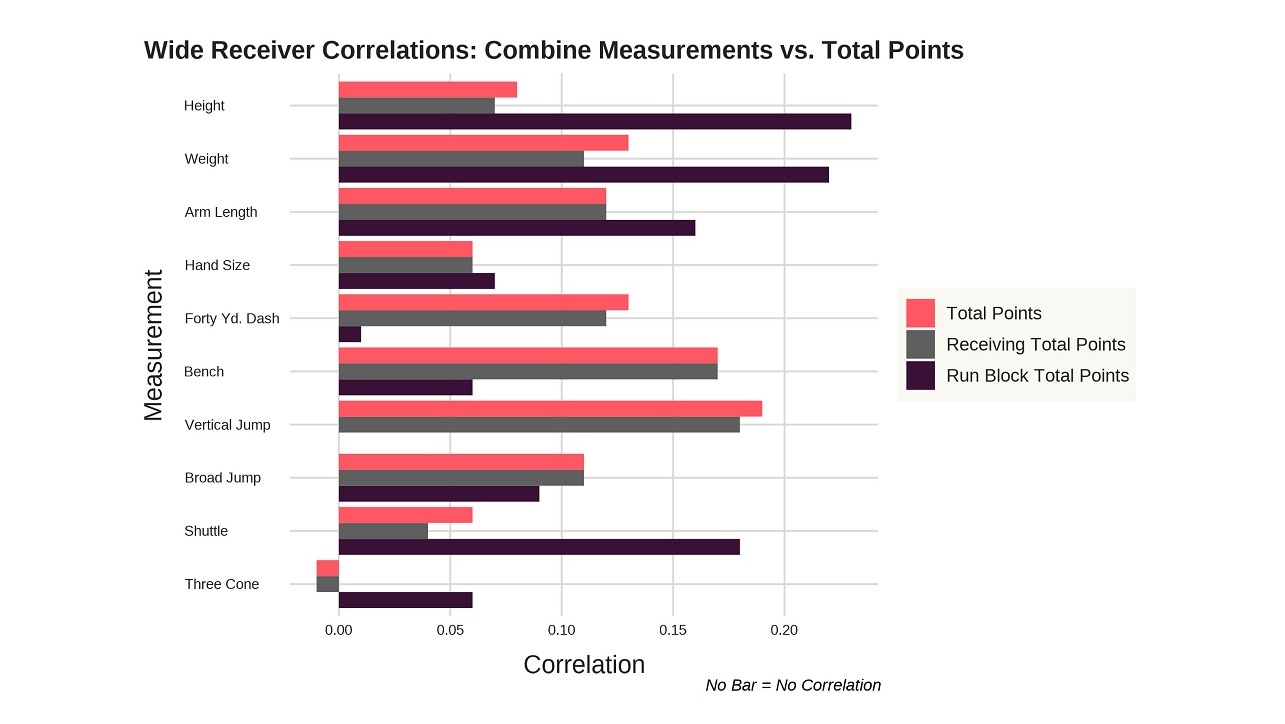
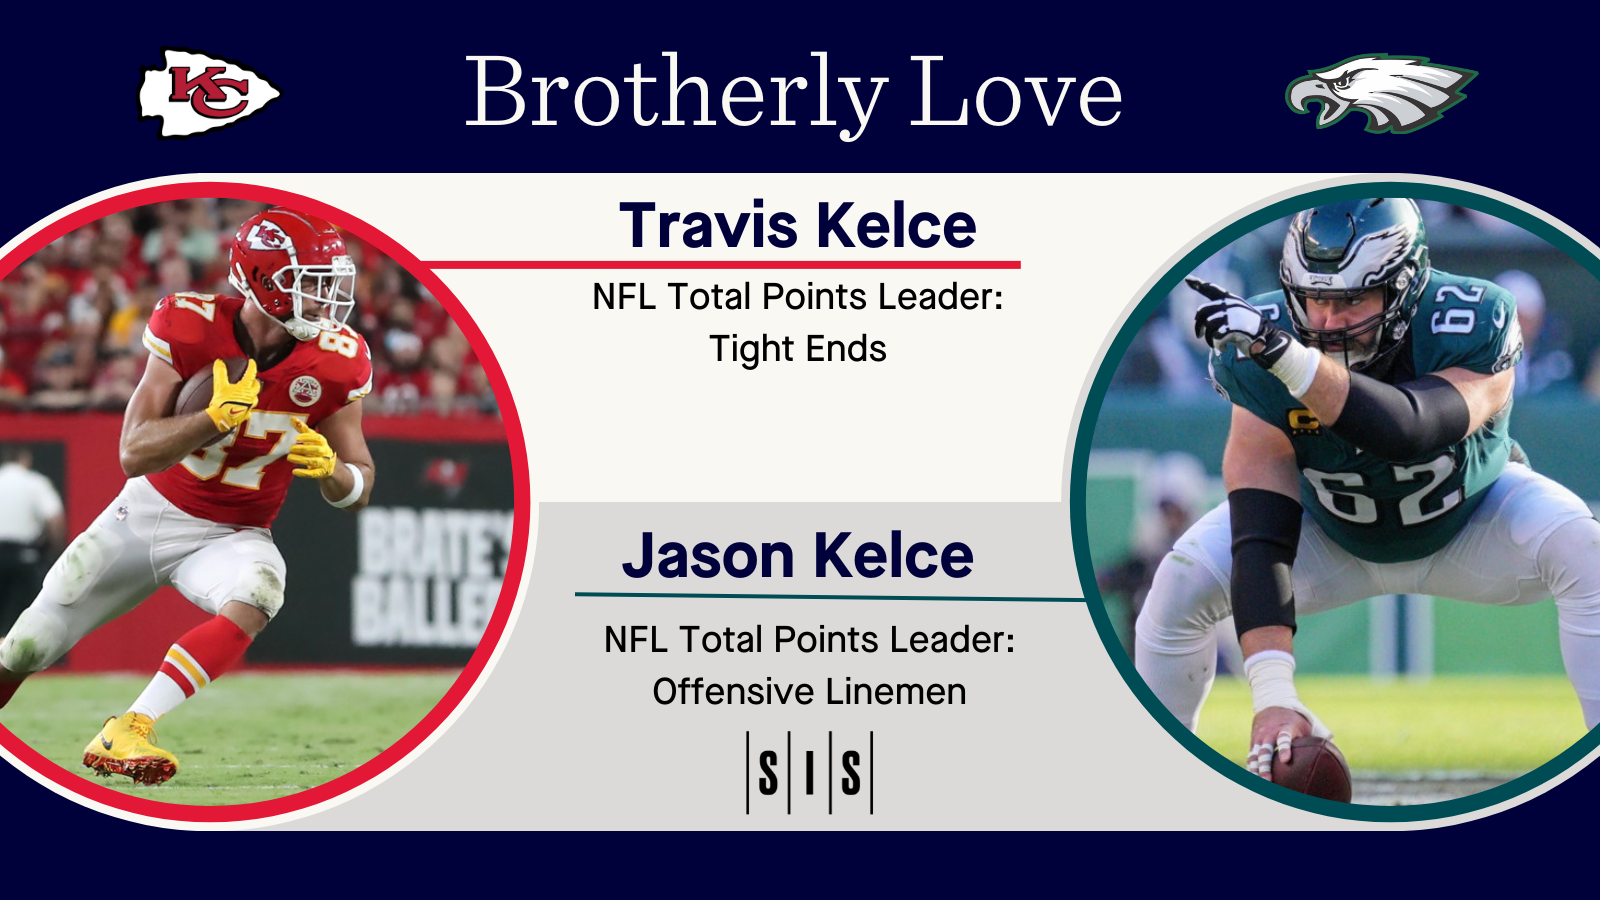
Study: Combine Measurements and Total Points – Do they Correlate?
By
Some numbers mean a little but do any of them mean a lot?
-
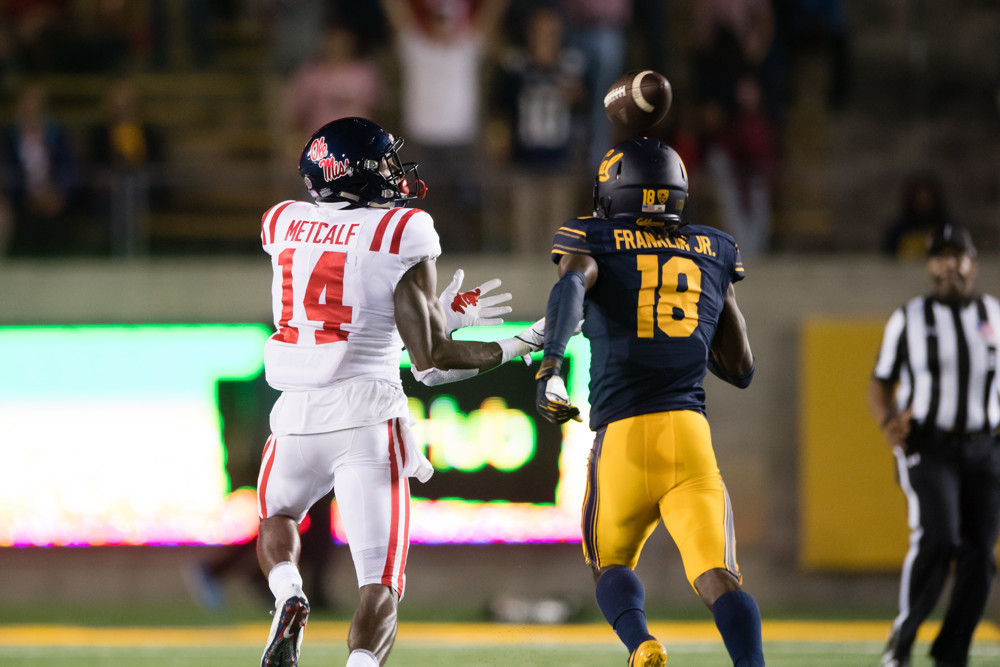
STUDY: What Does a College Receiver’s Route Tree Say About Their Pro Prospects?
By
DK Metcalf is among those who have shown that the lack of a diverse route tree can be overcome.
-
2022 SIS MAC All-Conference Team
By
It’s finally time to release our SIS All-Conference teams. We used our all-encompassing player value stat, Total Points, along with other metrics and our scouting work as leading references in putting together our team of selections for 2022, plus a few honorable mentions. You can learn more about Total Points and the statistics referenced here.…
-
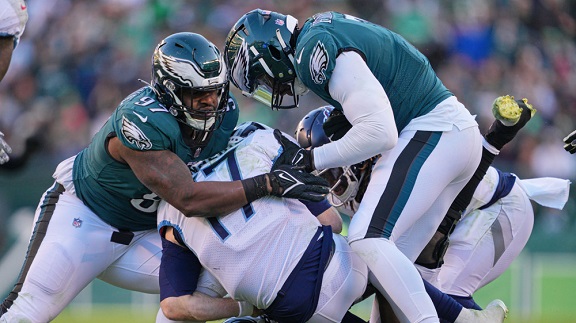
Inside The Eagles’ Pass Rush Plan
By
This year’s Eagles team is familiar with taking down an all-time great quarterback and they’ve often won the numbers game vs their opponents this season.
-
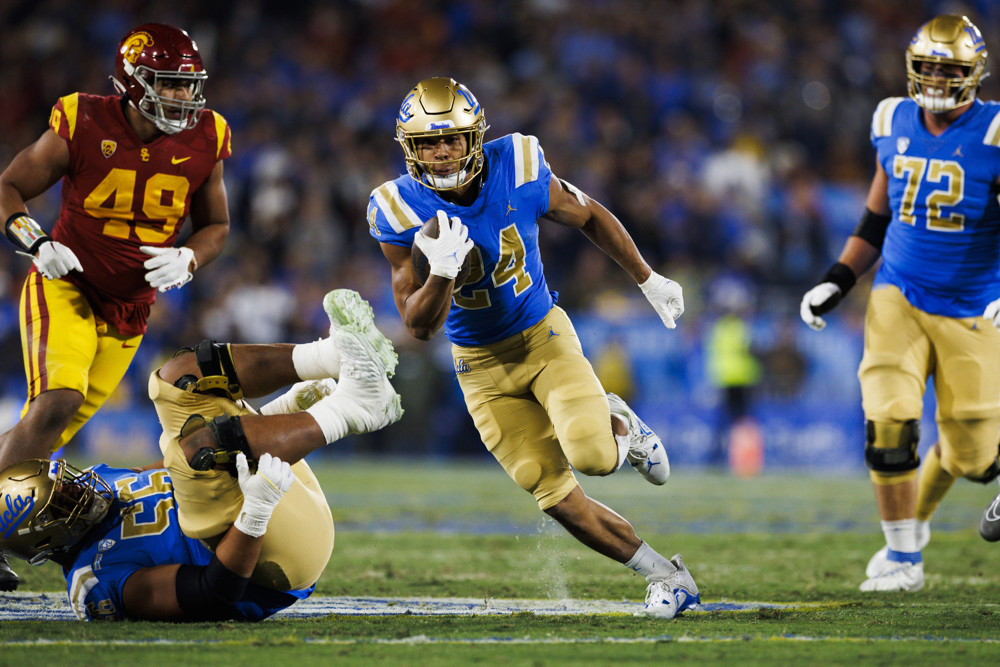
2022 SIS All-Pac-12 Teams
By
Zach Charbonnet was among the best running backs in a conference with a lot of them. See who joined him on our All-Pac-12 team.
-
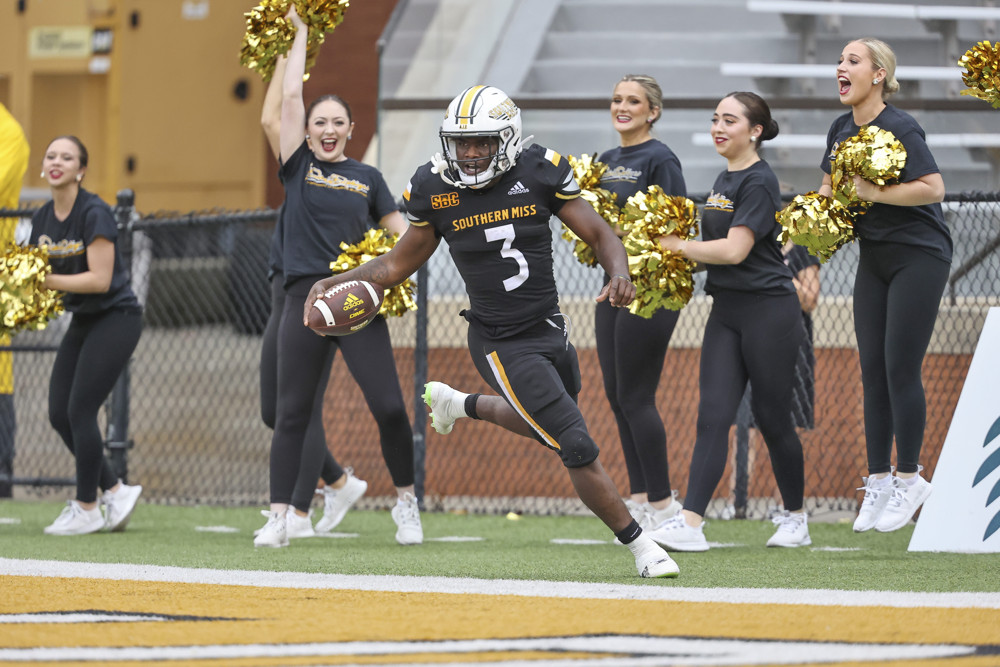
2022 SIS Sun Belt All-Conference Team
By
Frank Gore Jr. was among those highlighted. Who were the notable names to join him?
-
-
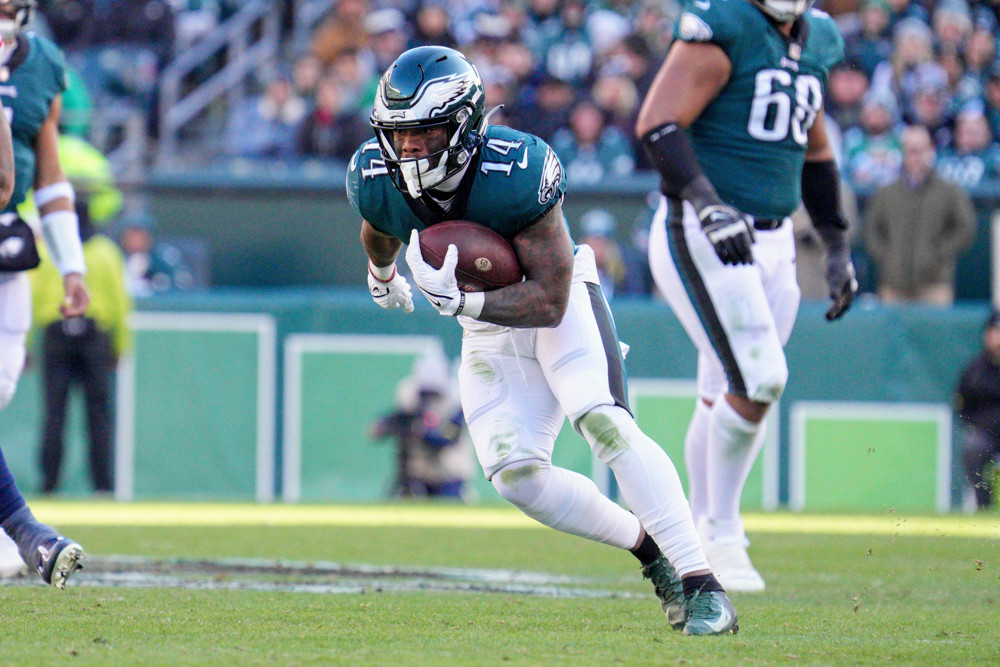
Heart & Soul: As Played by the Eagles’ Kenny G
By
Kenneth Gainwell is not a traditional player in any sense. We dive into how he’s made the most of his time on the field this season.