Sports Info Solutions
Category: Football
-
New football podcast: 5 games for Week 15
By
5 games to look at, including Chiefs-Saints and Browns-Giants
-
World’s No. 1 QB Update: Baker’s Cooking
By
By Mark Simon and Alex Vigderman Last week we wrote about how messy The World’s No. 1 QB Rankings got once you got past the top three quarterbacks. This past weekend proved our point. Patrick Mahomes and Aaron Rodgers each had above-average Points Above Average (PAA) in their respective games. Of the next six quarterbacks, four…
-
-
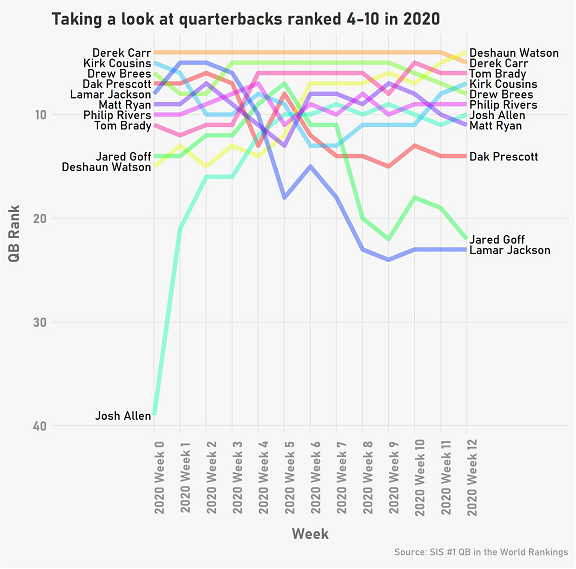
No. 1 QB in the World Update: We know No. 1, what about the others?
By
The No. 1 QB is in another world compared to everyone else. But is there any stability among the rest of the rankings?
-
New football podcast: All things Kansas City Chiefs
By
Adam Teicher of ESPN joins Matt and Aaron to talk about Patrick Mahomes, the concern on the offensive line and more.
-
A Primer on Total Points, Our Total Value Stat for Football
By
An explanation of the stat that attempts to best assess football player value.
-
New football podcast: Week 11 Preview
By
att and Aaron dive into exciting matchups between the Titans-Ravens, Packers-Colts, Chiefs-Raiders, and Rams-Buccaneers.
-
(Updated) World’s No. 1 Quarterback Rankings
By
Tom Brady went from worst of the week to best of the week. And continue to look out for Tua!
-
New football podcast episode: Week 10 Preview + Patrick Jones II Scouting Report
By
LISTEN Former NFL scout Matt Manocherian (@mattmano) of Sports Info Solutions and football analytics pioneer Aaron Schatz (@FO_ASchatz) of Football Outsiders (@fboutsiders) look at the most important games on the NFL Week 10 schedule. Matt and Aaron take in in-depth look at the Seahawks-Rams (1:56), Vikings-Bears (9:26), and Eagles-Giants (19:54) before welcoming SIS Lead Scout…
-
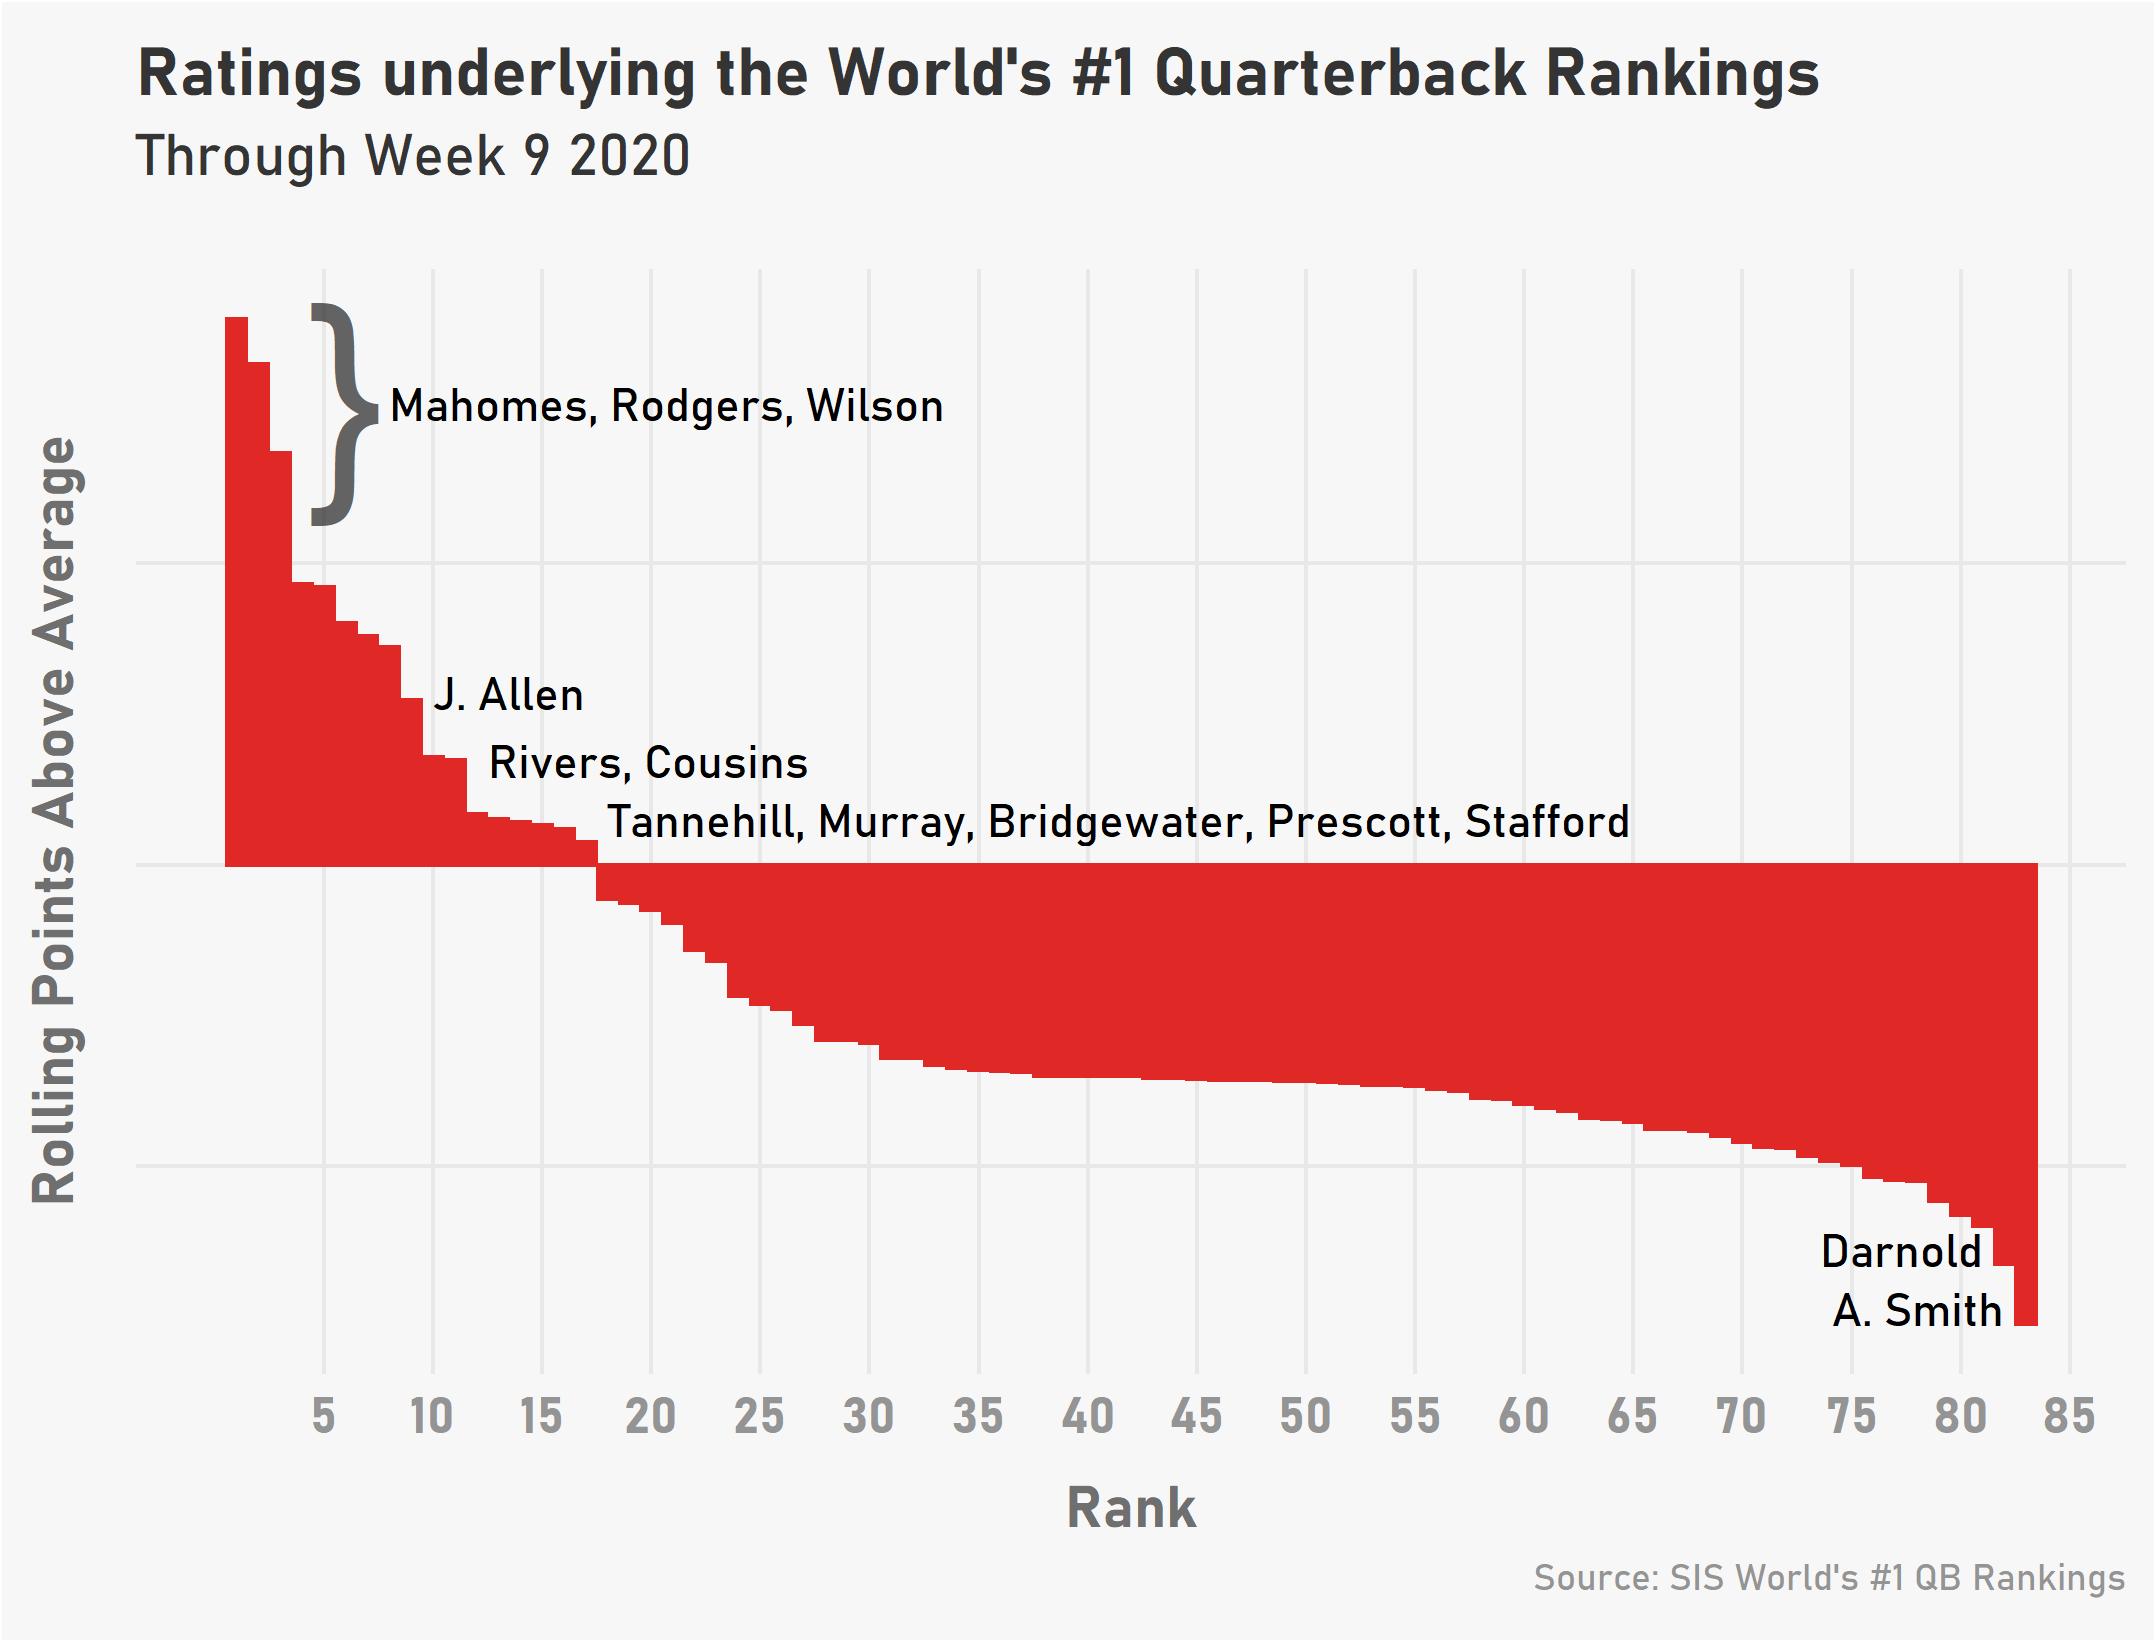
Updated World’s No. 1 QB Rankings (Through Week 9)
By
Aaron Rodgers and Russell Wilson continue their shuffle, and hello Tua Tagovailoa!