Sports Info Solutions
Category: 2023 MLB
-
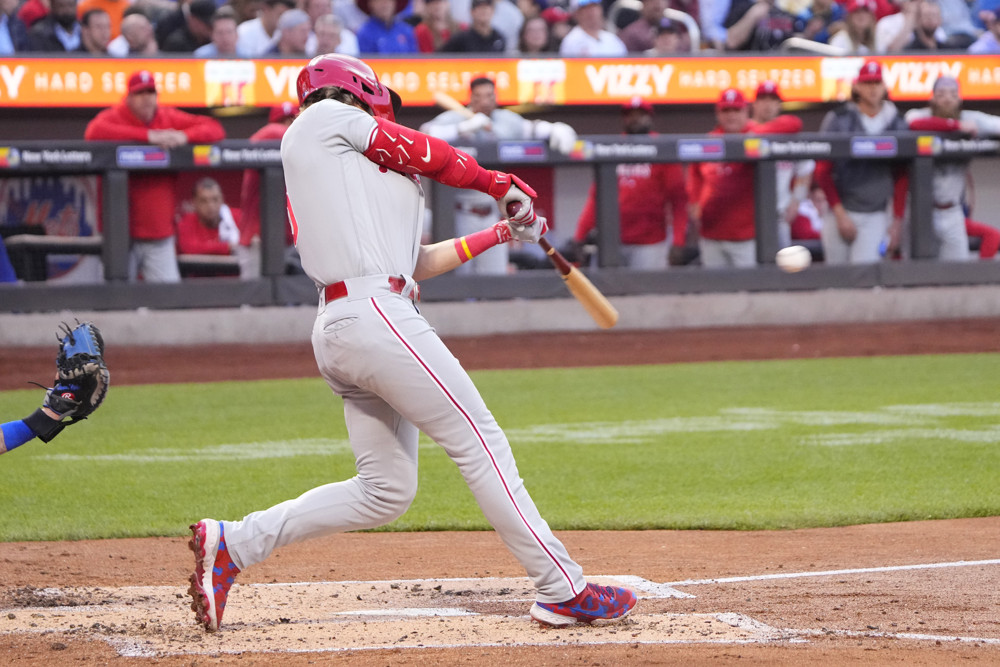
2023 Postseason Player To Watch: Bryson Stott
By
Bryson Stott showed a lot of growth from his rookie season to his second year – both at the plate and in the field.
-
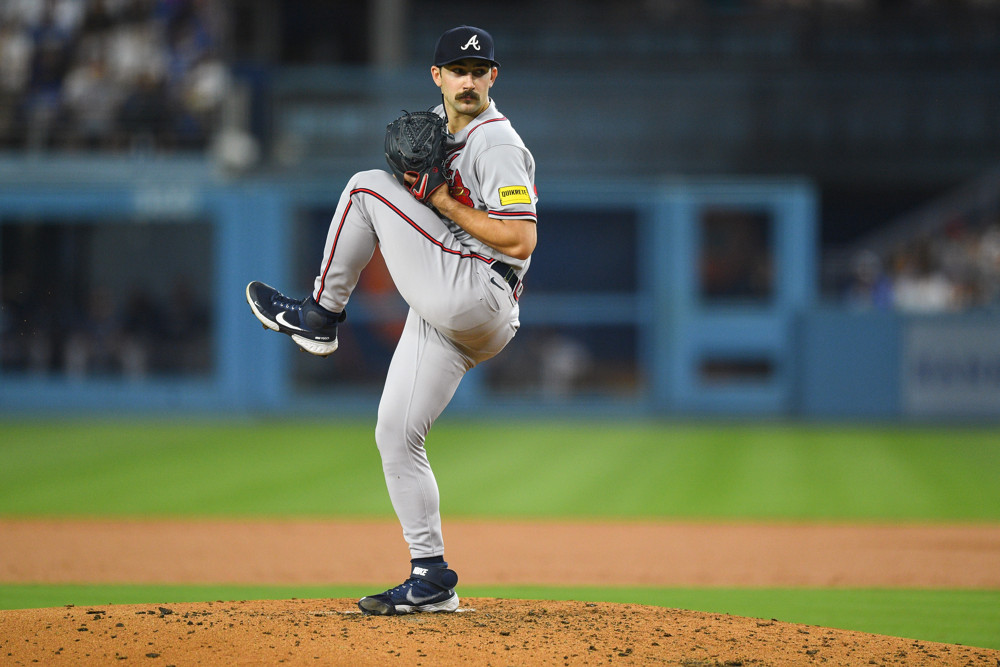
Examining the Relationship Between Pitch Delivery Type and Stolen Bases
By
Just how much less effective is a full leg kick than the alternatives. This is something we track at SIS!
-

Stat of the Week: Defense, The NL Cy Young Race, and Blake Snell
By
Snell has incredible numbers in spite of a high walk rate. How much help is he getting from his teammates?
-
August’s Defensive Players of the Month
By
2 winners this month, both of whom were dominant at their respective positions.
-
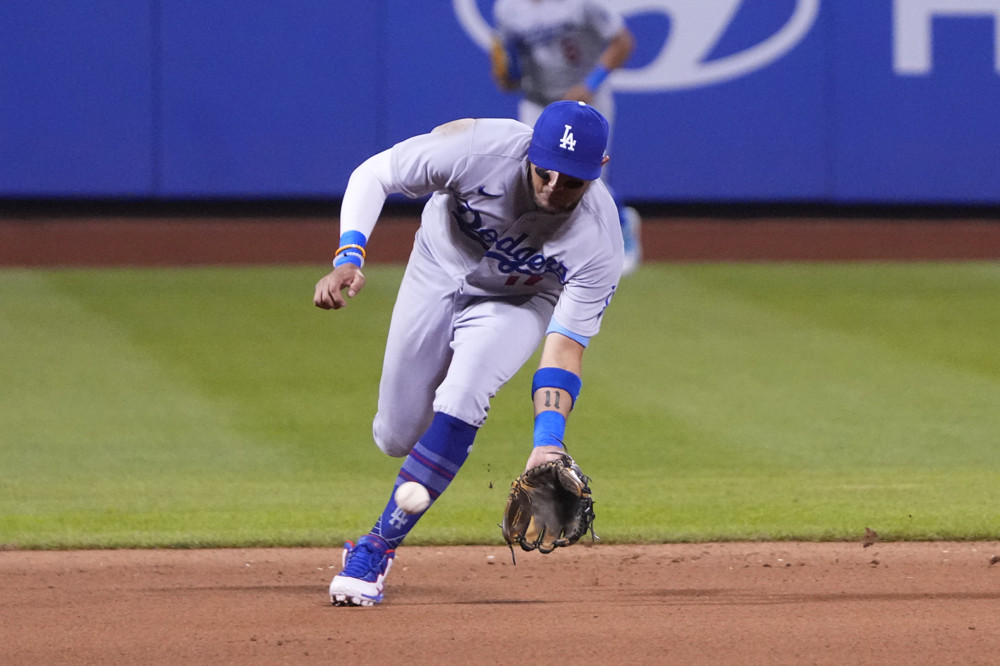
Dodgers Doing It On Defense Again
By
It took them a little while to get to this point but they’re once again among the best defensive teams in MLB
-

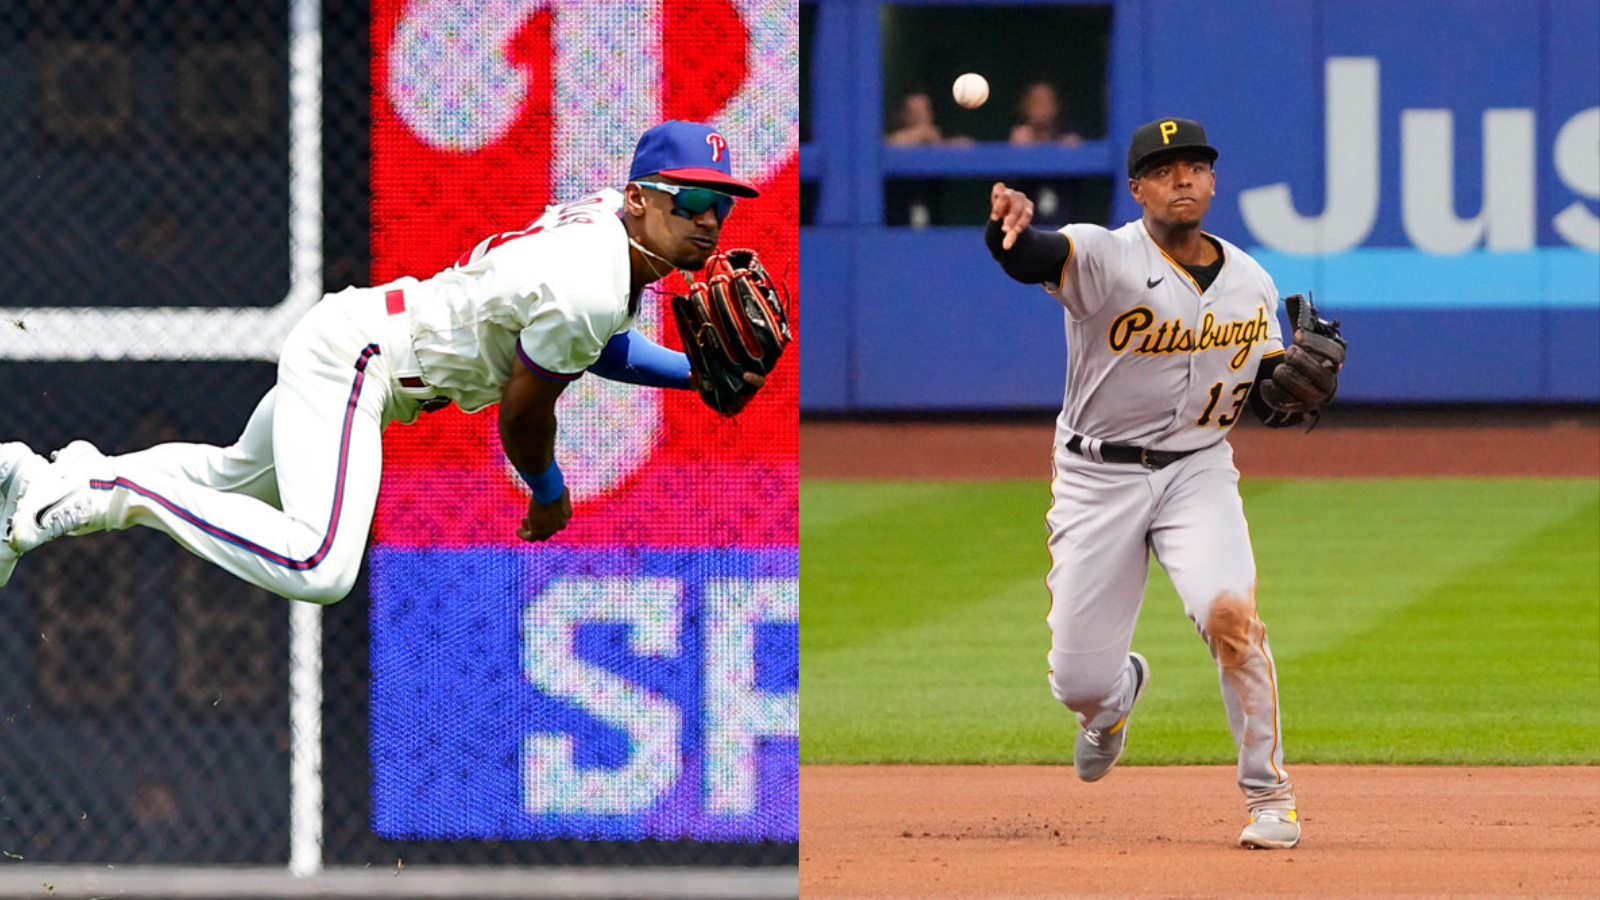
Stat of the Week: Rookies Making Big Defensive Impacts For Contenders
By
Johan Rojas is one of many young players getting it done.
-

The Transformation of Kodai Senga
By
How has the performance and usage of his pitches evolved from his time in Japan to now?
-

-
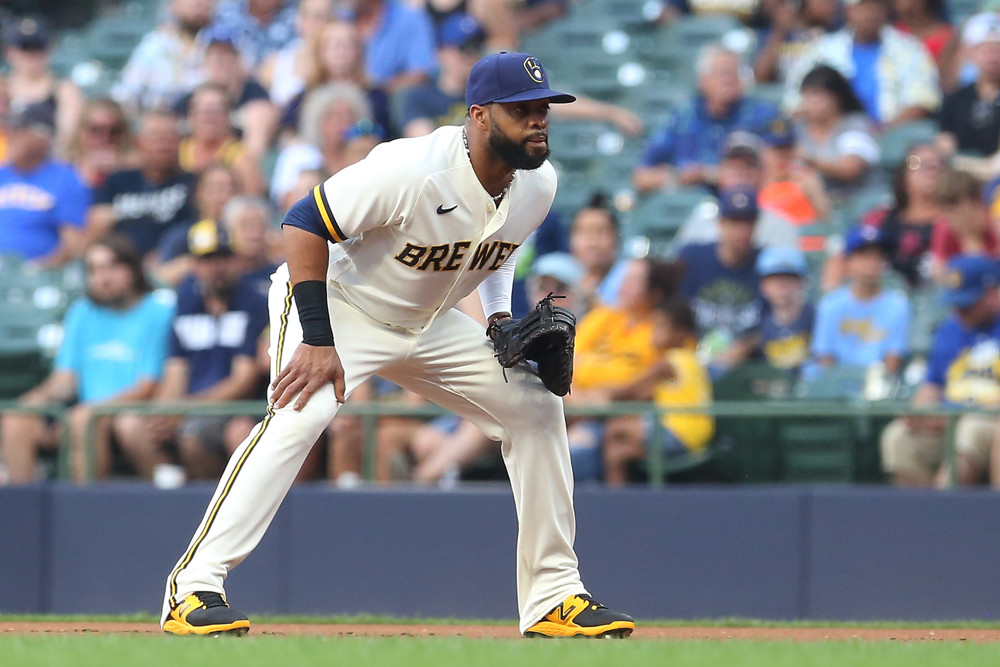
Stat of the Week: The Surprise Defensive Runs Saved Leader
By
Carlos Santana is No. 1 at first base? Yes, really!
-
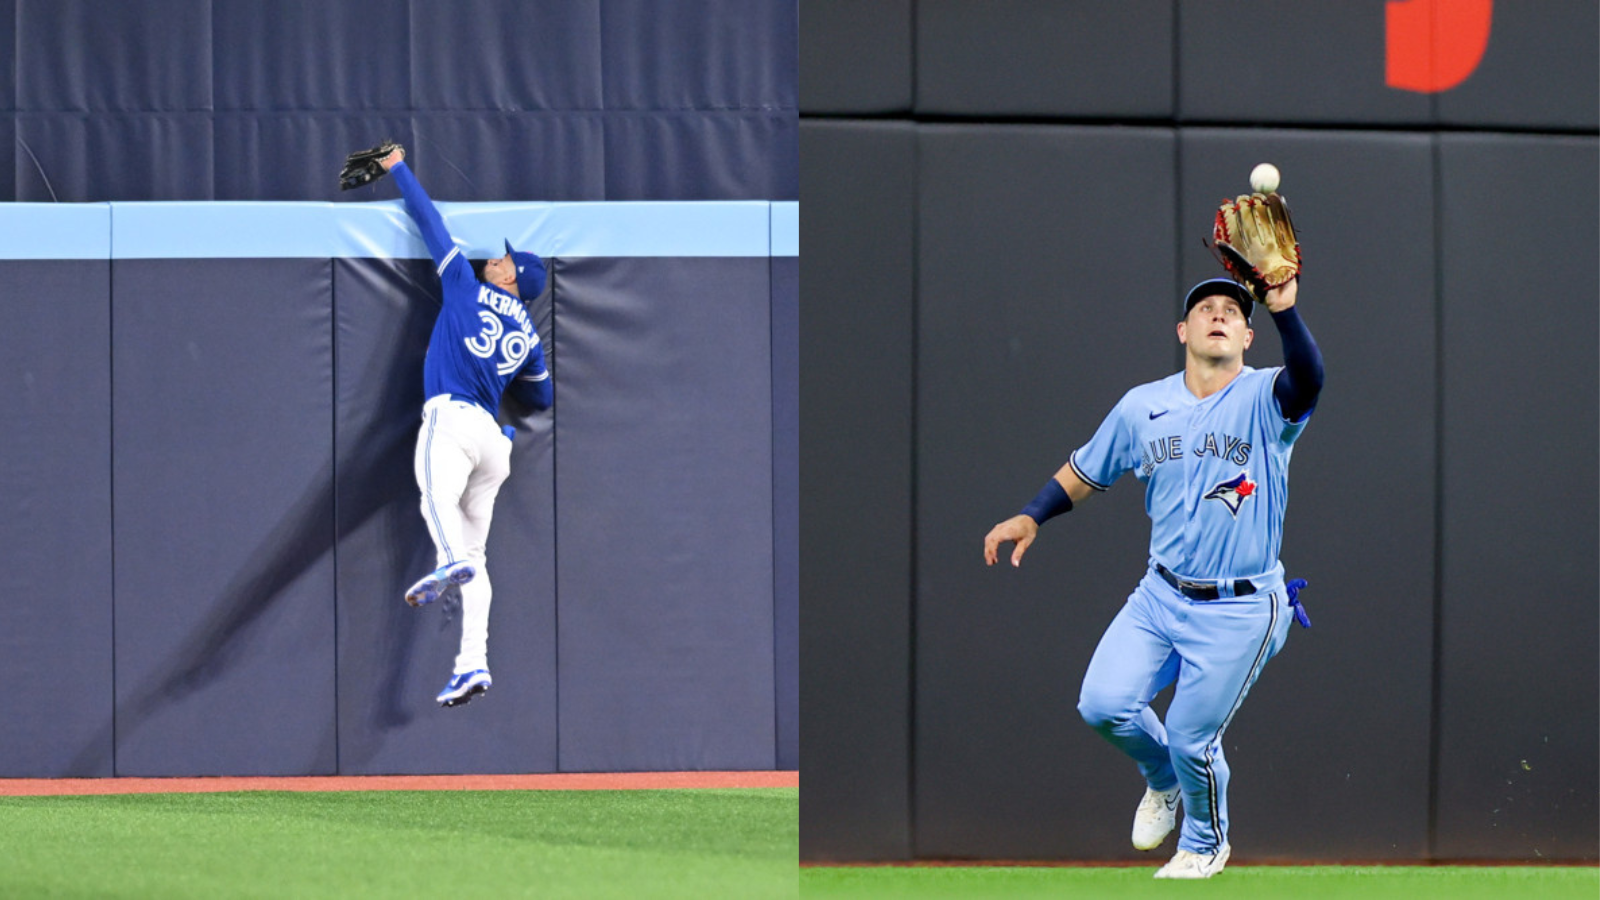
Going Deep: Blue Jays CFs On Run-Saving Tear
By
Why are the Blue Jays so much better than other teams in Defensive Runs Saved? Partly because they catch almost everything hit to deep center field