Sports Info Solutions
Category: Baseball
-
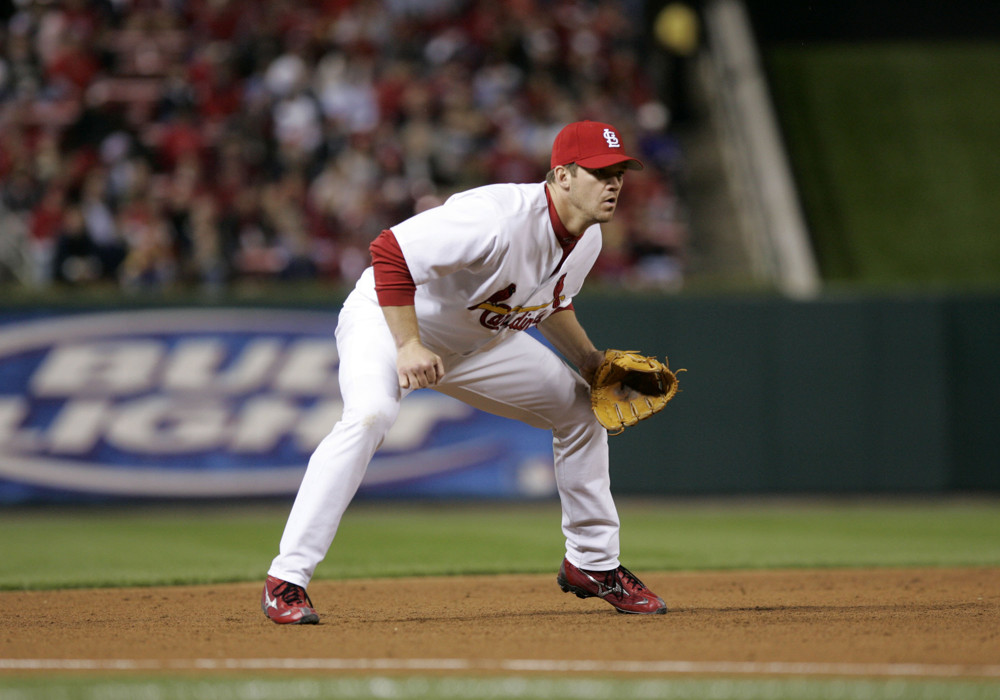
An Oral History of Scott Rolen’s Defensive Excellence
By
With help from many, we trace the Hall-of-Famer from his earliest days to his impeccable preparation and Gold Glove skills
-
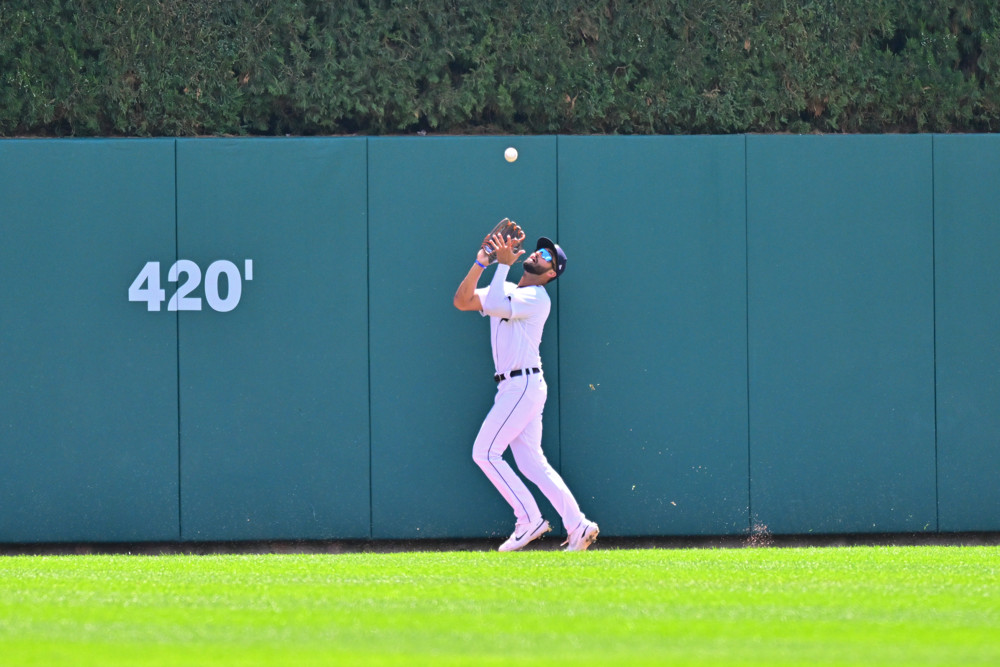
2023 Defensive Player to Watch: Riley Greene
By
Greene’s specialty was going back to get balls and making diving plays. We provide the numbers for both.
-
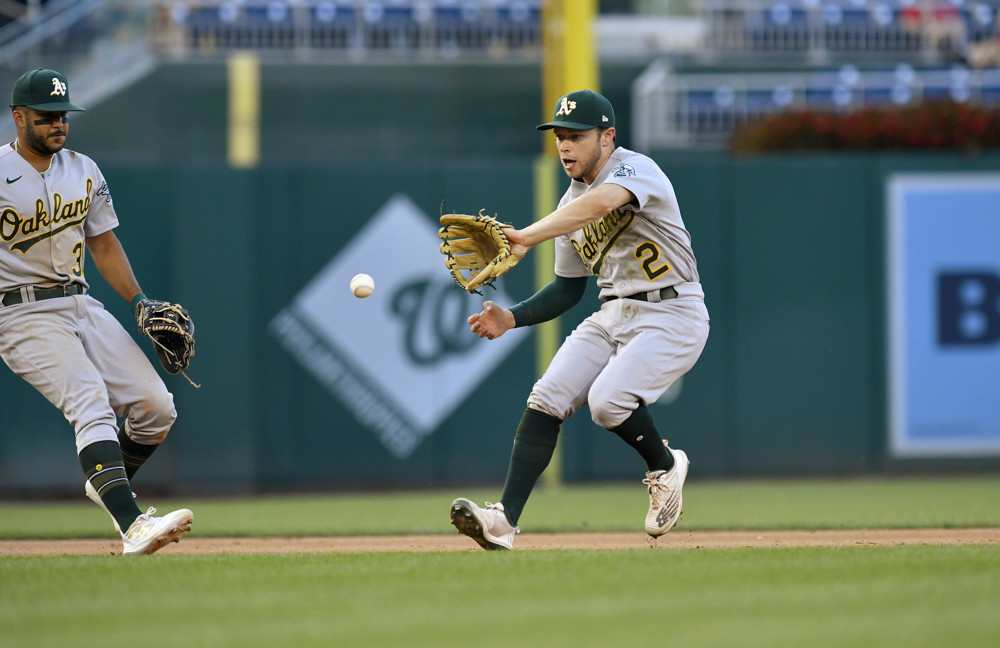
2023 Defender to Watch: Nick Allen
By
Allen shapes up as a Gold Glove (and Fielding Bible Award) candidate this season and his approach to the position is a little different from many shortstops.
-
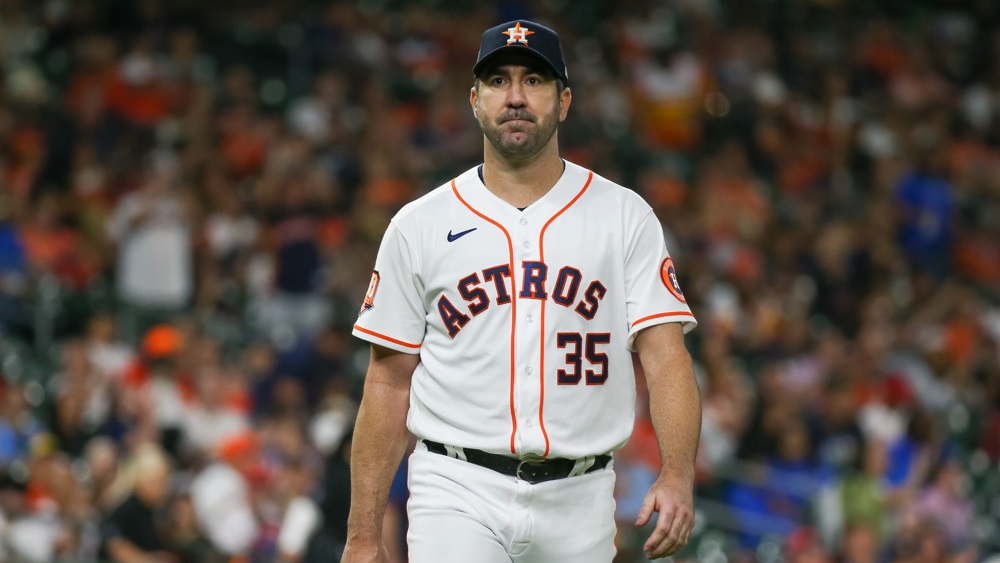
Stat of the Week: Defensive Support Behind Pitchers
By
The Astros defense was great behind Justin Verlander last season. Who else got big-time defensive support? Spoiler: A few pitchers headed to new teams.
-
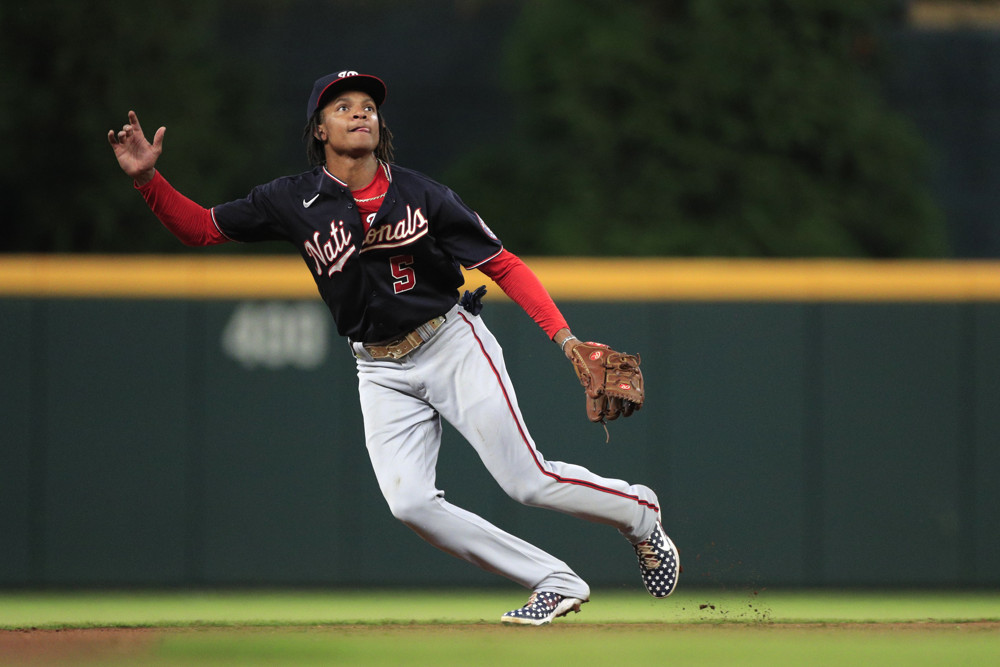
2023 Defenders To Watch: C.J. Abrams & Luis Garcia
By
The Nationals set a 20-year low for Defensive Runs Saved at shortstop but a late-2022 acquisition and switch has us intrigued for 2023.
-
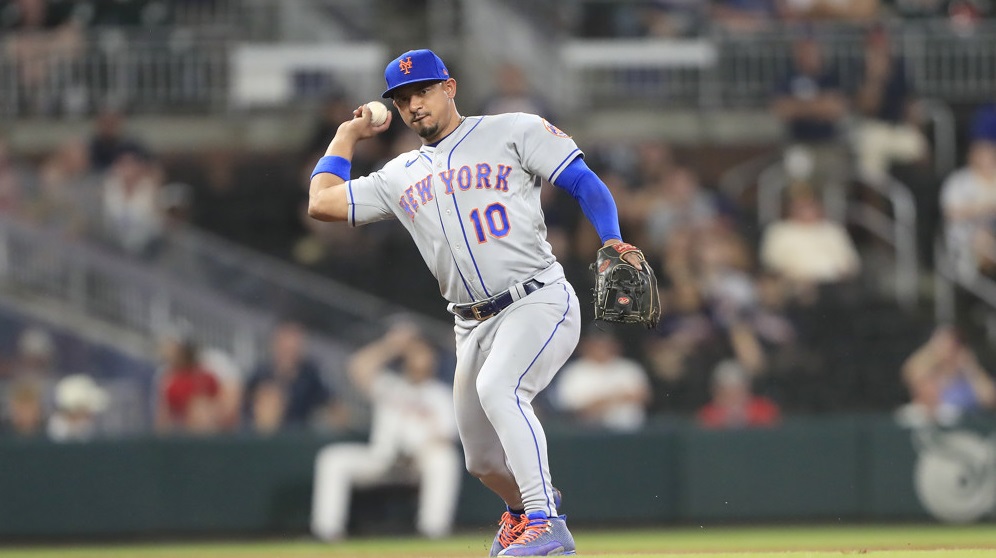
2023 Defender To Watch: Eduardo Escobar
By
Escobar is coming off the worst defensive season of his career. We take note of his biggest issue.
-
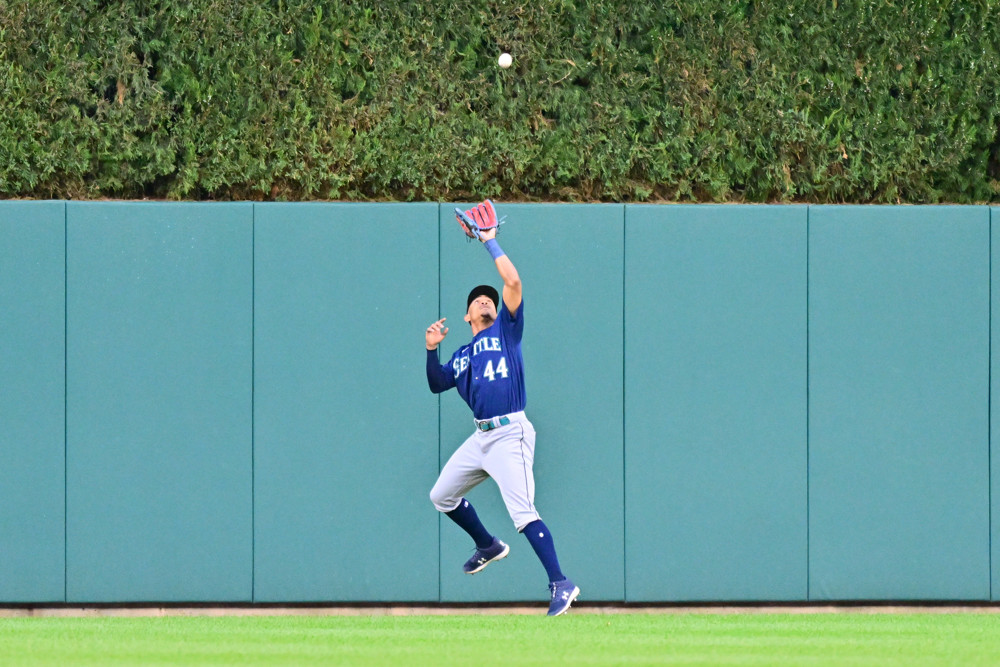
2023 Defender To Watch: Julio Rodriguez
By
Rodriguez made the Mariners so much better defensively last season. We share one area in which he can improve and another where he’s advised to be careful.
-
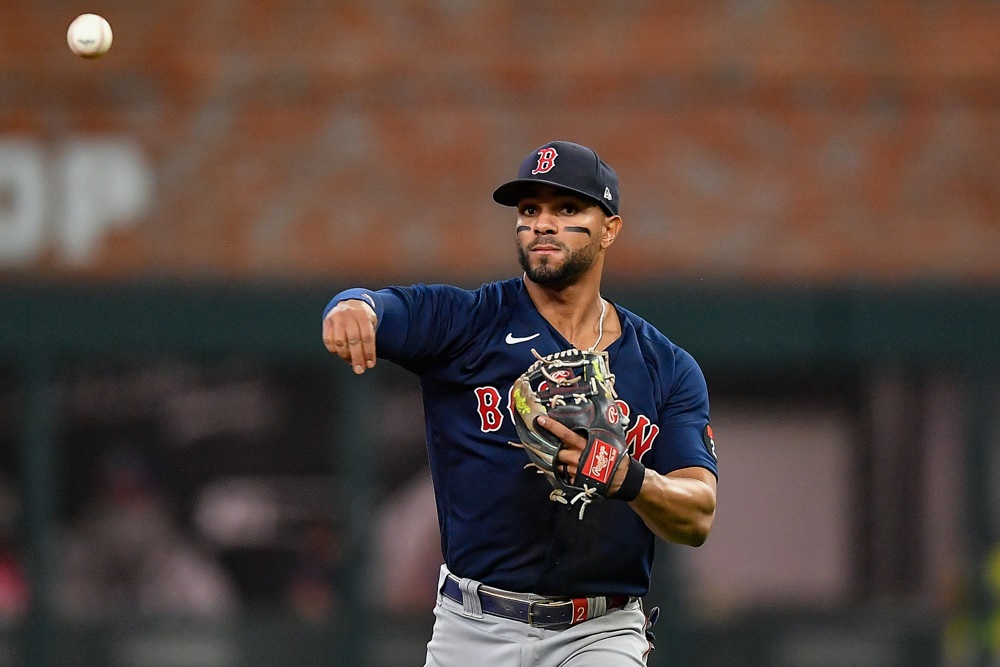
2023 Defender To Watch: Xander Bogaerts
By
The Padres have handed shortstop to a player who has made significant strides in his game, though one concern looms.
-
Why Isiah Kiner-Falefa Rates Well in Defensive Runs Saved
By
You may not be impressed with his defense but our numbers have him doing alright.
-
Stat of the Week: Celebrating Pitcher and Catcher Defensive Excellence
By
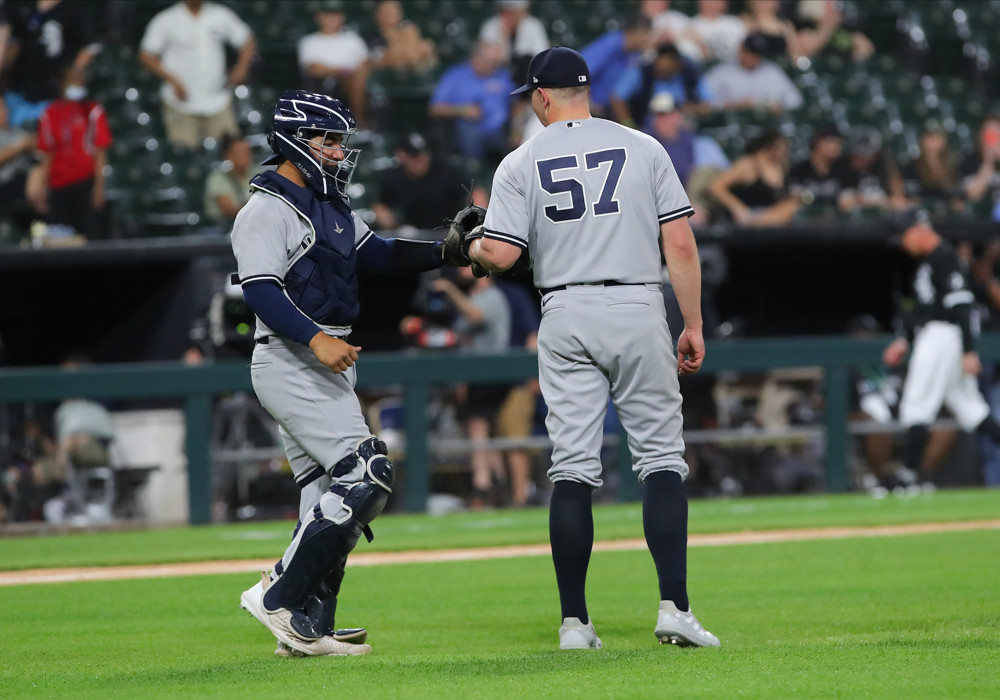
Pitchers and catchers report to their MLB teams this week. To celebrate as we get ready for baseball, here are nine pitcher and catcher-related stats celebrating their defensive play. 1) The catcher leader in Defensive Runs Saved last season was Jose Trevino of the Yankees with 21. Adley Rutschman of the Orioles and Cal Raleigh…